Markets
Most Banks Are Screwing Up On Their Stock Picks
Let’s say that a bank such as Goldman Sachs publishes a recommendation to “Buy Stock X”.
It’s hard to ignore a bet by a powerful investment bank such as Goldman. We are mere mortals in the pecking order, and they are supposed to be the all-knowing smart money from Wall Street.
Do we buy the stock, or is it simply wiser to pass?
Bank Performance Overall
The folks at InterTrader have done considerable legwork to dive deep into the data on investment bank recommendations made in 2015. They looked at every bet made by the 16 top banks throughout the year to assess both potential returns and accuracy.
The results are pretty underwhelming.
If you bought every stock recommended and held until the end of the year, here’s what your performance would look like:
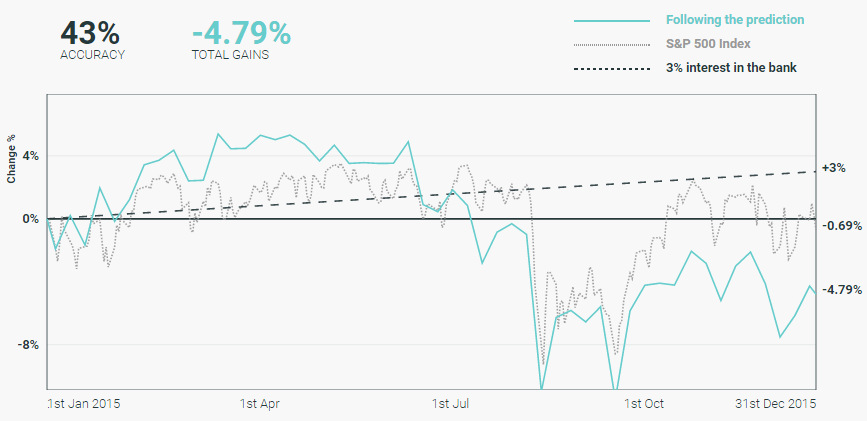
Overall, when holding the stock picks for the year, banks were only 43% accurate with their predictions.
That’s right – flipping a coin would have been potentially more effective than buying bank stock picks, which ended up down -4.79% on the year. The S&P 500 finished down only -0.69%, but simply just making any interest in a savings account would have been more effective as well.
A Closer Look at Individual Banks
While banks as a whole struggled with picks in 2015, it’s also important to look at banks on a more micro level to see how they performed.
Here’s a look at the recommendations by Deutsche Bank, and how they did:
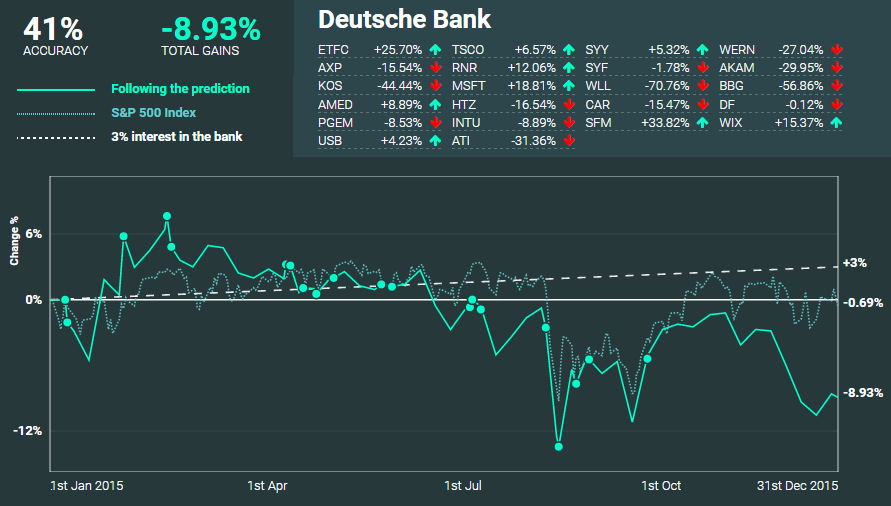
Deutsche Bank nailed 41% of their predictions, and had a -8.93% return if picks were held throughout the year.
As you can see, some of their picks such as Microsoft and Wix.com gained double digits. On the other hand, recommendations such as Whiting Petroleum got absolutely crushed throughout the year, dropping -70.1%.
Overall, Deutsche Bank’s performance here definitely didn’t do much to help the struggling company get out of its rut.
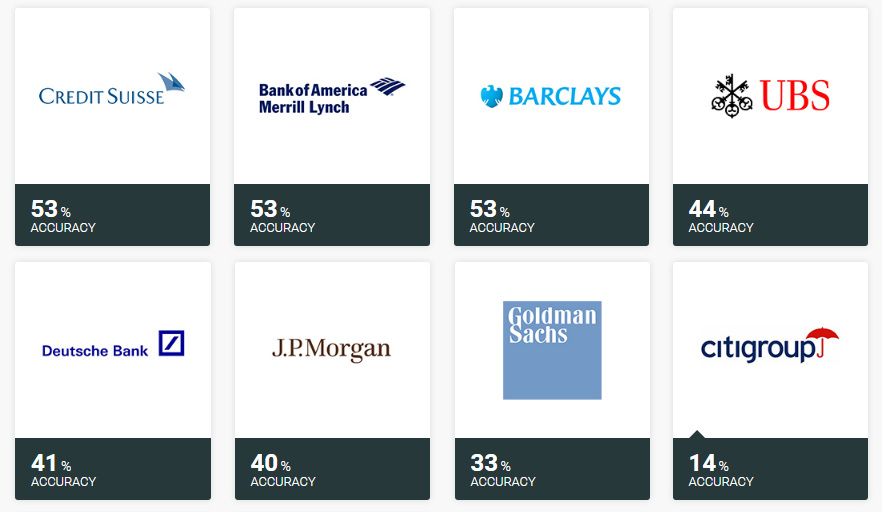
Which Banks Were Most Accurate?
Here are the banks, from best to worst, based on accuracy of their calls:
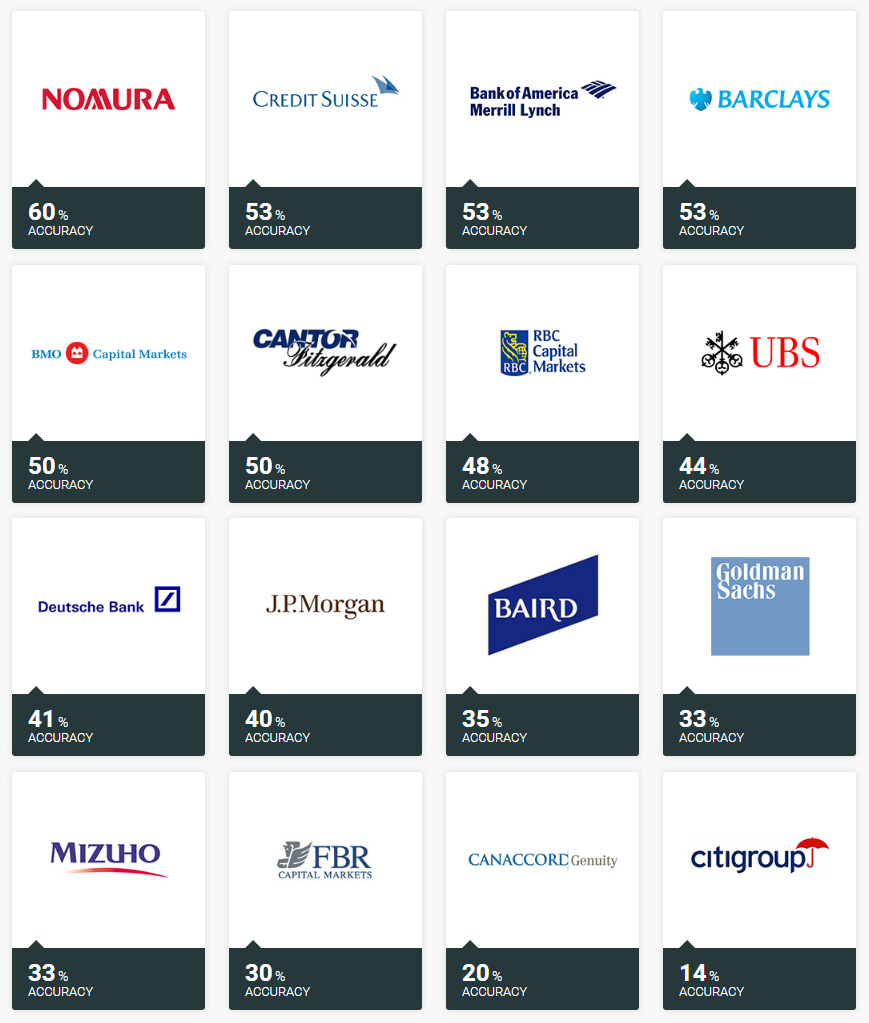
Nomura, Credit Suisse, BAML, and Barclays all batted above .500 if stocks were held throughout the year, while 10 banks all did worse than a coin flip.
Citigroup had an off year, only nailing 14% of its picks.
Which Banks Had the Best Returns?
Here are the banks, from best to worst, based on the performance of these recommendations:
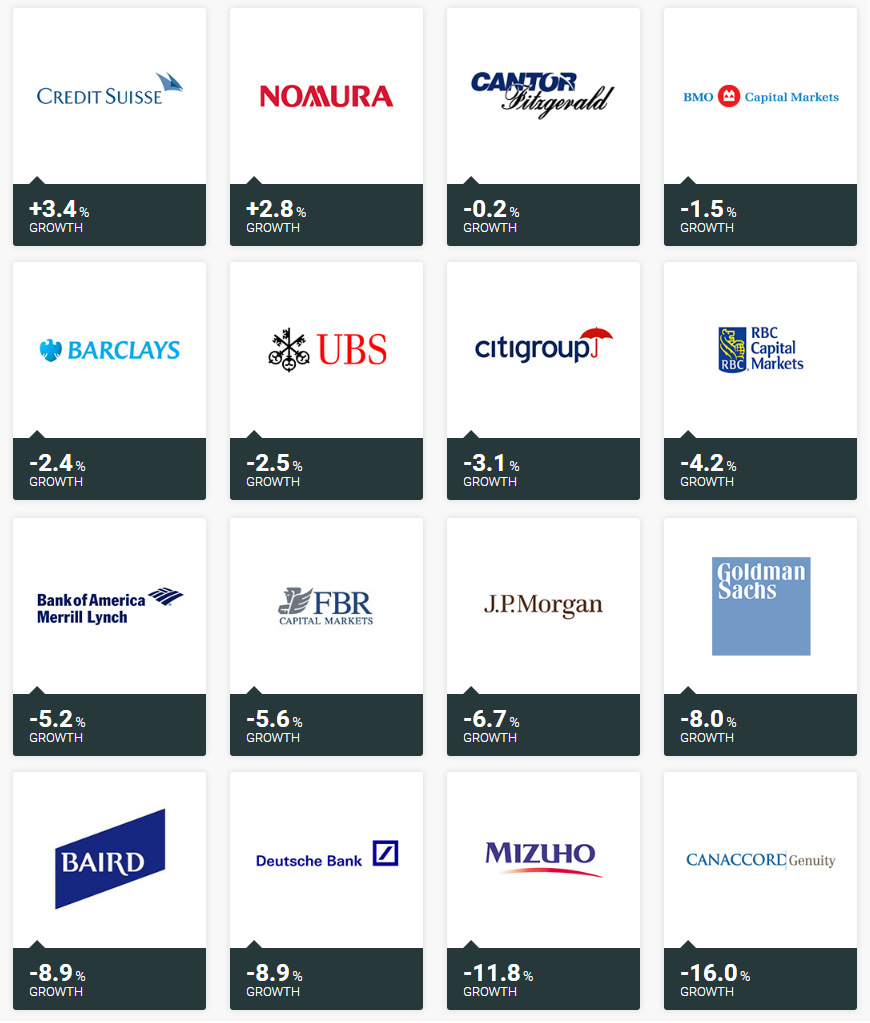
Just two banks, Credit Suisse and Nomura, had positive returns if stocks were held through the year. Meanwhile, Canaccord Genuity’s picks were knocked down -16% over the course of 2015.
An Important Caveat
Throughout the above article, we are showing the results if stock picks were held from when they were made until the end of the year.
However, it is worth noting that the investment banks actually did slightly better if picks were held for shorter durations of time:
| Time | Accuracy | Gains % |
|---|---|---|
| 30 Days | 55% | 0.80% |
| 90 Days | 49% | -1.48% |
| 180 Days | 42% | -3.66% |
| End of Year | 43% | -4.79% |
In other words – if you sold all stock recommendations exactly 30 days after buying, you would have actually made a 0.8% return throughout the year. This is still a lower return than a savings account, but it is an improvement on losing -4.79%!
For a more in-depth dive into the data, we highly recommend checking out InterTrader’s interactive version of the results.


Markets
The European Stock Market: Attractive Valuations Offer Opportunities
On average, the European stock market has valuations that are nearly 50% lower than U.S. valuations. But how can you access the market?


European Stock Market: Attractive Valuations Offer Opportunities
Europe is known for some established brands, from L’Oréal to Louis Vuitton. However, the European stock market offers additional opportunities that may be lesser known.
The above infographic, sponsored by STOXX, outlines why investors may want to consider European stocks.
Attractive Valuations
Compared to most North American and Asian markets, European stocks offer lower or comparable valuations.
| Index | Price-to-Earnings Ratio | Price-to-Book Ratio |
|---|---|---|
| EURO STOXX 50 | 14.9 | 2.2 |
| STOXX Europe 600 | 14.4 | 2 |
| U.S. | 25.9 | 4.7 |
| Canada | 16.1 | 1.8 |
| Japan | 15.4 | 1.6 |
| Asia Pacific ex. China | 17.1 | 1.8 |
Data as of February 29, 2024. See graphic for full index names. Ratios based on trailing 12 month financials. The price to earnings ratio excludes companies with negative earnings.
On average, European valuations are nearly 50% lower than U.S. valuations, potentially offering an affordable entry point for investors.
Research also shows that lower price ratios have historically led to higher long-term returns.
Market Movements Not Closely Connected
Over the last decade, the European stock market had low-to-moderate correlation with North American and Asian equities.
The below chart shows correlations from February 2014 to February 2024. A value closer to zero indicates low correlation, while a value of one would indicate that two regions are moving in perfect unison.
| EURO STOXX 50 | STOXX EUROPE 600 | U.S. | Canada | Japan | Asia Pacific ex. China |
|
|---|---|---|---|---|---|---|
| EURO STOXX 50 | 1.00 | 0.97 | 0.55 | 0.67 | 0.24 | 0.43 |
| STOXX EUROPE 600 | 1.00 | 0.56 | 0.71 | 0.28 | 0.48 | |
| U.S. | 1.00 | 0.73 | 0.12 | 0.25 | ||
| Canada | 1.00 | 0.22 | 0.40 | |||
| Japan | 1.00 | 0.88 | ||||
| Asia Pacific ex. China | 1.00 |
Data is based on daily USD returns.
European equities had relatively independent market movements from North American and Asian markets. One contributing factor could be the differing sector weights in each market. For instance, technology makes up a quarter of the U.S. market, but health care and industrials dominate the broader European market.
Ultimately, European equities can enhance portfolio diversification and have the potential to mitigate risk for investors.
Tracking the Market
For investors interested in European equities, STOXX offers a variety of flagship indices:
| Index | Description | Market Cap |
|---|---|---|
| STOXX Europe 600 | Pan-regional, broad market | €10.5T |
| STOXX Developed Europe | Pan-regional, broad-market | €9.9T |
| STOXX Europe 600 ESG-X | Pan-regional, broad market, sustainability focus | €9.7T |
| STOXX Europe 50 | Pan-regional, blue-chip | €5.1T |
| EURO STOXX 50 | Eurozone, blue-chip | €3.5T |
Data is as of February 29, 2024. Market cap is free float, which represents the shares that are readily available for public trading on stock exchanges.
The EURO STOXX 50 tracks the Eurozone’s biggest and most traded companies. It also underlies one of the world’s largest ranges of ETFs and mutual funds. As of November 2023, there were €27.3 billion in ETFs and €23.5B in mutual fund assets under management tracking the index.
“For the past 25 years, the EURO STOXX 50 has served as an accurate, reliable and tradable representation of the Eurozone equity market.”
— Axel Lomholt, General Manager at STOXX
Partnering with STOXX to Track the European Stock Market
Are you interested in European equities? STOXX can be a valuable partner:
- Comprehensive, liquid and investable ecosystem
- European heritage, global reach
- Highly sophisticated customization capabilities
- Open architecture approach to using data
- Close partnerships with clients
- Part of ISS STOXX and Deutsche Börse Group
With a full suite of indices, STOXX can help you benchmark against the European stock market.
Learn how STOXX’s European indices offer liquid and effective market access.

-

 Economy4 days ago
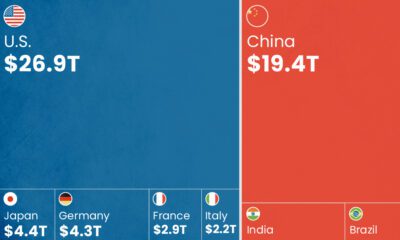
Economic Growth Forecasts for G7 and BRICS Countries in 2024
The IMF has released its economic growth forecasts for 2024. How do the G7 and BRICS countries compare?
-

 Markets2 weeks ago
U.S. Debt Interest Payments Reach $1 Trillion
U.S. debt interest payments have surged past the $1 trillion dollar mark, amid high interest rates and an ever-expanding debt burden.
-

 United States2 weeks ago
Ranked: The Largest U.S. Corporations by Number of Employees
We visualized the top U.S. companies by employees, revealing the massive scale of retailers like Walmart, Target, and Home Depot.
-

 Markets2 weeks ago
The Top 10 States by Real GDP Growth in 2023
This graphic shows the states with the highest real GDP growth rate in 2023, largely propelled by the oil and gas boom.
-

 Markets3 weeks ago
Ranked: The World’s Top Flight Routes, by Revenue
In this graphic, we show the highest earning flight routes globally as air travel continued to rebound in 2023.
-

 Markets3 weeks ago
Ranked: The Most Valuable Housing Markets in America
The U.S. residential real estate market is worth a staggering $47.5 trillion. Here are the most valuable housing markets in the country.


-

 Lithium6 days ago
Ranked: The Top 10 EV Battery Manufacturers in 2023
-

 Green2 weeks ago
Top Countries By Forest Growth Since 2001
-
United States2 weeks ago
Ranked: The Largest U.S. Corporations by Number of Employees
-

 Maps2 weeks ago
The Largest Earthquakes in the New York Area (1970-2024)
-

 Green2 weeks ago
Ranked: The Countries With the Most Air Pollution in 2023
-

 Green2 weeks ago
Ranking the Top 15 Countries by Carbon Tax Revenue
-
Markets2 weeks ago
U.S. Debt Interest Payments Reach $1 Trillion
-

 Mining2 weeks ago
Gold vs. S&P 500: Which Has Grown More Over Five Years?