Misc
Visualizing Which Countries Drink the Most Beer


Visualizing Which Countries Drink the Most Beer
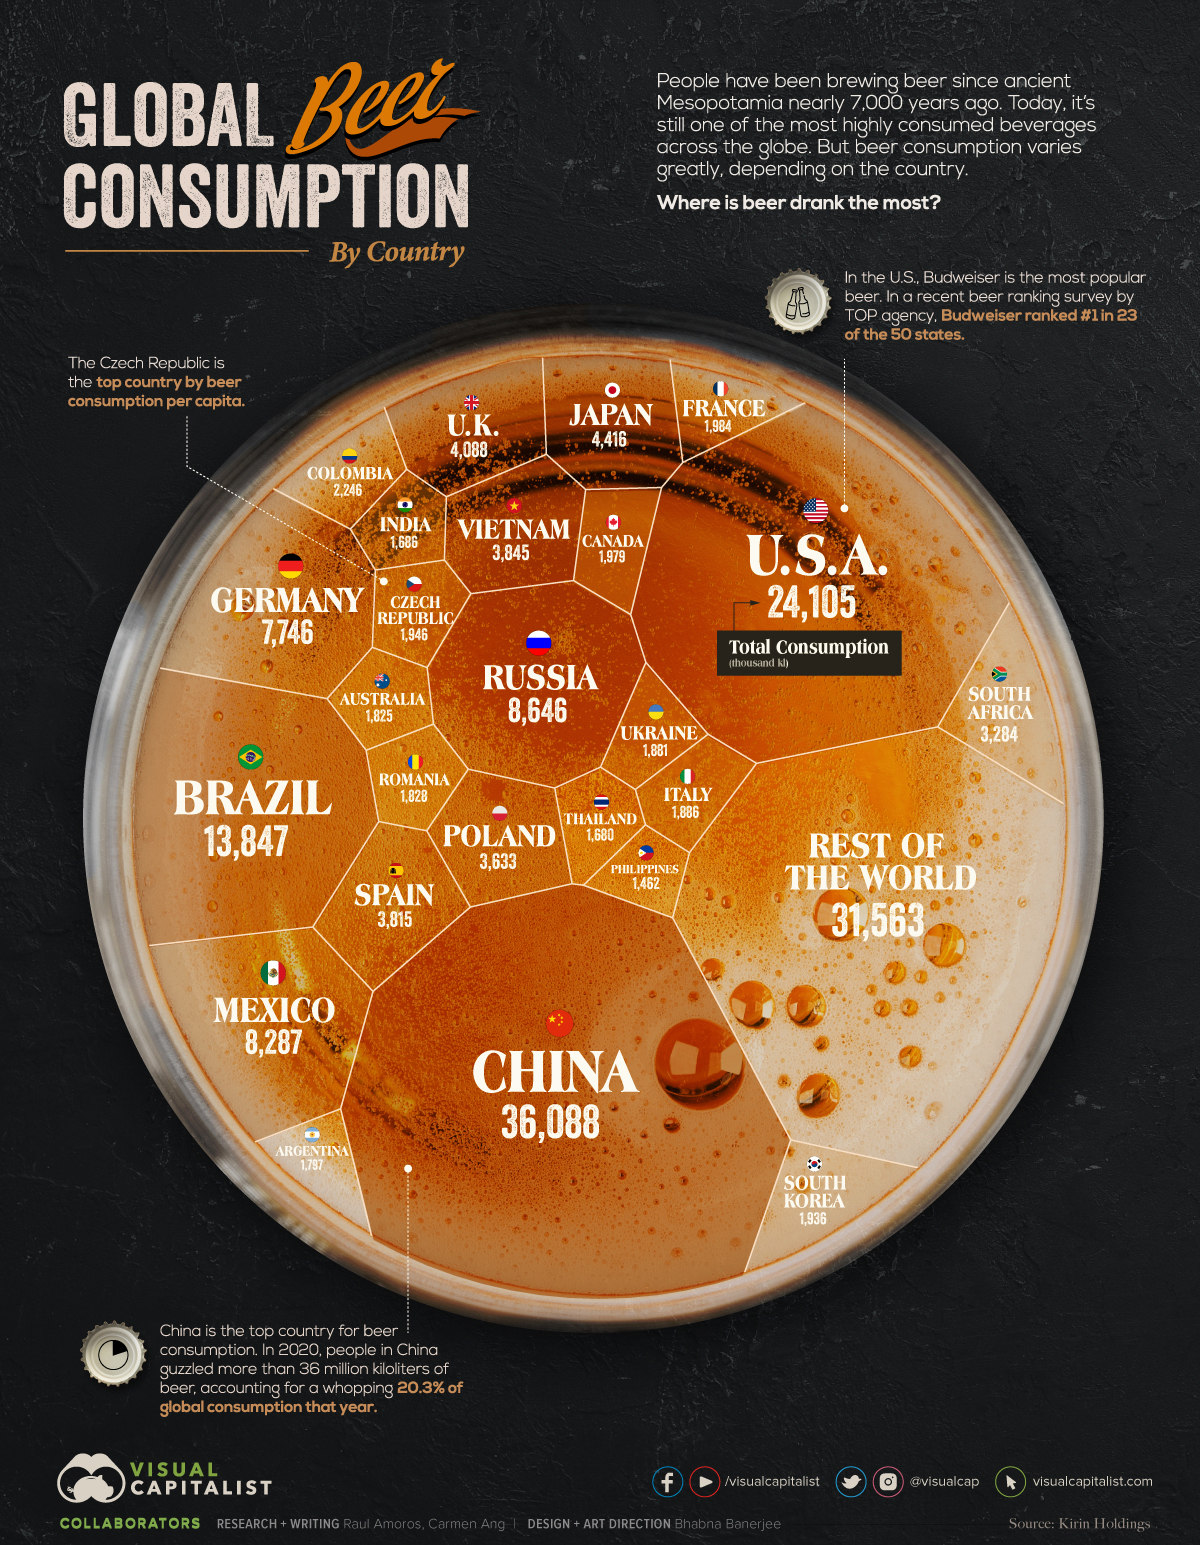
Humans have been drinking beer for thousands of years—and since it’s still one of the most popular beverages worldwide, it seems we haven’t gotten sick of it yet. The latest available data shows that beer consumption exceeded 177 million kiloliters around the world in 2020.
Beer consumption occurs all over the world, but the amount varies greatly depending on the location. So, which countries drink the most beer?
This graphic uses data from Kirin Holdings to compare global beer consumption by country. Kirin is a Japanese company that has been tracking beer consumption around the world since 1975.
Which Countries Drink the Most Beer?
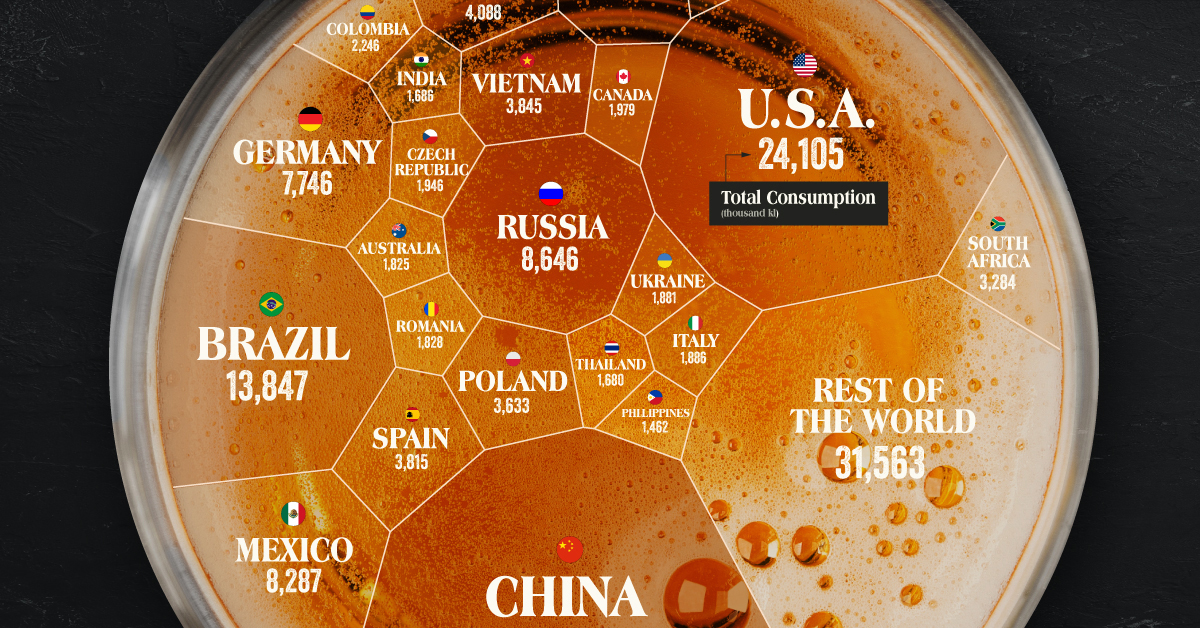
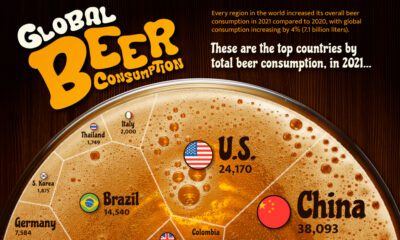
When it comes to total beer consumption, China ranks number one.
In 2020, the country’s consumption reached 36 million kiloliters—that’s enough beer to fill more than 14,000 Olympic-sized pools. The country accounts for a whopping one-fifth of total beer consumption worldwide. Archaeological evidence also suggests that China has a beer producing history that goes back thousands of years.
Here’s a look at the top 25 countries for beer consumption, and their global market share:
| Ranking 2020 | Country | Total Consumption (thousand kl) | Global Market Share |
|---|---|---|---|
| 1 | 🇨🇳 China | 36,088 | 20.30% |
| 2 | 🇺🇸 United States of America | 24,105 | 13.60% |
| 3 | 🇧🇷 Brazil | 13,847 | 7.80% |
| 4 | 🇷🇺 Russia | 8,646 | 4.90% |
| 5 | 🇲🇽 Mexico | 8,287 | 4.70% |
| 6 | 🇩🇪 Germany | 7,746 | 4.40% |
| 7 | 🇯🇵 Japan | 4,416 | 2.50% |
| 8 | 🇬🇧 United Kingdom | 4,088 | 2.30% |
| 9 | 🇻🇳 Vietnam | 3,845 | 2.20% |
| 10 | 🇪🇸 Spain | 3,815 | 2.10% |
| 11 | 🇵🇱 Poland | 3,633 | 2.00% |
| 12 | 🇿🇦 South Africa | 3,284 | 1.90% |
| 13 | 🇨🇴 Colombia | 2,246 | 1.30% |
| 14 | 🇫🇷 France | 1,984 | 1.10% |
| 15 | 🇨🇦 Canada | 1,979 | 1.10% |
| 16 | 🇨🇿 Czech Republic | 1,946 | 1.10% |
| 17 | 🇰🇷 South Korea | 1,936 | 1.10% |
| 18 | 🇮🇹 Italy | 1,886 | 1.10% |
| 19 | 🇺🇦 Ukraine | 1,881 | 1.10% |
| 20 | 🇷🇴 Romania | 1,828 | 1.00% |
| 21 | 🇦🇺 Australia | 1,825 | 1.00% |
| 22 | 🇦🇷 Argentina | 1,797 | 1.00% |
| 23 | 🇮🇳 India | 1,686 | 0.90% |
| 24 | 🇹🇭 Thailand | 1,680 | 0.90% |
| 25 | 🇵🇭 Philippines | 1,462 | 0.80% |
| Rest of the World | 31,563 | 17.78% |
China is the most populous country in the world, accounting for about 18% of the global population. Of course, a large population doesn’t necessarily translate to high beer consumption at the individual level. For instance, India, which has the second highest population in the world, ranks 23rd on the list for beer consumption, and only accounts for 1% of what foamy liquid gets guzzled down each year.
The U.S. comes second on the list, with more than 24 million kiloliters of beer consumed throughout the country in 2020. Americans don’t just drink a lot of beer—they brew a lot of beer, too. The U.S. is the second-largest beer producer worldwide (after China).
Beer Consumption Per Capita
Things look a bit different when you look at beer consumption per capita, rather than total beer consumption. The Czech Republic comes in first when it comes to beer consumption per capita.
In 2020, the average Czech drank more than 181 liters of beer.
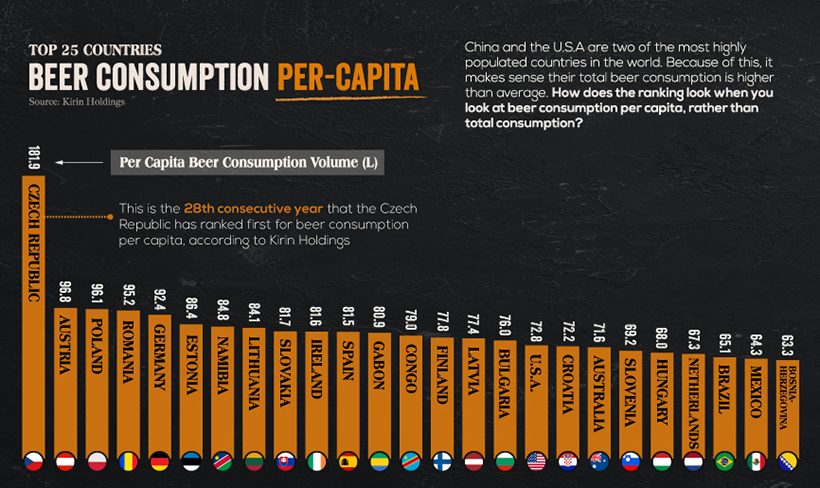
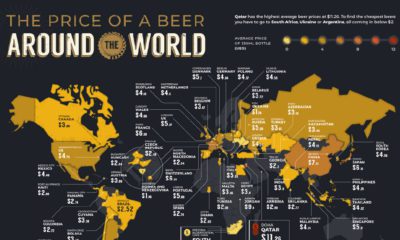
The Czech Republic is well-known for inexpensive beer. Some travel sites even claim that, in certain parts of the country, beer can be cheaper than bottled water.
International Beer Day
While consumption levels vary across the world, beer is an integral part of many countries’ cultures. In fact, the beverage is so popular, that it’s been given its own day. International Beer Day is celebrated on the first Friday of every August in over 200 cities across the globe.
Cheers, and happy sipping!


VC+
VC+: Get Our Key Takeaways From the IMF’s World Economic Outlook
A sneak preview of the exclusive VC+ Special Dispatch—your shortcut to understanding IMF’s World Economic Outlook report.

Have you read IMF’s latest World Economic Outlook yet? At a daunting 202 pages, we don’t blame you if it’s still on your to-do list.
But don’t worry, you don’t need to read the whole April release, because we’ve already done the hard work for you.
To save you time and effort, the Visual Capitalist team has compiled a visual analysis of everything you need to know from the report—and our VC+ Special Dispatch is available exclusively to VC+ members. All you need to do is log into the VC+ Archive.
If you’re not already subscribed to VC+, make sure you sign up now to access the full analysis of the IMF report, and more (we release similar deep dives every week).
For now, here’s what VC+ members get to see.
Your Shortcut to Understanding IMF’s World Economic Outlook
With long and short-term growth prospects declining for many countries around the world, this Special Dispatch offers a visual analysis of the key figures and takeaways from the IMF’s report including:
- The global decline in economic growth forecasts
- Real GDP growth and inflation forecasts for major nations in 2024
- When interest rate cuts will happen and interest rate forecasts
- How debt-to-GDP ratios have changed since 2000
- And much more!

Get the Full Breakdown in the Next VC+ Special Dispatch
VC+ members can access the full Special Dispatch by logging into the VC+ Archive, where you can also check out previous releases.
Make sure you join VC+ now to see exclusive charts and the full analysis of key takeaways from IMF’s World Economic Outlook.
Don’t miss out. Become a VC+ member today.
What You Get When You Become a VC+ Member
VC+ is Visual Capitalist’s premium subscription. As a member, you’ll get the following:
- Special Dispatches: Deep dive visual briefings on crucial reports and global trends
- Markets This Month: A snappy summary of the state of the markets and what to look out for
- The Trendline: Weekly curation of the best visualizations from across the globe
- Global Forecast Series: Our flagship annual report that covers everything you need to know related to the economy, markets, geopolitics, and the latest tech trends
- VC+ Archive: Hundreds of previously released VC+ briefings and reports that you’ve been missing out on, all in one dedicated hub
You can get all of the above, and more, by joining VC+ today.

-

 Mining1 week ago
Gold vs. S&P 500: Which Has Grown More Over Five Years?
-

 Markets2 weeks ago
Ranked: The Most Valuable Housing Markets in America
-

 Money2 weeks ago
Which States Have the Highest Minimum Wage in America?
-

 AI2 weeks ago
Ranked: Semiconductor Companies by Industry Revenue Share
-

 Markets2 weeks ago
Ranked: The World’s Top Flight Routes, by Revenue
-

 Countries2 weeks ago
Population Projections: The World’s 6 Largest Countries in 2075
-

 Markets2 weeks ago
The Top 10 States by Real GDP Growth in 2023
-

 Demographics2 weeks ago
The Smallest Gender Wage Gaps in OECD Countries