Misc
Brand Loyalty is Declining for Most Luxury Automakers


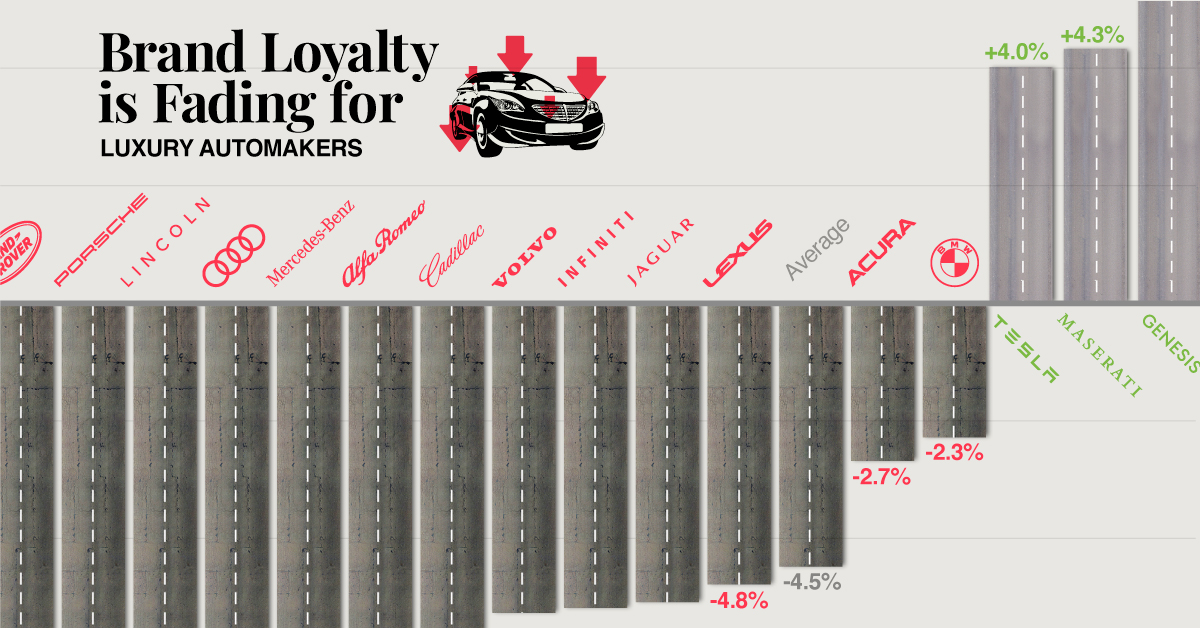
Brand Loyalty is Declining for Most Luxury Automakers
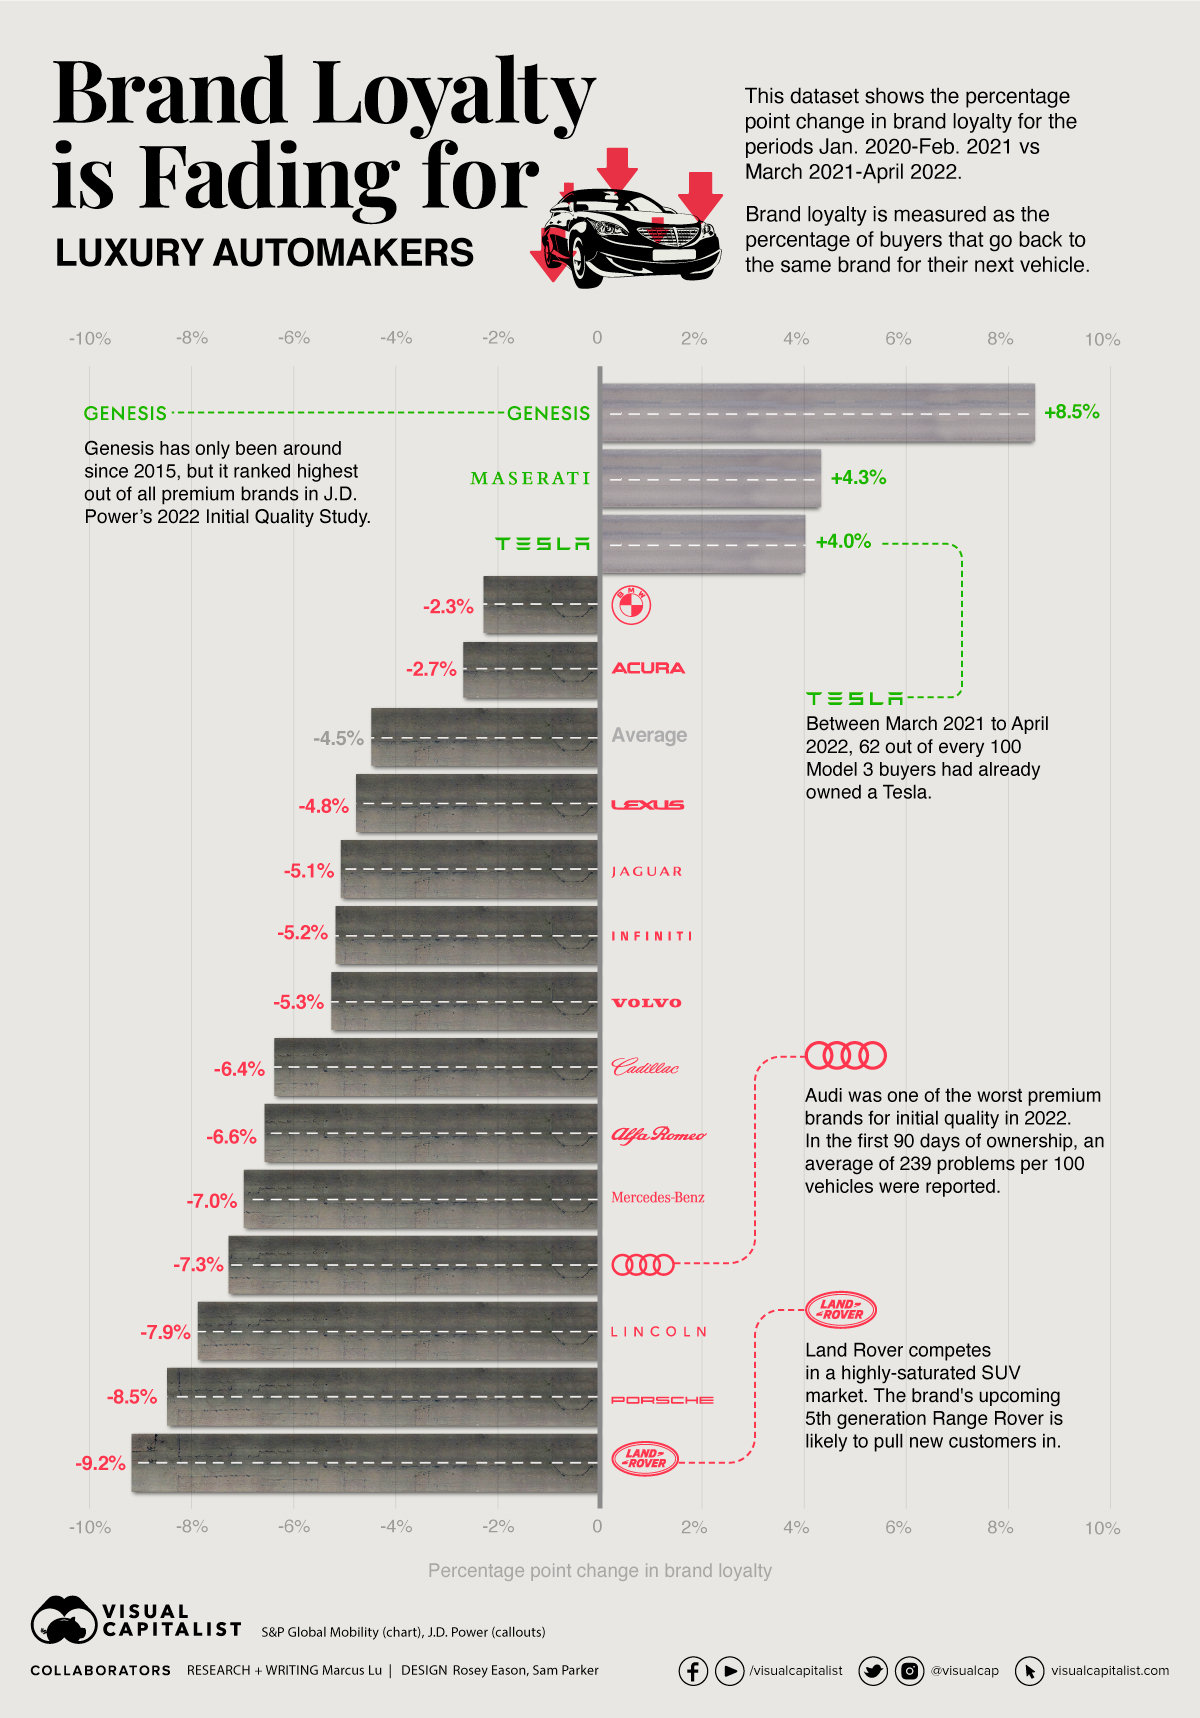
New research conducted by S&P Global Mobility has found that brand loyalty—measured as the percentage of buyers that go back to the same brand for their next vehicle—is falling across the luxury segment.
In this infographic, we’ve visualized the results of this research, which spans from January 2020 to April 2022.
Brand Loyalty Losers
The following brands have all experienced a drop in brand loyalty over the time period.
For additional context, we’ve also included each brand’s score in the J.D. Power 2022 Initial Quality Study. This is measured based on the number of problems experienced per 100 vehicles (PP100) in the first 90 days of ownership.
| Brand | Percentage Point Change in Brand Loyalty | PP100 |
|---|---|---|
| 🇬🇧 Land Rover | -9.2 | 193 |
| 🇩🇪 Porsche | -8.5 | 200 |
| 🇺🇸 Lincoln | -7.9 | 167 |
| 🇩🇪 Audi | -7.3 | 239 |
| 🇩🇪 Mercedes-Benz | -7.0 | 189 |
| 🇮🇹 Alfa Romeo | -6.6 | 211 |
| 🇺🇸 Cadillac | -6.4 | 163 |
| 🇸🇪 Volvo | -5.3 | 256 |
| 🇯🇵 Infiniti | -5.2 | 204 |
| 🇬🇧 Jaguar | -5.1 | 210 |
| 🇯🇵 Lexus | -4.8 | 157 |
| Luxury average | -4.5 | 199 |
| 🇯🇵 Acura | -2.7 | 192 |
| 🇩🇪 BMW | -2.3 | 165 |
Land Rover experienced the biggest drop in loyalty, despite a better than average PP100 rating. One potential reason is timing—the brand’s premier model, the Range Rover, has been in its fourth generation since 2012. The SUV has become relatively dated, though a new fifth generation was recently revealed for the 2022 model year.
Two Volkswagen Group brands, Audi and Porsche, also fared poorly in terms of loyalty. This is somewhat surprising, as both brands offer a portfolio of both gasoline and electric models. Many competitors, such as Acura, Lexus, and Maserati, have yet to release an EV.
Brand Loyalty Winners
Three brands have managed to buck the trend, as shown below.
| Brand | Percentage Point Change in Brand Loyalty | PP100 |
|---|---|---|
| Luxury average | -4.5 | 199 |
| 🇺🇸 Tesla | +4.0 | 226 |
| 🇮🇹 Maserati | +4.3 | 255 |
| 🇰🇷 Genesis | +8.5 | 156 |
We can draw parallels between Tesla and Apple, in that both have incredibly loyal followers.
For instance, between March 2021 to April 2022, 62% of buyers/households who returned to market and previously owned a Model 3 purchased a new Tesla. That’s an impressive statistic, especially when we consider Tesla’s history of build quality issues.
Maserati appears to be in the same boat. The Italian automaker has strengthened its brand loyalty by 4.3 percentage points, despite having the luxury segment’s worst PP100. Perhaps build quality matters less than we think.
Another Factor to Consider
Ongoing supply chain issues could also be contributing to wide-spread declines in loyalty. Rather than waiting several months (or in the case of EVs, years), buyers may switch to a different brand that has cars in stock.
We are still monitoring it week to week, but up to now basically worldwide, we had no issues running production.
– Joerg Burzer, Mercedes-Benz
Many automakers have reported that their supply issues are diminishing, though new economic challenges have risen. For example, surging inflation has pushed the price of a new car to record highs. Combined with rising interest rates (cost of borrowing), this could negatively impact the demand for new cars.


VC+
VC+: Get Our Key Takeaways From the IMF’s World Economic Outlook
A sneak preview of the exclusive VC+ Special Dispatch—your shortcut to understanding IMF’s World Economic Outlook report.

Have you read IMF’s latest World Economic Outlook yet? At a daunting 202 pages, we don’t blame you if it’s still on your to-do list.
But don’t worry, you don’t need to read the whole April release, because we’ve already done the hard work for you.
To save you time and effort, the Visual Capitalist team has compiled a visual analysis of everything you need to know from the report—and our VC+ Special Dispatch is available exclusively to VC+ members. All you need to do is log into the VC+ Archive.
If you’re not already subscribed to VC+, make sure you sign up now to access the full analysis of the IMF report, and more (we release similar deep dives every week).
For now, here’s what VC+ members get to see.
Your Shortcut to Understanding IMF’s World Economic Outlook
With long and short-term growth prospects declining for many countries around the world, this Special Dispatch offers a visual analysis of the key figures and takeaways from the IMF’s report including:
- The global decline in economic growth forecasts
- Real GDP growth and inflation forecasts for major nations in 2024
- When interest rate cuts will happen and interest rate forecasts
- How debt-to-GDP ratios have changed since 2000
- And much more!

Get the Full Breakdown in the Next VC+ Special Dispatch
VC+ members can access the full Special Dispatch by logging into the VC+ Archive, where you can also check out previous releases.
Make sure you join VC+ now to see exclusive charts and the full analysis of key takeaways from IMF’s World Economic Outlook.
Don’t miss out. Become a VC+ member today.
What You Get When You Become a VC+ Member
VC+ is Visual Capitalist’s premium subscription. As a member, you’ll get the following:
- Special Dispatches: Deep dive visual briefings on crucial reports and global trends
- Markets This Month: A snappy summary of the state of the markets and what to look out for
- The Trendline: Weekly curation of the best visualizations from across the globe
- Global Forecast Series: Our flagship annual report that covers everything you need to know related to the economy, markets, geopolitics, and the latest tech trends
- VC+ Archive: Hundreds of previously released VC+ briefings and reports that you’ve been missing out on, all in one dedicated hub
You can get all of the above, and more, by joining VC+ today.

-

 Education1 week ago
How Hard Is It to Get Into an Ivy League School?
-

 Technology2 weeks ago
Ranked: Semiconductor Companies by Industry Revenue Share
-

 Markets2 weeks ago
Ranked: The World’s Top Flight Routes, by Revenue
-

 Demographics2 weeks ago
Population Projections: The World’s 6 Largest Countries in 2075
-

 Markets2 weeks ago
The Top 10 States by Real GDP Growth in 2023
-

 Demographics2 weeks ago
The Smallest Gender Wage Gaps in OECD Countries
-

 Economy2 weeks ago
Where U.S. Inflation Hit the Hardest in March 2024
-

 Green2 weeks ago
Top Countries By Forest Growth Since 2001