Misc
Sharpen Your Thinking with These 10 Powerful Cognitive Razors


Improve Your Decision-Making with These 10 Cognitive Razors
The average adult makes about 35,000 conscious decisions each day.
Given this sheer volume of choice, how do we ensure we’re making the right decisions, day in and day out, without becoming exhausted?
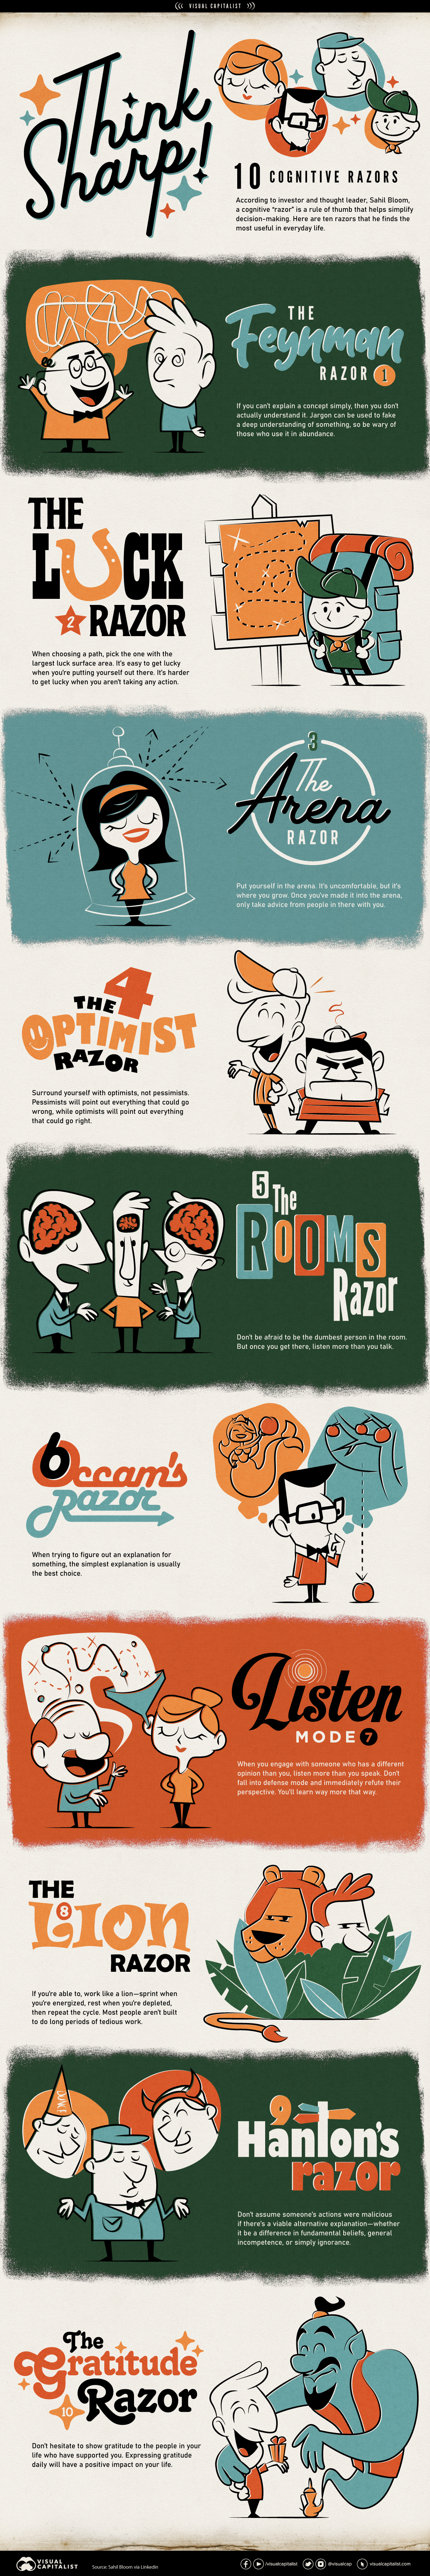
Using insights from investor and thought leader Sahil Bloom, this graphic shares 10 cognitive razors, or rules of thumb, that can help you simplify your decision-making.
We’ve organized Bloom’s favorite cognitive razors into three overarching categories, which we dive into in further detail below.
Location, Location, Location
The first theme is location, and the importance of being at the right place at the right time.
The Luck Razor falls into this category because it highlights the importance of putting yourself out there. According to the Luck Razor, when choosing between two paths, pick the one with the largest “luck surface area,” or the path that offers you the most opportunity to get lucky.
This is because when you’re networking, meeting people, and building new relationships, you’re much more likely to stumble upon an opportunity than if you were sitting on your couch, not taking action.
The Rooms Razor follows a similar theme because it emphasizes the importance of your surroundings. It stresses that, if you have a choice between two rooms to walk into, choose the one where you’re most likely to be the dumbest person in the room.
While it’s a bit of an uncomfortable situation, it provides a greater opportunity for growth, as long as you check your ego at the door and listen to what others have to say.
Lastly, the Arena Razor reminds us that when we want something, we need to take the necessary steps to make it happen.
For instance, if you want to become a social media influencer, you need to start creating content and posting it online. It’s not easy to put yourself out there and take action, but if you want to play the game, you need to be in the arena.
The Power of Positive Thinking
The next theme is the power of mindset and positive thinking. This relates to how you view your life, the people you choose to surround yourself with, and how you interpret the actions and opinions of others.
According to the Gratitude Razor, when in doubt, don’t hesitate to show your gratitude to people who have supported you, or given you advice or opportunities.
Research studies have shown that expressing gratitude and giving thanks can be correlated with greater happiness, improved health, and stronger more meaningful relationships. So make sure to say thank you regularly, and tell your loved ones how much you appreciate their support.
It’s not just your mindset that’s important, though. The Optimist Razor recommends surrounding yourself with optimists, rather than pessimists. Pessimists may point out everything that could go wrong in a scenario, which might discourage you to break out of your comfort zone.
Optimism, on the other hand, will emphasize everything that could go right—and may even help you problem solve if you encounter problems along the way.
Keep Decision-Making Simple, Silly
The last one is quite simple, really: don’t overcomplicate things.
Occam’s Razor, which is named after the 14th-century scholar Franciscan friar William of Ockham, is generally interpreted as the following: when faced with a decision between two competing theories that generate the same outcome, the simplest theory is often the best one.
As Bloom says in this blog post, “simple assumptions [over] complex assumptions. If you have to believe a complex, intertwined series of assumptions in order to reach one specific conclusion, always ask whether there is a simple alternative assumption that fits.”
The ability to make things simple is also a good indicator of how deeply you understand something. According to the Feynman Razor, if you can’t explain a concept simply, then you don’t really understand it. So, if someone uses a ton of jargon or complexity to explain something, they could be masking a lack of deeper knowledge on the topic.
Editor’s note: For more information on cognitive razors and simplifying your decision-making, check out Sahil Bloom’s newsletter, or listen to his podcast episode where he talks about the most powerful razors he’s discovered so far in life.

VC+
VC+: Get Our Key Takeaways From the IMF’s World Economic Outlook
A sneak preview of the exclusive VC+ Special Dispatch—your shortcut to understanding IMF’s World Economic Outlook report.

Have you read IMF’s latest World Economic Outlook yet? At a daunting 202 pages, we don’t blame you if it’s still on your to-do list.
But don’t worry, you don’t need to read the whole April release, because we’ve already done the hard work for you.
To save you time and effort, the Visual Capitalist team has compiled a visual analysis of everything you need to know from the report—and our VC+ Special Dispatch is available exclusively to VC+ members. All you need to do is log into the VC+ Archive.
If you’re not already subscribed to VC+, make sure you sign up now to access the full analysis of the IMF report, and more (we release similar deep dives every week).
For now, here’s what VC+ members get to see.
Your Shortcut to Understanding IMF’s World Economic Outlook
With long and short-term growth prospects declining for many countries around the world, this Special Dispatch offers a visual analysis of the key figures and takeaways from the IMF’s report including:
- The global decline in economic growth forecasts
- Real GDP growth and inflation forecasts for major nations in 2024
- When interest rate cuts will happen and interest rate forecasts
- How debt-to-GDP ratios have changed since 2000
- And much more!

Get the Full Breakdown in the Next VC+ Special Dispatch
VC+ members can access the full Special Dispatch by logging into the VC+ Archive, where you can also check out previous releases.
Make sure you join VC+ now to see exclusive charts and the full analysis of key takeaways from IMF’s World Economic Outlook.
Don’t miss out. Become a VC+ member today.
What You Get When You Become a VC+ Member
VC+ is Visual Capitalist’s premium subscription. As a member, you’ll get the following:
- Special Dispatches: Deep dive visual briefings on crucial reports and global trends
- Markets This Month: A snappy summary of the state of the markets and what to look out for
- The Trendline: Weekly curation of the best visualizations from across the globe
- Global Forecast Series: Our flagship annual report that covers everything you need to know related to the economy, markets, geopolitics, and the latest tech trends
- VC+ Archive: Hundreds of previously released VC+ briefings and reports that you’ve been missing out on, all in one dedicated hub
You can get all of the above, and more, by joining VC+ today.

-

 Education1 week ago
How Hard Is It to Get Into an Ivy League School?
-

 Technology2 weeks ago
Ranked: Semiconductor Companies by Industry Revenue Share
-

 Markets2 weeks ago
Ranked: The World’s Top Flight Routes, by Revenue
-

 Demographics2 weeks ago
Population Projections: The World’s 6 Largest Countries in 2075
-

 Markets2 weeks ago
The Top 10 States by Real GDP Growth in 2023
-

 Demographics2 weeks ago
The Smallest Gender Wage Gaps in OECD Countries
-

 Economy2 weeks ago
Where U.S. Inflation Hit the Hardest in March 2024
-

 Green2 weeks ago
Top Countries By Forest Growth Since 2001