Mining
Ranked: The World’s Largest Copper Producers
![]() Subscribe to the Elements free mailing list for more like this
Subscribe to the Elements free mailing list for more like this
Visualizing the World’s Largest Copper Producers
This was originally posted on Elements. Sign up to the free mailing list to get beautiful visualizations on natural resource megatrends in your email every week.
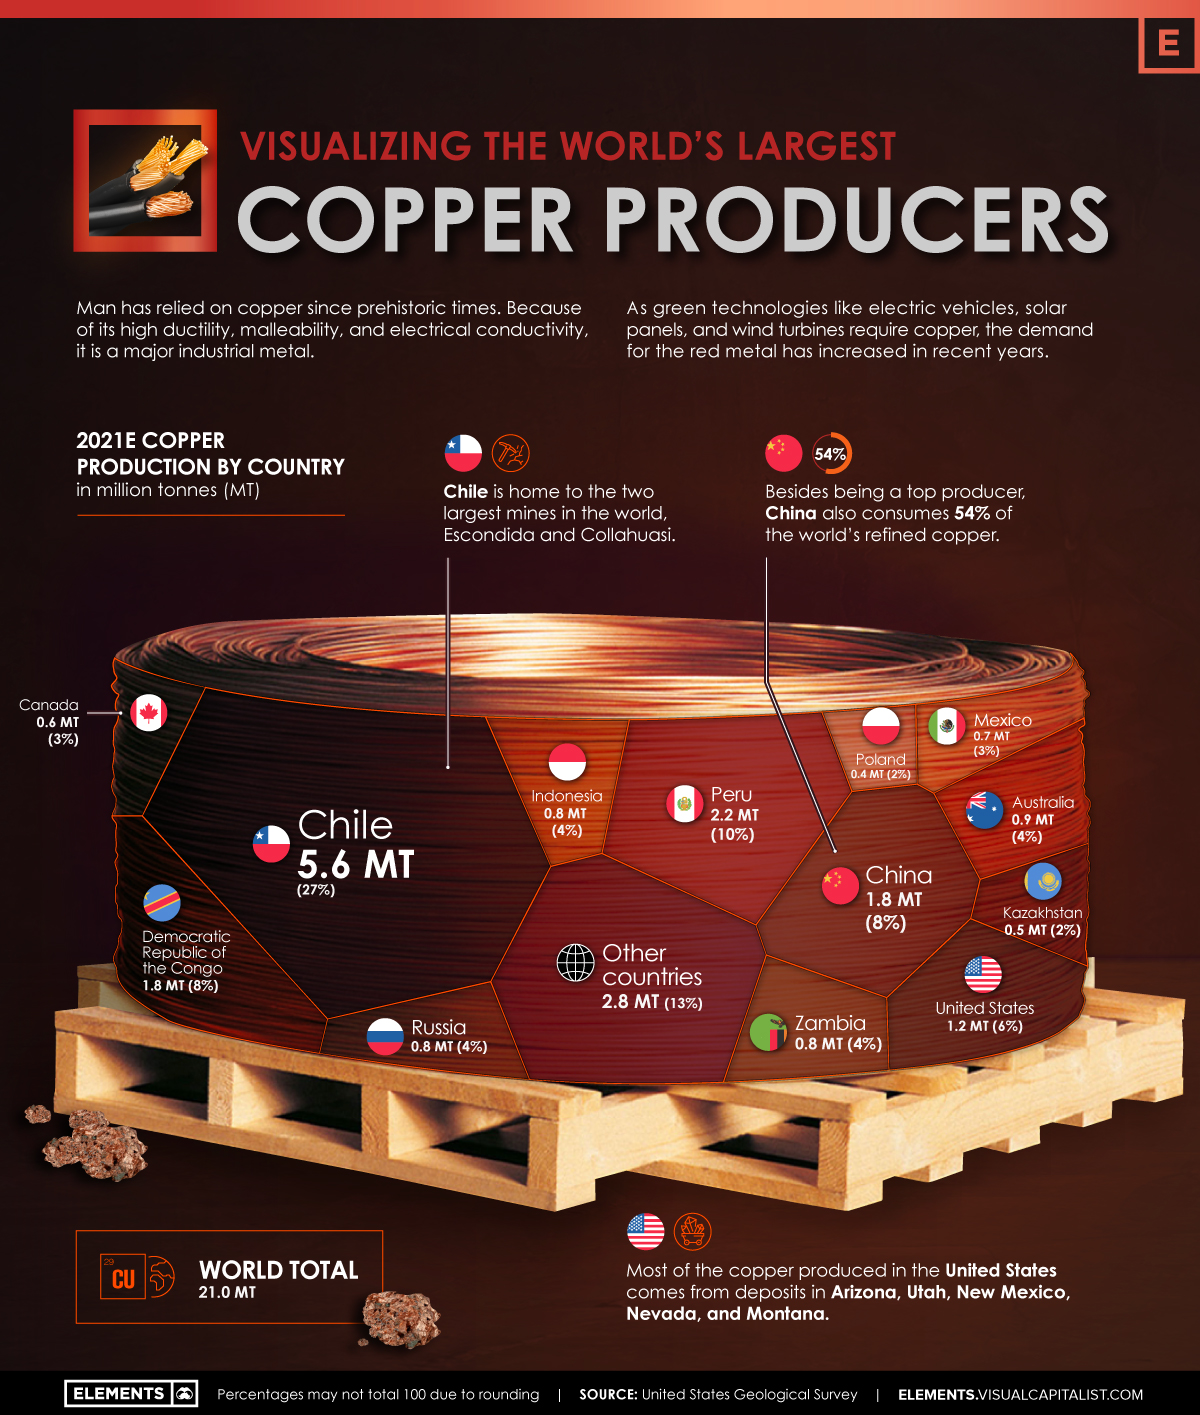
Man has relied on copper since prehistoric times. It is a major industrial metal with many applications due to its high ductility, malleability, and electrical conductivity.
Many new technologies critical to fighting climate change, like solar panels and wind turbines, rely on the red metal.
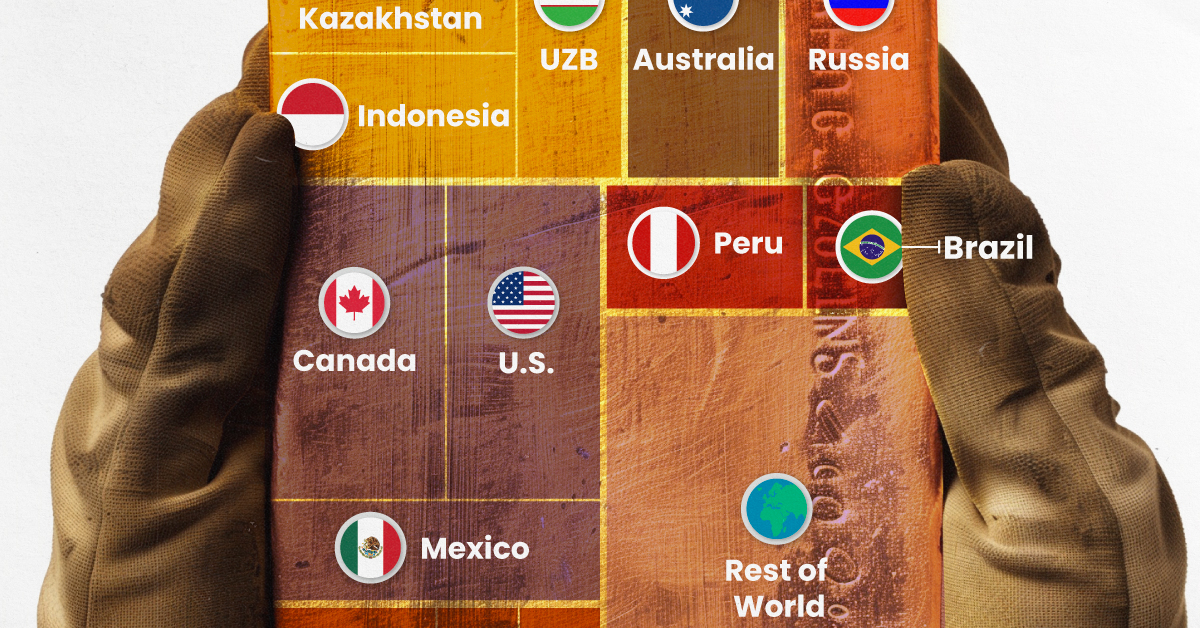
But where does the copper we use come from? Using the U.S. Geological Survey’s data, the above infographic lists the world’s largest copper producing countries in 2021.
The Countries Producing the World’s Copper
Many everyday products depend on minerals, including mobile phones, laptops, homes, and automobiles. Incredibly, every American requires 12 pounds of copper each year to maintain their standard of living.
North, South, and Central America dominate copper production, as these regions collectively host 15 of the 20 largest copper mines.
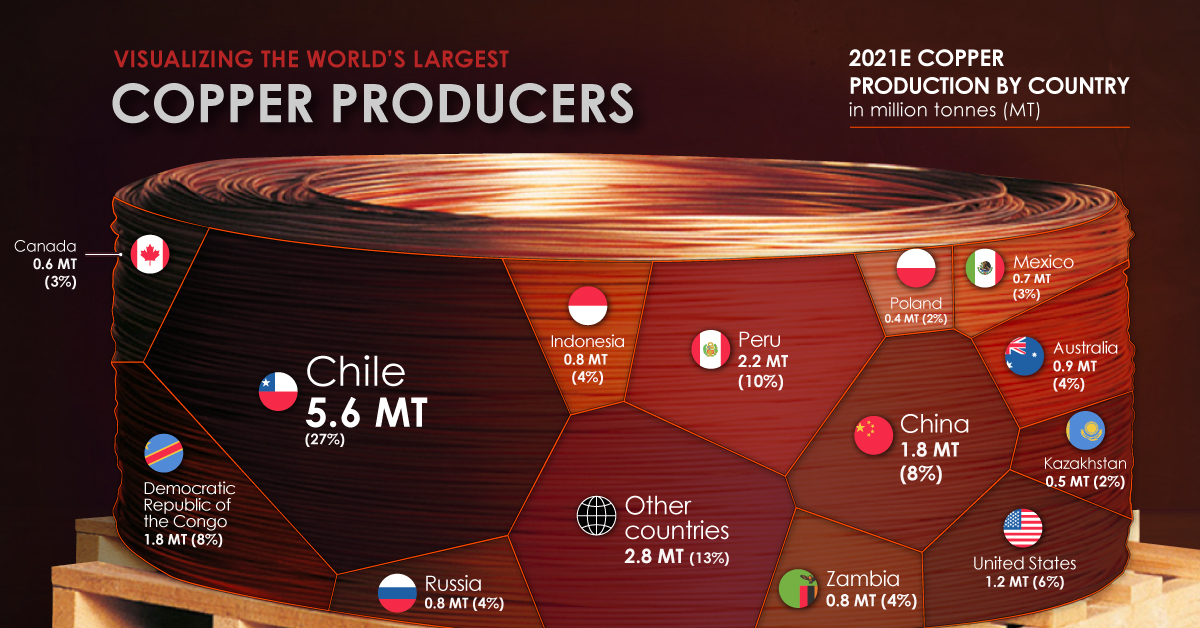
Chile is the top copper producer in the world, with 27% of global copper production. In addition, the country is home to the two largest mines in the world, Escondida and Collahuasi.
Chile is followed by another South American country, Peru, responsible for 10% of global production.
| Rank | Country | 2021E Copper Production (Million tonnes) | Share |
|---|---|---|---|
| #1 | 🇨🇱 Chile | 5.6 | 27% |
| #2 | 🇵🇪 Peru | 2.2 | 10% |
| #3 | 🇨🇳 China | 1.8 | 8% |
| #4 | 🇨🇩 DRC | 1.8 | 8% |
| #5 | 🇺🇸 United States | 1.2 | 6% |
| #6 | 🇦🇺 Australia | 0.9 | 4% |
| #7 | 🇷🇺 Russia | 0.8 | 4% |
| #8 | 🇿🇲 Zambia | 0.8 | 4% |
| #9 | 🇮🇩 Indonesia | 0.8 | 4% |
| #10 | 🇲🇽 Mexico | 0.7 | 3% |
| #11 | 🇨🇦 Canada | 0.6 | 3% |
| #12 | 🇰🇿 Kazakhstan | 0.5 | 2% |
| #13 | 🇵🇱 Poland | 0.4 | 2% |
| 🌍 Other countries | 2.8 | 13% | |
| 🌐 World total | 21.0 | 100% |
The Democratic Republic of Congo (DRC) and China share third place, with 8% of global production each. Along with being a top producer, China also consumes 54% of the world’s refined copper.
Copper’s Role in the Green Economy
Technologies critical to the energy transition, such as EVs, batteries, solar panels, and wind turbines require much more copper than conventional fossil fuel based counterparts.
For example, copper usage in EVs is up to four times more than in conventional cars. According to the Copper Alliance, renewable energy systems can require up to 12x more copper compared to traditional energy systems.
| Technology | 2020 Installed Capacity (megawatts) | Copper Content (2020, tonnes) | 2050p Installed Capacity (megawatts) | Copper Content (2050p, tonnes) |
|---|---|---|---|---|
| Solar PV | 126,735 MW | 633,675 | 372,000 MW | 1,860,000 |
| Onshore Wind | 105,015 MW | 451,565 | 202,000 MW | 868,600 |
| Offshore Wind | 6,013 MW | 57,725 | 45,000 MW | 432,000 |
With these technologies’ rapid and large-scale deployment, copper demand from the energy transition is expected to increase by nearly 600% by 2030.
As the transition to renewable energy and electrification speeds up, so will the pressure for more copper mines to come online.


Mining
Visualizing Global Gold Production in 2023
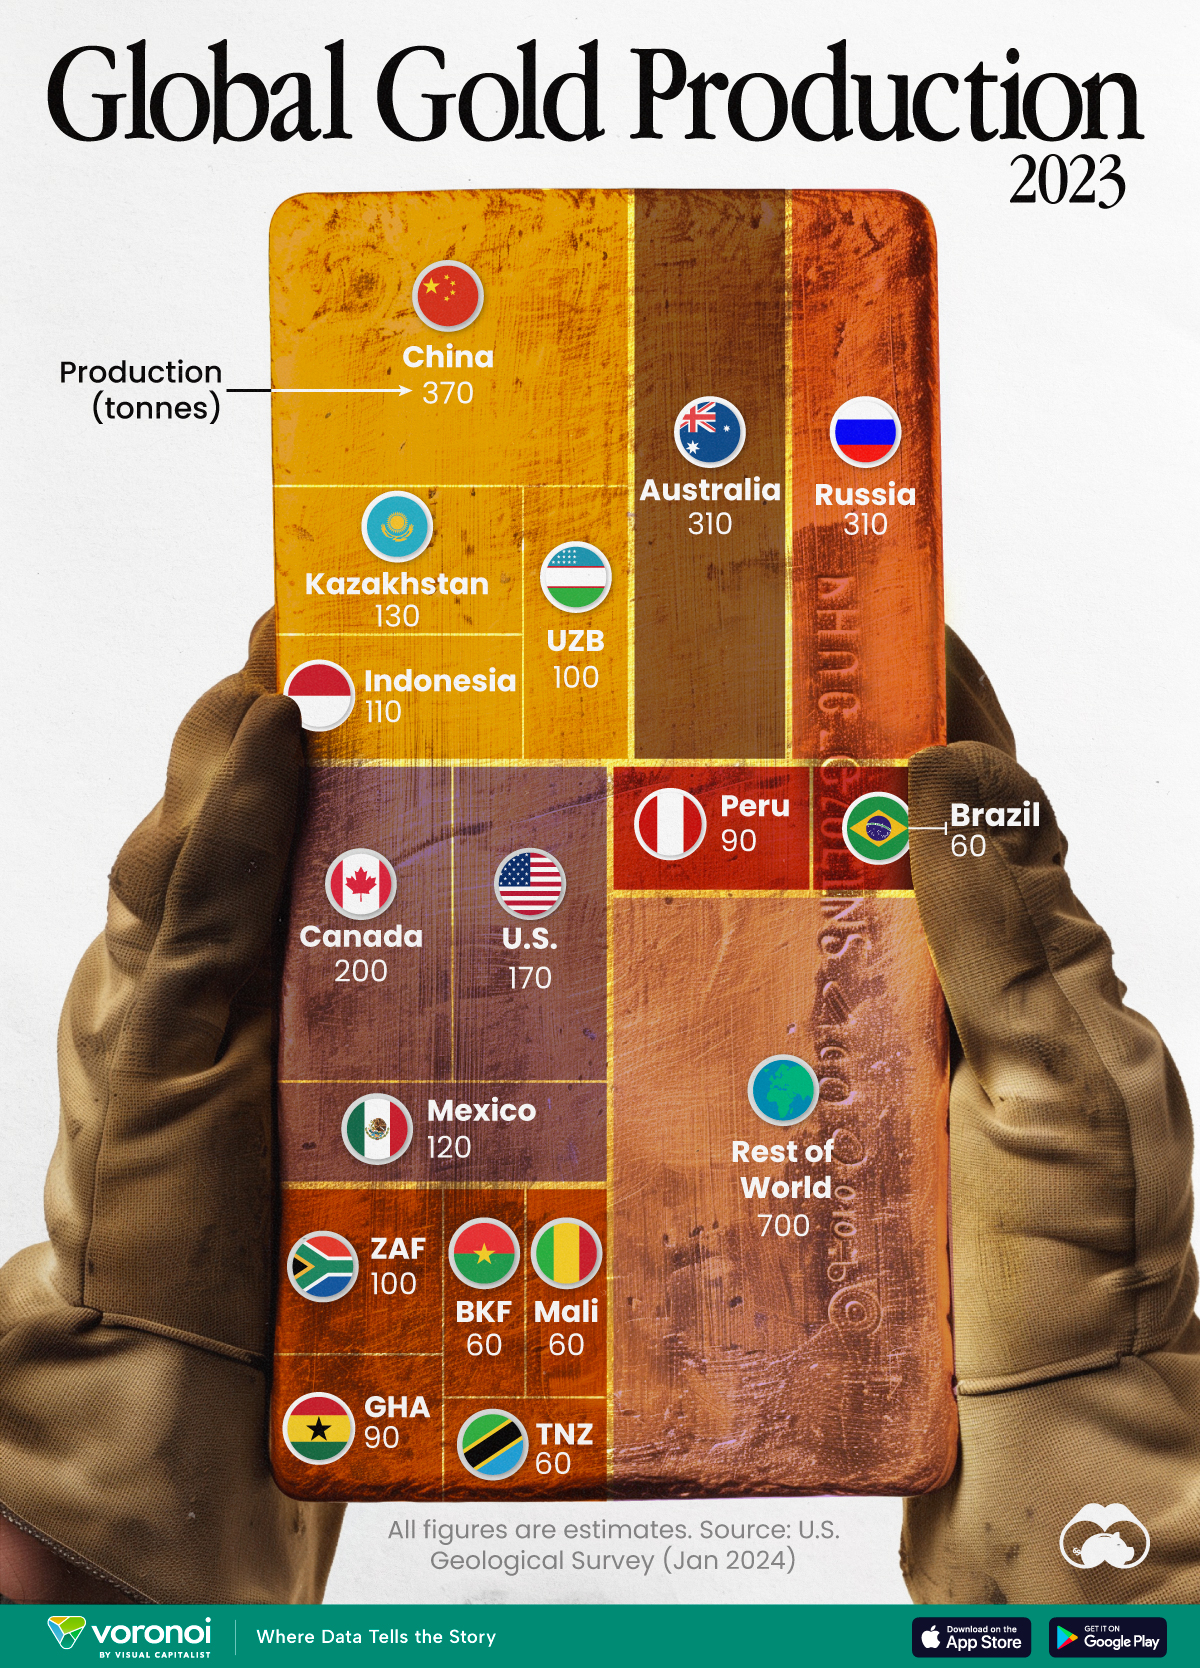
Gold production in 2023 was led by China, Australia, and Russia, with each outputting over 300 tonnes.
Visualizing Global Gold Production in 2023
This was originally posted on our Voronoi app. Download the app for free on iOS or Android and discover incredible data-driven charts from a variety of trusted sources.
Over 3,000 tonnes of gold were produced globally in 2023.
In this graphic, we list the world’s leading countries in terms of gold production. These figures come from the latest USGS publication on gold statistics (published January 2024).
China, Australia, and Russia Produced the Most Gold in 2023
China was the top producer in 2023, responsible for over 12% of total global production, followed by Australia and Russia.
| Country | Region | 2023E Production (tonnes) |
|---|---|---|
| 🇨🇳 China | Asia | 370 |
| 🇦🇺 Australia | Oceania | 310 |
| 🇷🇺 Russia | Europe | 310 |
| 🇨🇦 Canada | North America | 200 |
| 🇺🇸 United States | North America | 170 |
| 🇰🇿 Kazakhstan | Asia | 130 |
| 🇲🇽 Mexico | North America | 120 |
| 🇮🇩 Indonesia | Asia | 110 |
| 🇿🇦 South Africa | Africa | 100 |
| 🇺🇿 Uzbekistan | Asia | 100 |
| 🇬🇭 Ghana | Africa | 90 |
| 🇵🇪 Peru | South America | 90 |
| 🇧🇷 Brazil | South America | 60 |
| 🇧🇫 Burkina Faso | Africa | 60 |
| 🇲🇱 Mali | Africa | 60 |
| 🇹🇿 Tanzania | Africa | 60 |
| 🌍 Rest of World | - | 700 |
Gold mines in China are primarily concentrated in eastern provinces such as Shandong, Henan, Fujian, and Liaoning. As of January 2024, China’s gold mine reserves stand at an estimated 3,000 tonnes, representing around 5% of the global total of 59,000 tonnes.
In addition to being the top producer, China emerged as the largest buyer of the yellow metal for the year. In fact, the country’s central bank alone bought 225 tonnes of gold in 2023, according the World Gold Council.
Estimated Global Gold Consumption
Most of the gold produced in 2023 was used in jewelry production, while another significant portion was sold as a store of value, such as in gold bars or coins.
- Jewelry: 46%
- Central Banks and Institutions: 23%
- Physical Bars: 16%
- Official Coins, Medals, and Imitation Coins: 9%
- Electrical and Electronics: 5%
- Other: 1%
According to Fitch Solutions, over the medium term (2023-2032), global gold mine production is expected to grow 15%, as high prices encourage investment and output.

-

 Technology6 days ago
All of the Grants Given by the U.S. CHIPS Act
-

 Uranium2 weeks ago
The World’s Biggest Nuclear Energy Producers
-

 Education2 weeks ago
How Hard Is It to Get Into an Ivy League School?
-

 Debt2 weeks ago
How Debt-to-GDP Ratios Have Changed Since 2000
-

 Sports2 weeks ago
The Highest Earning Athletes in Seven Professional Sports
-

 Science2 weeks ago
Visualizing the Average Lifespans of Mammals
-

 Brands1 week ago
How Tech Logos Have Evolved Over Time
-

 Energy1 week ago
Ranked: The Top 10 EV Battery Manufacturers in 2023