Energy
Visualizing the Race for Clean Energy
The Race for Clean Energy
To see the full resolution version of this infographic that has higher legibility, click here.
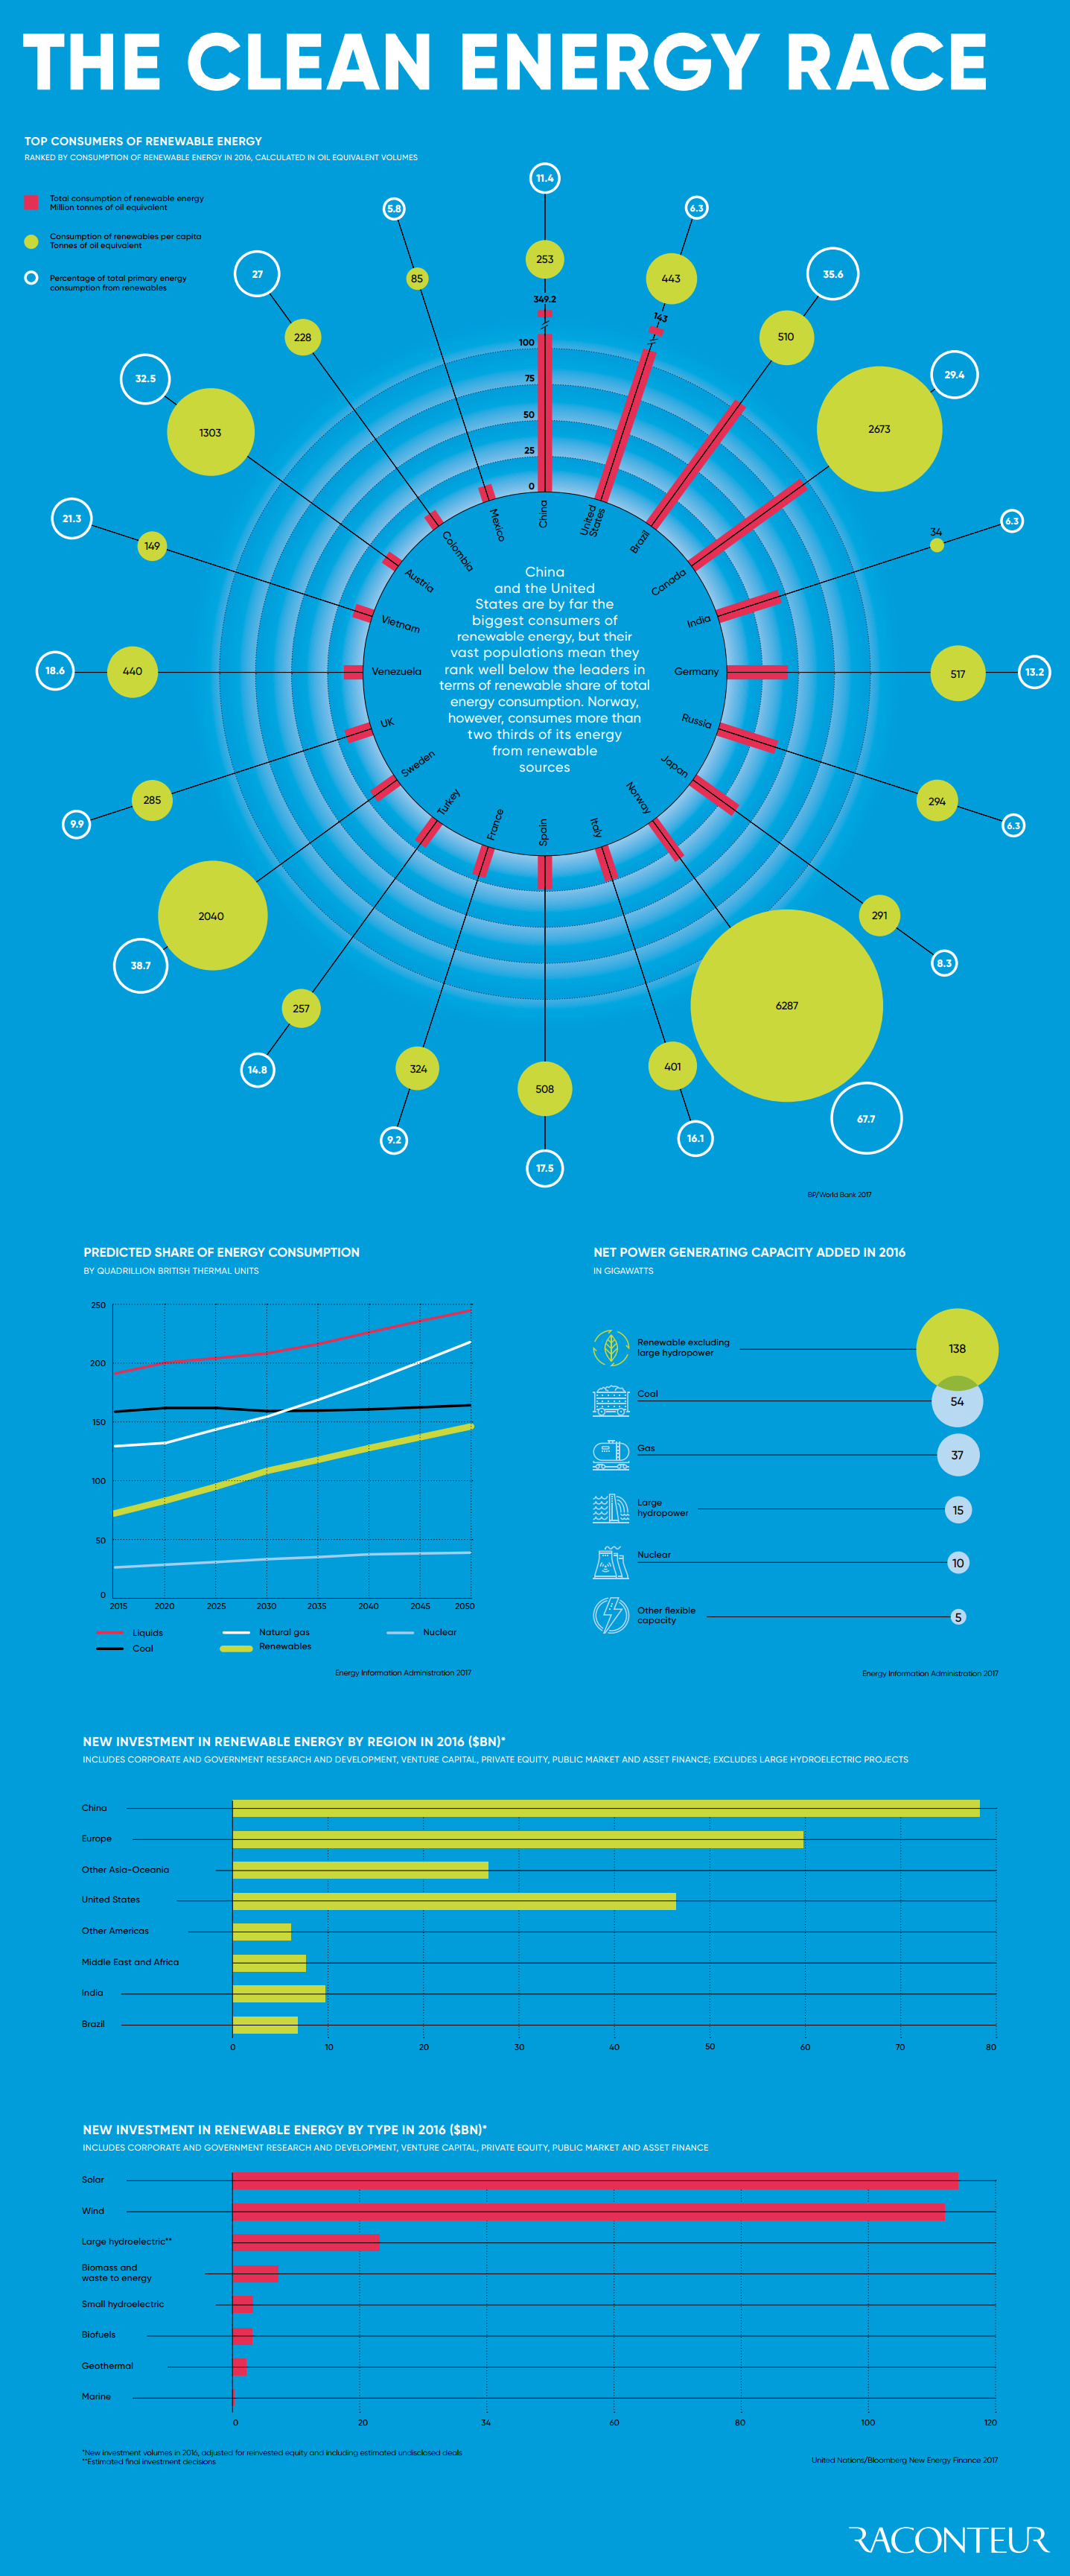
Last year, on a global basis, more net power generating capacity was added through renewable sources than via all other power sources combined.
Which countries are leading this charge, and what power sources are being adopted the fastest?
Today’s infographic comes to us Raconteur, and it breaks down various metrics around energy investment. The graphic looks at absolute and per capita power consumption by countries, as well as dollars being invested into each particular type of green energy.
Country Comparisons
The two countries that lead the pack in absolute terms are China and the United States. In 2016, China consumed the equivalent of 349.2 million tonnes of oil in renewable energy, while the U.S. was at 143 million tonnes.
However, these numbers are very skewed by the large populations of these countries. In percentage terms, China only gets 11.4% of its primary energy from renewables, while the U.S. gets 6.3% of its mix from sources like solar and wind.
On a per capita basis, major economies leading the world include countries like Norway, Canada, Sweden, Brazil, and Austria – all of these countries get about 30% or more of their primary energy from renewables. That said, it is also worth noting that hydropower makes up a large degree of the energy mixes for many of these places.
Clean Investments
2016 was a landmark year for clean energy, with net power capacity additions for renewables topping the list:
| Power Type | Net Global Capacity Added (2016) |
|---|---|
| Renewable (excl. large hydro) | 138 GW |
| Coal | 54 GW |
| Gas | 37 GW |
| Large hydro | 15 GW |
| Nuclear | 10 GW |
| Other flexible capacity | 5 GW |
Importantly, more green power is being added at lower costs. Below, you can see that the level of investment is actually falling, as utilities get more “bang for the buck” on new capacity added.
Here is the overall investment for each renewable category in 2016:
| Renewable source | Global New Investment (Billions) | Change |
|---|---|---|
| Solar | $113.7 | -34% |
| Wind | $112.5 | -9% |
| Large hydro | $23.2 | -48% |
| Biomass & waste-to-energy | $6.8 | 0% |
| Small hydro | $3.5 | 0% |
| Geothermal | $2.7 | -37% |
| Biofuels | $2.2 | 17% |
| Marine | $0.2 | -7% |
In 2016, investment in clean energy fell by 18% – however, 138 GW of new power capacity came online from renewable sources (excl. large hydro), which is 11 GW more than in the previous year.
If costs continue to fall, it will mean more accessible clean energy for any country that wants it – and cost efficiency will also make the race to add capacity via renewables much more meaningful and sustainable in the long term.


Energy
Charted: 4 Reasons Why Lithium Could Be the Next Gold Rush
Visual Capitalist has partnered with EnergyX to show why drops in prices and growing demand may make now the right time to invest in lithium.


4 Reasons Why You Should Invest in Lithium
Lithium’s importance in powering EVs makes it a linchpin of the clean energy transition and one of the world’s most precious minerals.
In this graphic, Visual Capitalist partnered with EnergyX to explore why now may be the time to invest in lithium.
1. Lithium Prices Have Dropped
One of the most critical aspects of evaluating an investment is ensuring that the asset’s value is higher than its price would indicate. Lithium is integral to powering EVs, and, prices have fallen fast over the last year:
| Date | LiOH·H₂O* | Li₂CO₃** |
|---|---|---|
| Feb 2023 | $76 | $71 |
| March 2023 | $71 | $61 |
| Apr 2023 | $43 | $33 |
| May 2023 | $43 | $33 |
| June 2023 | $47 | $45 |
| July 2023 | $44 | $40 |
| Aug 2023 | $35 | $35 |
| Sept 2023 | $28 | $27 |
| Oct 2023 | $24 | $23 |
| Nov 2023 | $21 | $21 |
| Dec 2023 | $17 | $16 |
| Jan 2024 | $14 | $15 |
| Feb 2024 | $13 | $14 |
Note: Monthly spot prices were taken as close to the 14th of each month as possible.
*Lithium hydroxide monohydrate MB-LI-0033
**Lithium carbonate MB-LI-0029
2. Lithium-Ion Battery Prices Are Also Falling
The drop in lithium prices is just one reason to invest in the metal. Increasing economies of scale, coupled with low commodity prices, have caused the cost of lithium-ion batteries to drop significantly as well.
In fact, BNEF reports that between 2013 and 2023, the price of a Li-ion battery dropped by 82%.
| Year | Price per KWh |
|---|---|
| 2023 | $139 |
| 2022 | $161 |
| 2021 | $150 |
| 2020 | $160 |
| 2019 | $183 |
| 2018 | $211 |
| 2017 | $258 |
| 2016 | $345 |
| 2015 | $448 |
| 2014 | $692 |
| 2013 | $780 |

3. EV Adoption is Sustainable
One of the best reasons to invest in lithium is that EVs, one of the main drivers behind the demand for lithium, have reached a price point similar to that of traditional vehicle.
According to the Kelly Blue Book, Tesla’s average transaction price dropped by 25% between 2022 and 2023, bringing it in line with many other major manufacturers and showing that EVs are a realistic transport option from a consumer price perspective.
| Manufacturer | September 2022 | September 2023 |
|---|---|---|
| BMW | $69,000 | $72,000 |
| Ford | $54,000 | $56,000 |
| Volkswagon | $54,000 | $56,000 |
| General Motors | $52,000 | $53,000 |
| Tesla | $68,000 | $51,000 |
4. Electricity Demand in Transport is Growing
As EVs become an accessible transport option, there’s an investment opportunity in lithium. But possibly the best reason to invest in lithium is that the IEA reports global demand for the electricity in transport could grow dramatically by 2030:
| Transport Type | 2022 | 2025 | 2030 |
|---|---|---|---|
| Buses 🚌 | 23,000 GWh | 50,000 GWh | 130,000 GWh |
| Cars 🚙 | 65,000 GWh | 200,000 GWh | 570,000 GWh |
| Trucks 🛻 | 4,000 GWh | 15,000 GWh | 94,000 GWh |
| Vans 🚐 | 6,000 GWh | 16,000 GWh | 72,000 GWh |
The Lithium Investment Opportunity
Lithium presents a potentially classic investment opportunity. Lithium and battery prices have dropped significantly, and recently, EVs have reached a price point similar to other vehicles. By 2030, the demand for clean energy, especially in transport, will grow dramatically.
With prices dropping and demand skyrocketing, now is the time to invest in lithium.
EnergyX is poised to exploit lithium demand with cutting-edge lithium extraction technology capable of extracting 300% more lithium than current processes.

-

 Lithium5 days ago
Ranked: The Top 10 EV Battery Manufacturers in 2023
Asia dominates this ranking of the world’s largest EV battery manufacturers in 2023.
-

 Energy1 week ago
The World’s Biggest Nuclear Energy Producers
China has grown its nuclear capacity over the last decade, now ranking second on the list of top nuclear energy producers.
-

 Energy1 month ago
The World’s Biggest Oil Producers in 2023
Just three countries accounted for 40% of global oil production last year.
-

 Energy1 month ago
How Much Does the U.S. Depend on Russian Uranium?
Currently, Russia is the largest foreign supplier of nuclear power fuel to the U.S.
-

 Uranium2 months ago
Charted: Global Uranium Reserves, by Country
We visualize the distribution of the world’s uranium reserves by country, with 3 countries accounting for more than half of total reserves.
-

 Energy3 months ago
Visualizing the Rise of the U.S. as Top Crude Oil Producer
Over the last decade, the United States has established itself as the world’s top producer of crude oil, surpassing Saudi Arabia and Russia.


-

 Science7 days ago
Visualizing the Average Lifespans of Mammals
-

 Markets2 weeks ago
The Top 10 States by Real GDP Growth in 2023
-

 Demographics2 weeks ago
The Smallest Gender Wage Gaps in OECD Countries
-

 United States2 weeks ago
Where U.S. Inflation Hit the Hardest in March 2024
-

 Green2 weeks ago
Top Countries By Forest Growth Since 2001
-

 United States2 weeks ago
Ranked: The Largest U.S. Corporations by Number of Employees
-

 Maps2 weeks ago
The Largest Earthquakes in the New York Area (1970-2024)
-

 Green2 weeks ago
Ranked: The Countries With the Most Air Pollution in 2023