Business
Visualized: The Top 25 U.S. Newspapers by Daily Circulation


Visualized: The Top 25 U.S. Newspapers by Daily Circulation
Most people today—more than 8 in 10 Americans—get their news via digital devices, doing their reading on apps, listening to podcasts, or scrolling through social media feeds.
It’s no surprise then that over the last year, only one U.S. newspaper of the top 25 most popular in the country saw positive growth in their daily print circulations.
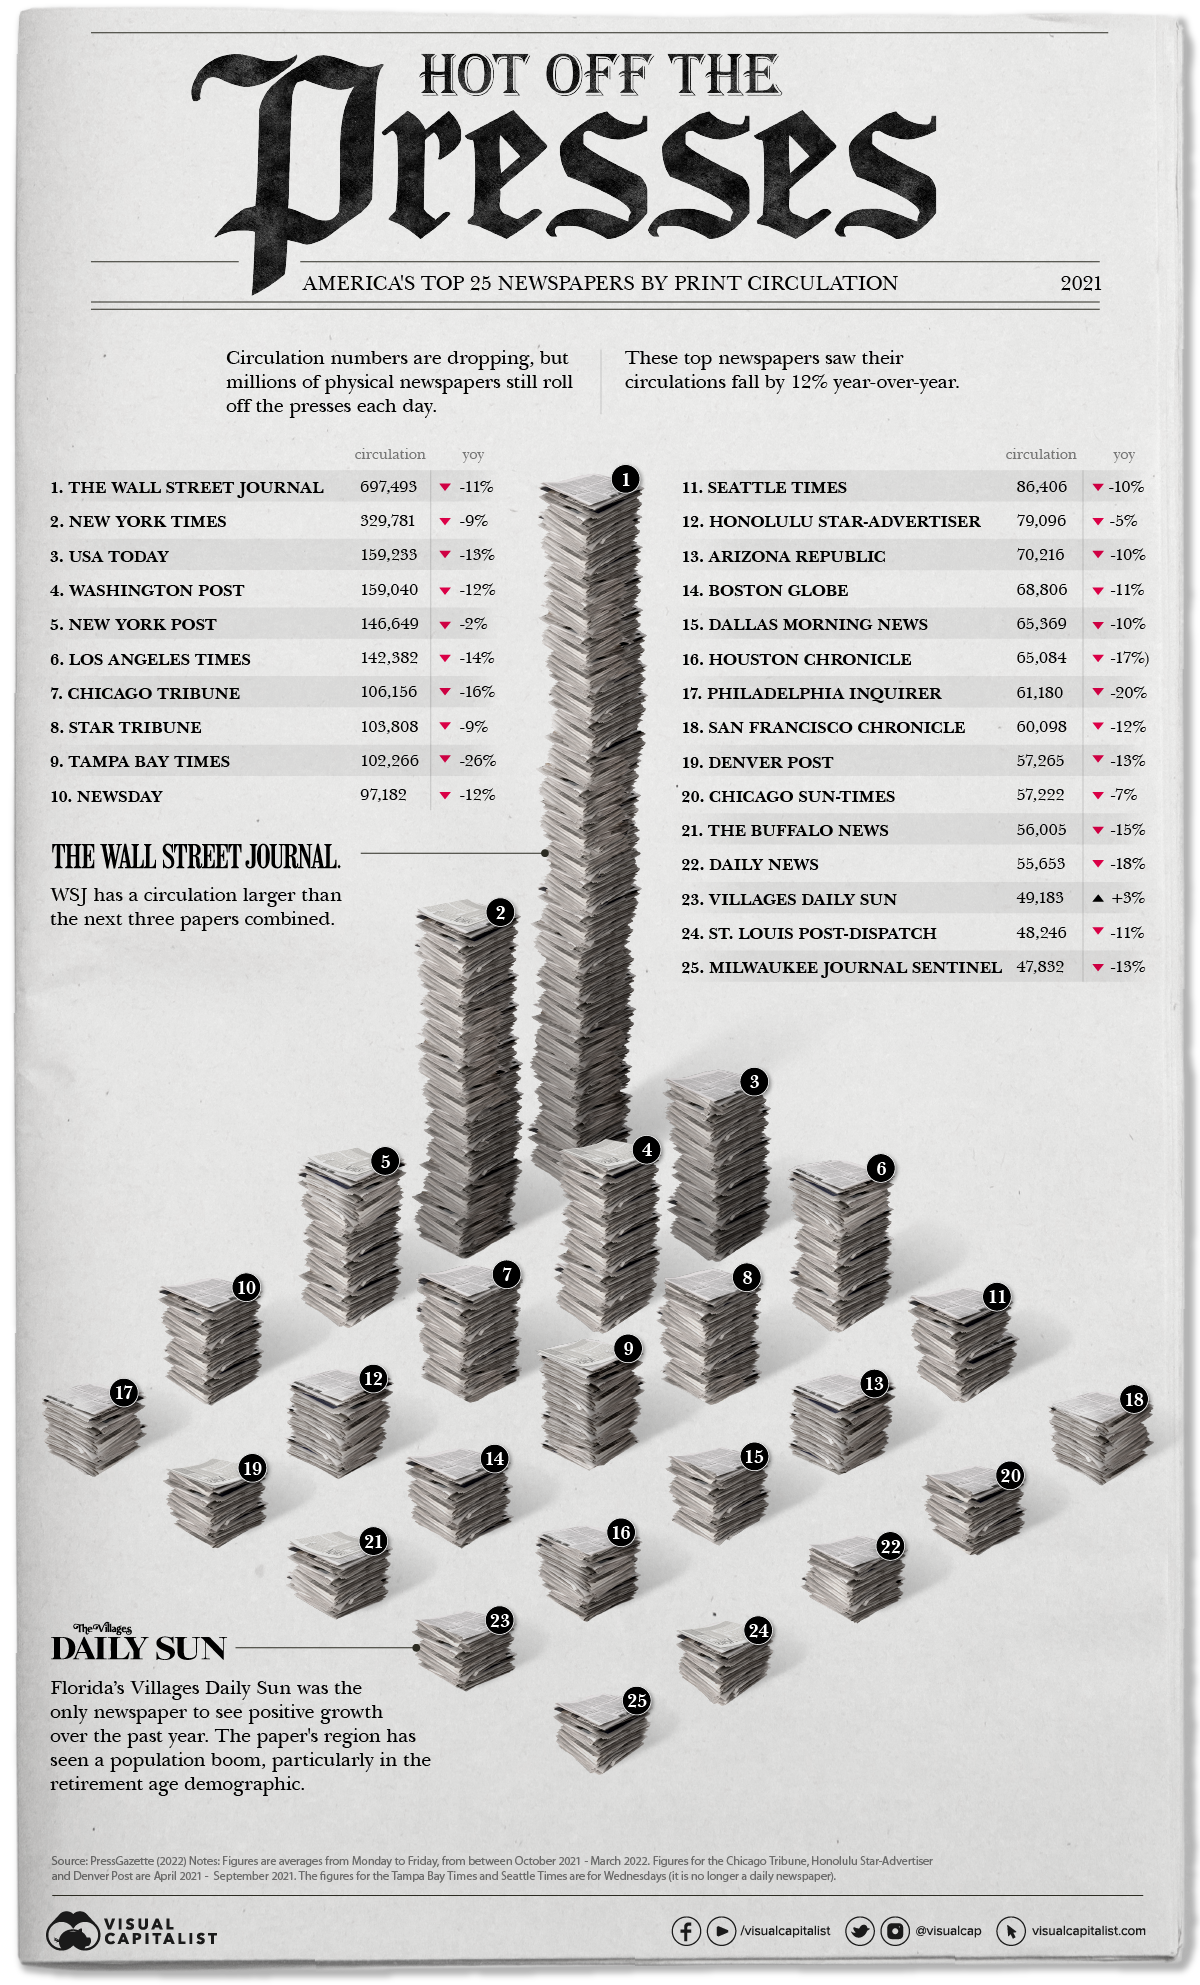
Based on data from Press Gazette, this visual stacks up the amount of daily newspapers different U.S. publications dole out and how that’s changed year-over-year.
Extra, Extra – Read All About It
The most widely circulated physical newspaper is the Wall Street Journal (WSJ) by a long shot—sending out almost 700,000 copies a day. But it is important to note that this number is an 11% decrease since 2021.
Here’s a closer look at the data.
| Rank | Newspaper | Average Daily Print Circulation | Year-Over-Year Change |
|---|---|---|---|
| #1 | Wall Street Journal | 697,493 | −11% |
| #2 | New York Times | 329,781 | −9% |
| #3 | USA Today | 159,233 | −13% |
| #4 | Washington Post | 159,040 | −12% |
| #5 | New York Post | 146,649 | −2% |
| #6 | Los Angeles Times | 142,382 | −14% |
| #7 | Chicago Tribune | 106,156 | −16% |
| #8 | Star Tribune | 103,808 | −9% |
| #9 | Tampa Bay Times | 102,266 | −26% |
| #10 | Newsday | 97,182 | −12% |
| #11 | Seattle Times | 86,406 | −10% |
| #12 | Honolulu Star-Advertiser | 79,096 | −5% |
| #13 | Arizona Republic | 70,216 | −10% |
| #14 | Boston Globe | 68,806 | −11% |
| #15 | Dallas Morning News | 65,369 | −10% |
| #16 | Houston Chronicle | 65,084 | −17% |
| #17 | Philadelphia Inquirer | 61,180 | −20% |
| #18 | San Francisco Chronicle | 60,098 | −12% |
| #19 | Denver Post | 57,265 | −13% |
| #20 | Chicago Sun-Times | 57,222 | −7% |
| #21 | The Buffalo News | 56,005 | −15% |
| #22 | Daily News | 55,653 | −18% |
| #23 | Villages Daily Sun | 49,183 | 3% |
| #24 | St. Louis Post-Dispatch | 48,246 | −11% |
| #25 | Milwaukee Journal Sentinel | 47,832 | −13% |
These papers, although experiencing negative growth when it comes to print, are still extremely popular and widely-read publications digitally—not only in the U.S., but worldwide. For example, the New York Times reported having reached 9 million subscribers globally earlier this year.
The one paper with increased print circulation was The Villages Daily Sun, which operates out of a retirement community in Florida. Elderly people tend to be the most avid readers of print papers. Another Florida newspaper, the Tampa Bay Times, was the worst performer at -26%.
In total, 2,500 U.S. newspapers have shut down since 2005. One-third of American newspapers are expected to be shuttered by 2025. This particularly impacts small communities and leaves many across America in ‘news deserts.’
Print vs. Digital Newspapers
Regardless of print’s downturn, digital subscriptions remain much higher for most of these papers. As one example, The Washington Post has over 3 million online subscribers, compared to their 159,000 print readers.
To put things in perspective, around 24 million print papers now circulate throughout the U.S. on any given day. But looking back at the industry’s peak in the 1980s, almost 64 million were distributed on any given weekday.
And digital is not done growing. Newsroom hires have been ramping up for “digital-native” news sites—publications that started online and never had a print version. On the flipside, employment at traditional papers has more than halved since 2008.
Problems with Media
American news media can be extremely divisive. Many newsrooms across the country play into fear, sensationalism, and partisan politics.
Digital news only makes this worse, utilizing algorithms designed to keep a person’s eyes on the page longer, pushing stories with narratives a person shows interest in, and often taking them down a rabbit hole of fringe information—sometimes towards the extremes.
Additionally, the business of journalism is an increasingly less lucrative industry. Most revenue comes from digital ads running on news sites—so rather than selling the news to consumers, it’s the time and attention of consumers that is being sold to advertisers. Furthermore, some of the best quality content is locked up behind subscription-based paywalls.
Print may actually be one way to avoid some of the more obvious issues, particularly because there’s no way to track the data on which stories you read. But all publications still have inherent bias, of course, and it’s clear that print papers are not bouncing back any time soon.


Business
The Top Private Equity Firms by Country
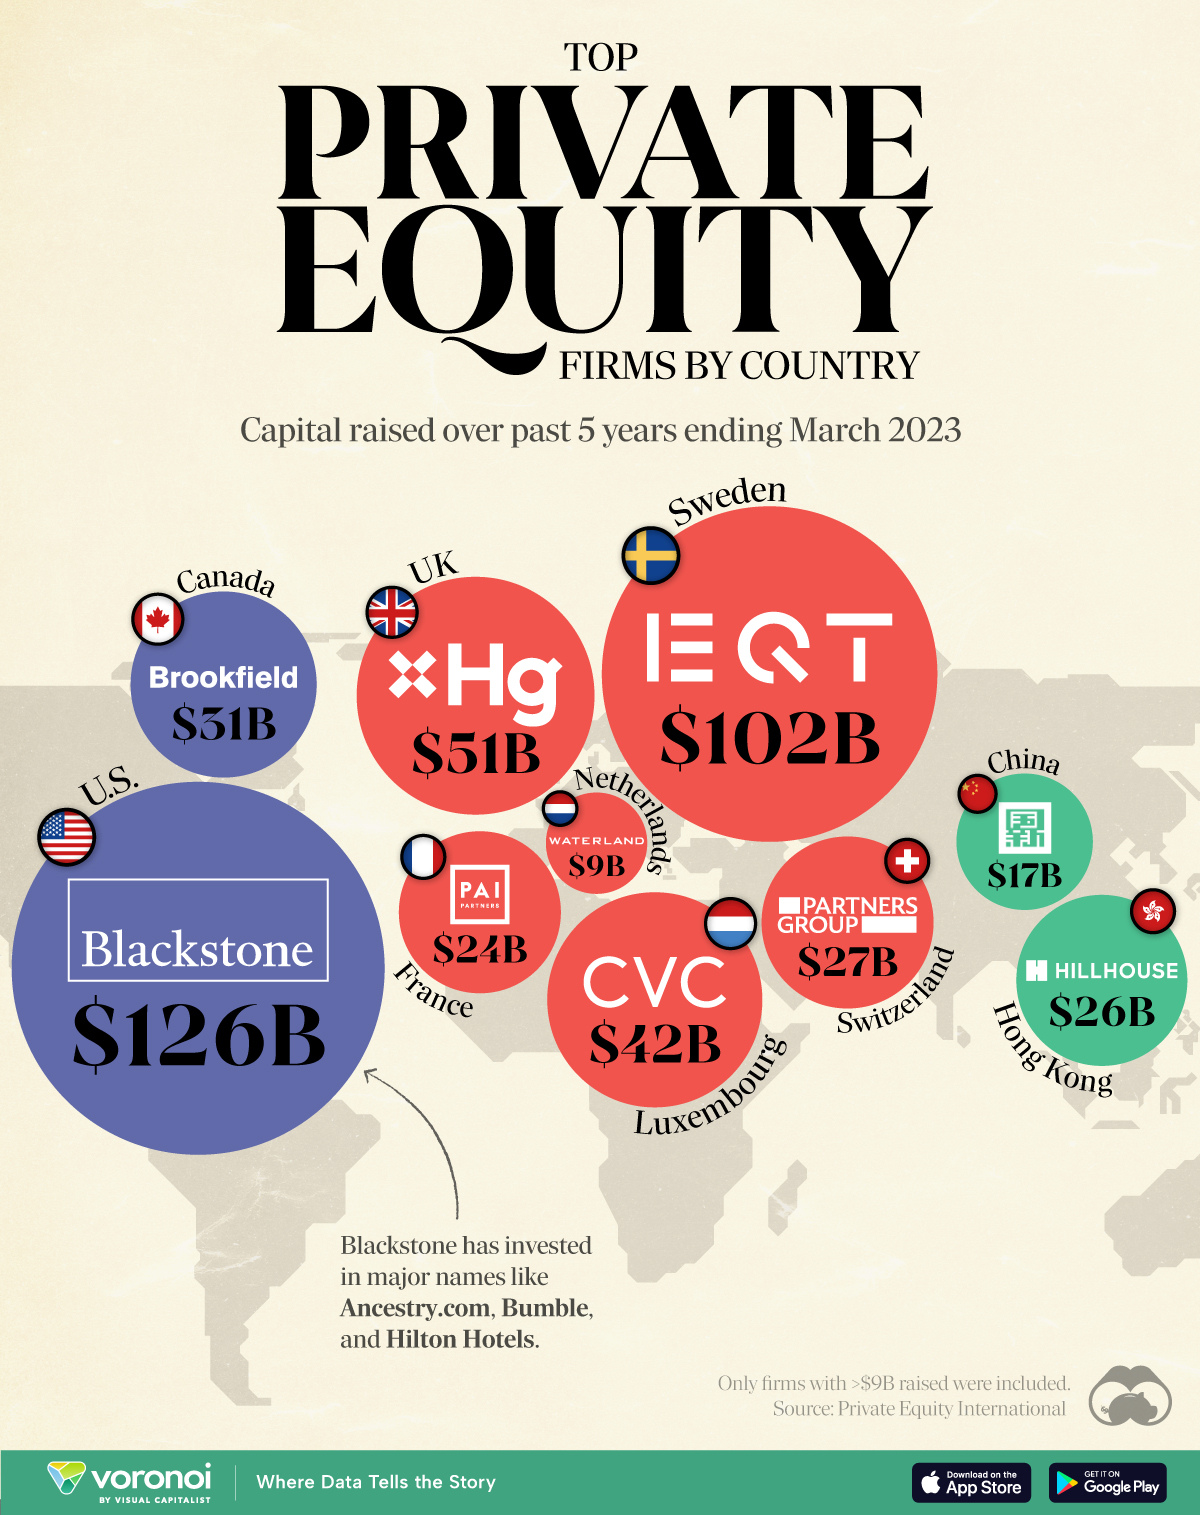
This map visualizes the leading private equity firms of major countries, ranked by capital raised over the past five years.
The Top Private Equity Firms by Country
This was originally posted on our Voronoi app. Download the app for free on iOS or Android and discover incredible data-driven charts from a variety of trusted sources.
Private equity firms are investment management companies that pool investor capital to acquire stakes in private companies. Through strategic management, they aim to enhance the value of these companies, then profit from a future sale or public offering.
To gain insight into this industry, we’ve visualized the top private equity firms in various countries, ranked by the amount of capital they raised over the past five years ending March 2023.
The cutoff for inclusion in this graphic was $9 billion raised. All figures come from Private Equity International’s PEI 300 ranking.
Data and Highlights
The data we used to create this graphic is included in the table below.
| Country | Firm | Amount raised |
|---|---|---|
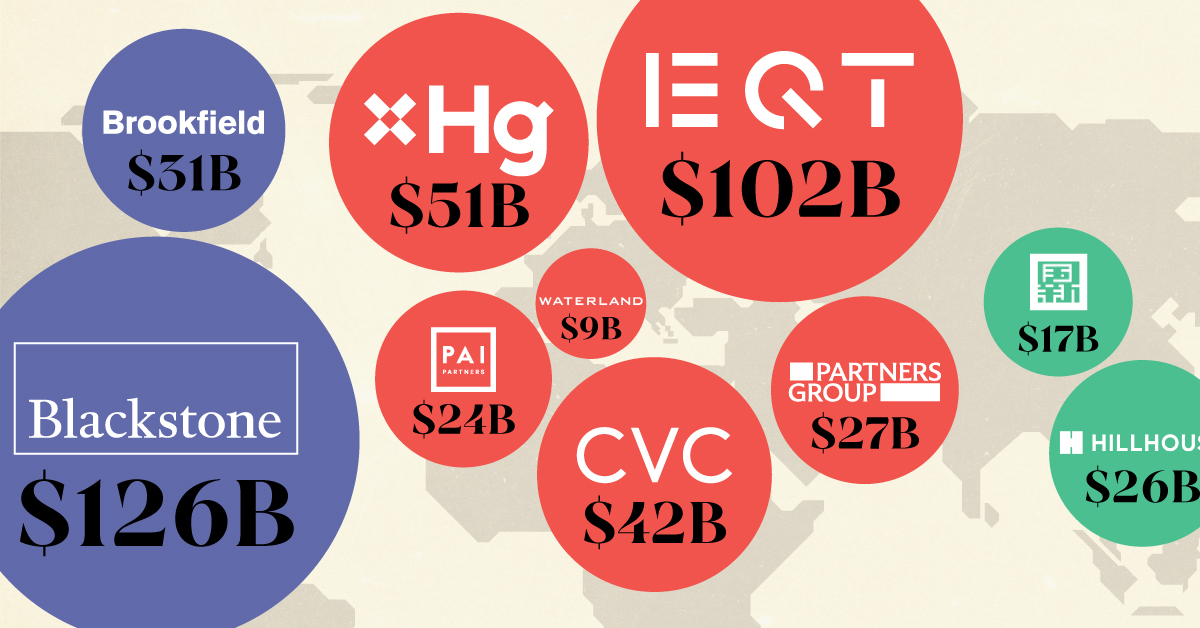
| 🇺🇸 US | Blackstone | $126B |
| 🇸🇪 Sweden | EQT | $102B |
| 🇬🇧 UK | Hg | $51B |
| 🇱🇺 Luxembourg | CVC Capital Partners | $42B |
| 🇨🇦 Canada | Brookfield Asset Management | $31B |
| 🇨🇭 Switzerland | Partners Group | $27B |
| 🇭🇰 Hong Kong | Hillhouse Capital Group | $26B |
| 🇫🇷 France | PAI Partners | $24B |
| 🇨🇳 China | China Reform Fund Management Corp | $17B |
| 🇳🇱 Netherlands | Waterland Private Equity | $9B |
U.S.-based Blackstone is the world’s largest private equity firm, with operations in additional areas like credit, infrastructure, and insurance.
While not shown in this graphic, the U.S. largely dominates the private equity landscape. If we were to rank the top 10 private equity firms by the same metric (capital raised over past five years), U.S. firms would account for eight of them.
More About Blackstone
Blackstone was founded in 1985 by Peter G. Peterson and Stephen A. Schwarzman, both former Lehman Brothers employees.
Notably investments that Blackstone has made include Ancestry.com, where it acquired a majority stake for nearly $5 billion in 2020.
In 2007, it also acquired Hilton Worldwide (one of the world’s biggest hotel operators) for roughly $26 billion.
Sweden’s EQT
EQT is Sweden’s largest private equity firm, and third largest globally. It is just one of three firms that have raised over $100B in capital over the past five years alongside Blackstone and KKR (also American).
EQT made news earlier this year when it raised $24B in two years for its EQT X private equity fund, which invests in the healthcare, technology and tech-enabled service sectors.
If you found this post interesting, check out this graphic that visualizes the most common types of investments that financial advisors use with their clients.

-

 Green6 days ago
The Carbon Footprint of Major Travel Methods
-

 Misc2 weeks ago
How Hard Is It to Get Into an Ivy League School?
-

 Debt2 weeks ago
How Debt-to-GDP Ratios Have Changed Since 2000
-

 Sports2 weeks ago
The Highest Earning Athletes in Seven Professional Sports
-

 Science2 weeks ago
Visualizing the Average Lifespans of Mammals
-

 Brands2 weeks ago
How Tech Logos Have Evolved Over Time
-

 Energy1 week ago
Ranked: The Top 10 EV Battery Manufacturers in 2023
-

 Demographics1 week ago
Countries With the Largest Happiness Gains Since 2010