Misc
Visualized: Comparing the Titanic to a Modern Cruise Ship
View the full-resolution version of this infographic


Remembering the Tragedy of the Titanic
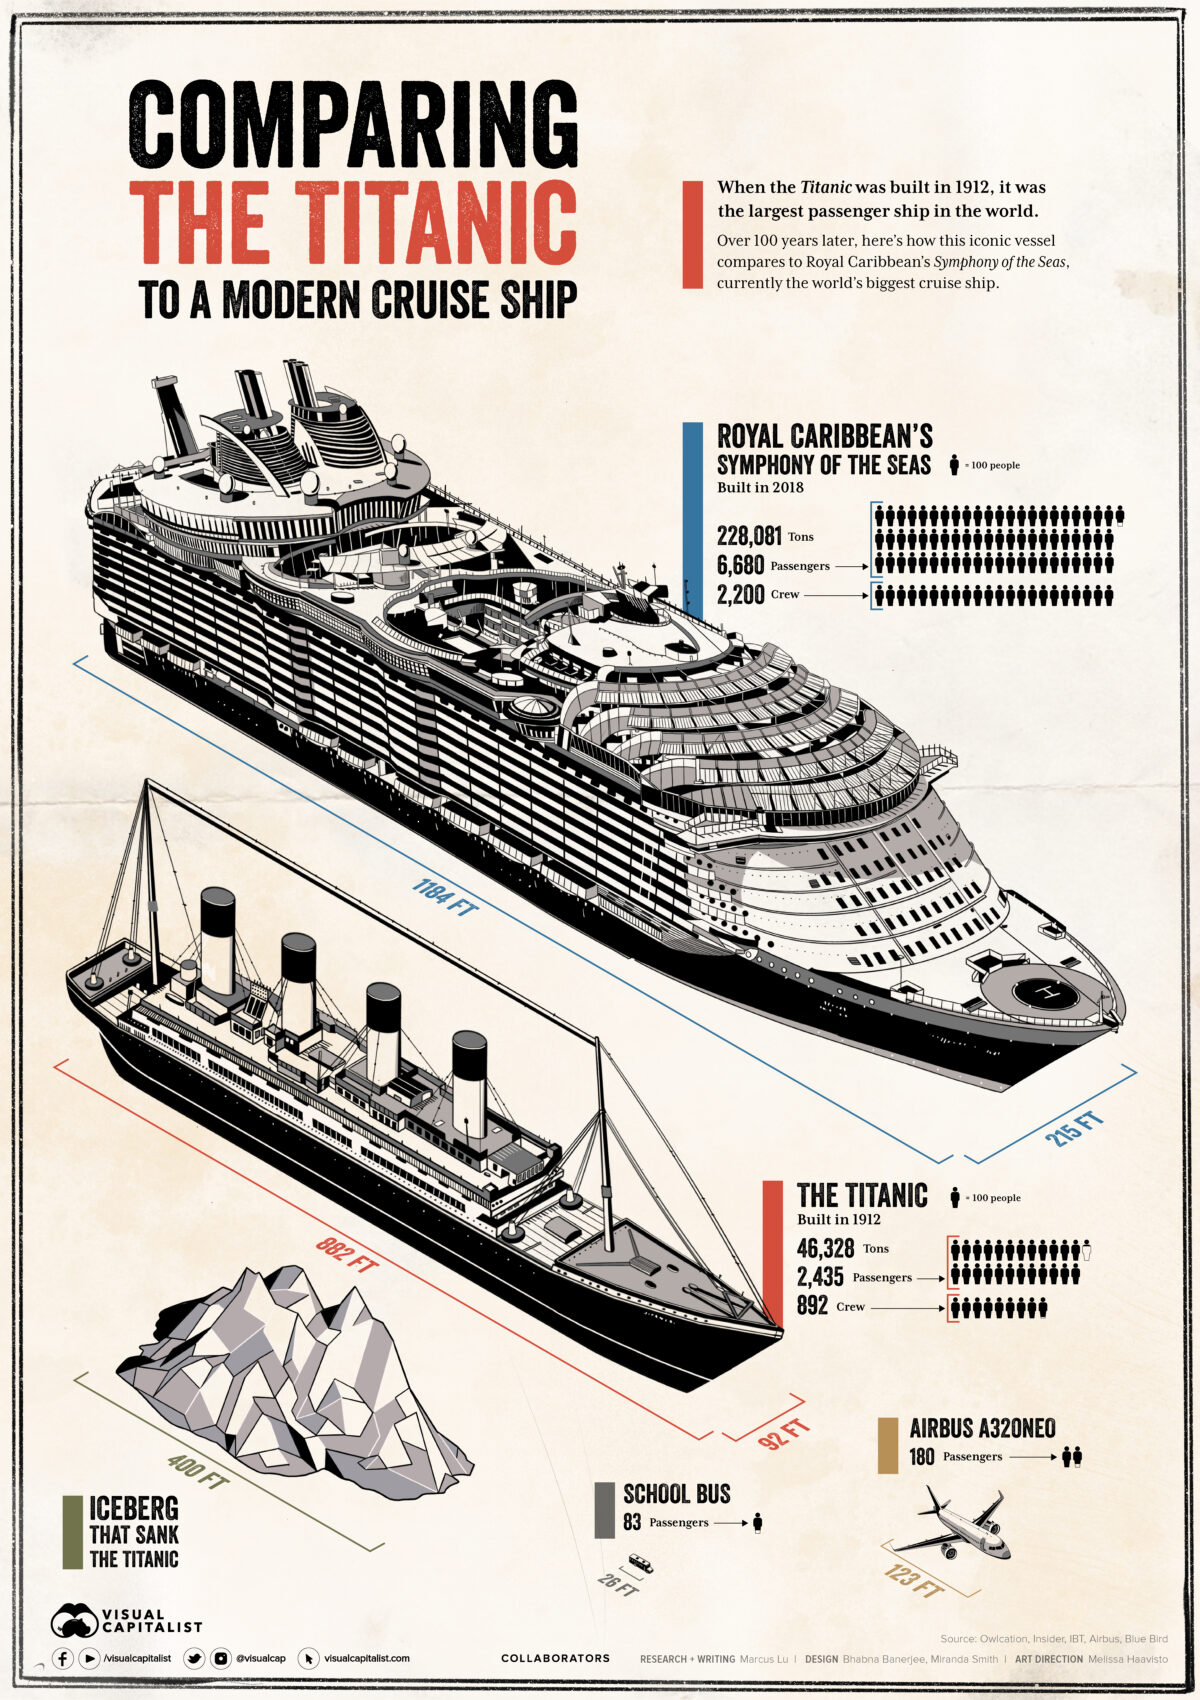
When the Titanic was completed on April 2, 1912, it was the largest and perhaps most luxurious ship in the world. The vessel could hold over 3,300 people including crew members, and boasted various amenities including a swimming pool and squash court.
The Titanic’s impressive size attracted many of the world’s wealthiest individuals, and on April 10, 1912, it set out on its maiden voyage. Just five days later, the ship sank after hitting an iceberg, resulting in more than 1,500 deaths.
It’s been over 100 years since the Titanic’s demise, so how have passenger ships evolved?
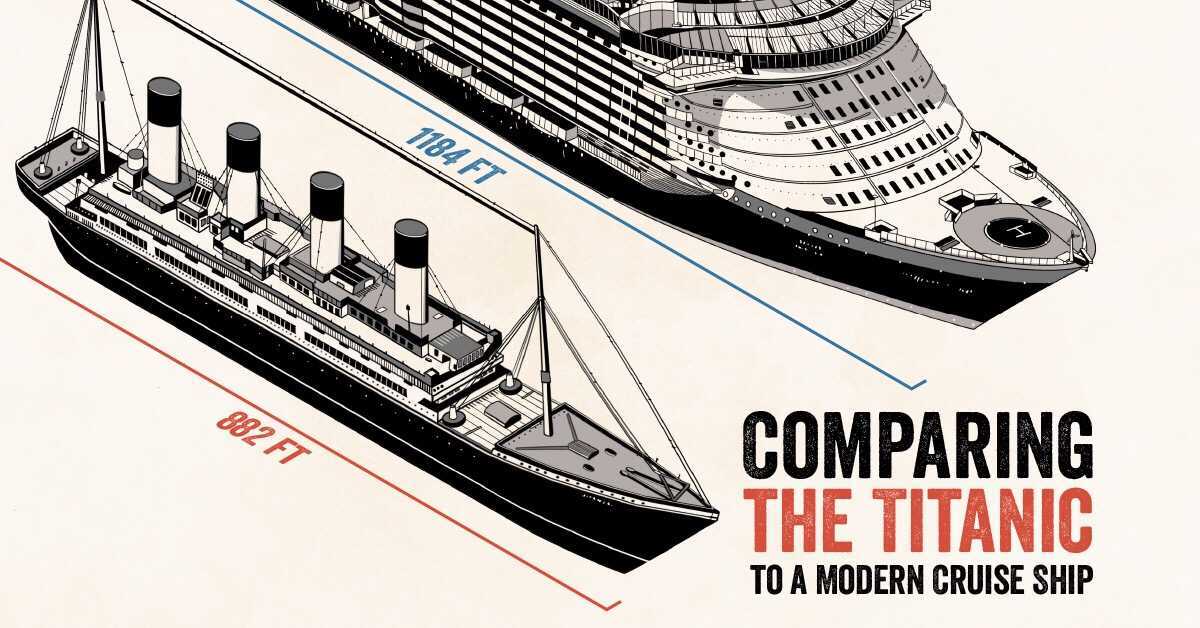
To find out, we’ve visualized it beside Royal Caribbean’s Symphony of the Seas, currently the world’s largest cruise ship.
The Size of the Titanic, in Perspective
The following table lists the dimensions of both ships to provide a better understanding of the Titanic’s relative size.
| RMS Titanic | Symphony of the Seas | |
|---|---|---|
| Year Built | 1912 | 2018 |
| Length | 882ft (269m) | 1,184ft (361m) |
| Width | 92ft (28m) | 215ft (66m) |
| Height | 175ft (53m) | 238ft (73m) |
| Internal volume | 46,328 gross register tonnage (grt) | 228,081 gross tonnage (gt) |
| Passengers | 2,435 | 6,680 |
| Crew | 892 | 2,200 |
Source: Owlcation, Insider
Note: Gross register tonnage (grt) is a historic measure of a ship’s internal volume. This metric was replaced by gross tonnage (gt) on July 18, 1982.
One of the biggest differences between these two ships is width, with the latter being more than twice as wide. This is likely due to the vast amenities housed within the Symphony of the Seas, which includes 24 pools, 22 restaurants, 2 rock climbing walls, an ice-skating rink, and more. With accommodations for 6,680 passengers, the Symphony of the Seas also supports a crew that is 147% larger.
The Symphony of the Seas clearly surpasses the Titanic in terms of size, but there’s also a substantial difference in cost. When converted to today’s dollars, the bill for the Titanic equates to roughly $400 million, less than half of the Symphony of the Seas’ cost of $1.35 billion.
Lessons Learned from the Disaster
Inadequate safety preparations were a contributor to the Titanic’s high death toll. During its journey, the vessel carried enough lifeboats to accommodate just 33% of its total passengers and crew. This was legal at the time, as regulations based a ship’s number of required lifeboats on its weight, rather than its passenger capacity.
To make matters worse, investigations determined that the Titanic’s lifeboats had not been used to their full capacity, and that a scheduled lifeboat drill had been cancelled by the ship’s captain. These shortfalls, among others, paved the way for numerous improvements in maritime safety regulation.
These include the creation of the International Convention for the Safety of Life at Sea Treaty (SOLAS) in 1914, which is still in force today. Regarded as the most important international treaty on ship safety, SOLAS has been updated numerous times and is followed by 164 states, which together flag 99% of merchant ships (by gross tonnage) on the high seas today.


Politics
Charted: Trust in Government Institutions by G7 Countries
How much do you trust the government and its various institutions? We look at data for G7 countries for the time period of 2006-2023.


Trust in Government Institutions by G7 Countries
This was originally posted on our Voronoi app. Download the app for free on iOS or Android and discover incredible data-driven charts from a variety of trusted sources.
How much do you trust the government, and its various institutions?
It’s likely that your level of confidence probably depends on a wide range of factors, such as perceived competency, historical context, economic performance, accountability, social cohesion, and transparency.
And for these same reasons, trust levels in government institutions also change all the time, even in the world’s most developed countries: the G7.
Confidence in Government by G7 Countries (2006-2023)
This chart looks at the changes in trust in government institutions between the years 2006 and 2023, based on data from a multi-country Gallup poll.
Specifically, this dataset aggregates confidence in multiple national institutions, including the military, the judicial system, the national government, and the integrity of the electoral system.
| Country | Confidence (2006) | Confidence (2023) | Change (p.p.) |
|---|---|---|---|
| Canada | 57% | 64% | +7 |
| Britain | 63% | 63% | +0 |
| Germany | 55% | 61% | +6 |
| France | 54% | 60% | +6 |
| Japan | 48% | 59% | +11 |
| Italy | 41% | 54% | +13 |
| United States | 63% | 50% | -13 |
What’s interesting here is that in the G7, a group of the world’s most developed economies, there is only one country bucking the general trend: the United States.
Across most G7 countries, confidence in institutions has either improved or stayed the same between 2006 and 2023. The largest percentage point (p.p.) increases occur in Italy and Japan, which saw +13 p.p. and +11 p.p. increases in trust over the time period.
In the U.S., however, confidence in government institutions has fallen by 13 p.p. over the years. What happened?
Key Figures on U.S. Trust in Institutions
In 2006, the U.S. was tied with the UK as having the highest confidence in government institutions, at 63%.
But here’s where the scores stand in 2023, across various institutions:
| 🇺🇸 Institutions | Confidence (2023) |
|---|---|
| Military | 81% |
| Judiciary | 42% |
| National Government | 30% |
| Elections | 44% |
| Overall | 49% |
Based on this data, it’s clear that the U.S. lags behind in three key indicators: confidence in the national government, confidence in the justice system, and confidence in fair elections. It ranked in last place for each indicator in the G7.
One other data point that stands out: despite leading the world in military spending, the U.S. is only the third most confident in its military in the G7. It lags behind France (86%) and the United Kingdom (83%).

-

 Wealth6 days ago
Charted: Which City Has the Most Billionaires in 2024?
-

 Mining2 weeks ago
Gold vs. S&P 500: Which Has Grown More Over Five Years?
-

 Uranium2 weeks ago
The World’s Biggest Nuclear Energy Producers
-

 Education2 weeks ago
How Hard Is It to Get Into an Ivy League School?
-

 Debt2 weeks ago
How Debt-to-GDP Ratios Have Changed Since 2000
-

 Sports2 weeks ago
The Highest Earning Athletes in Seven Professional Sports
-

 Science2 weeks ago
Visualizing the Average Lifespans of Mammals
-

 Brands1 week ago
How Tech Logos Have Evolved Over Time