Economy
The U.S. States with the Top Tech Salaries in 2021
The U.S. States with the Top Tech Salaries in 2021
In 2020, despite the economic turmoil caused by the global pandemic, America’s tech sector experienced rapid growth. Last year, the total number of U.S. tech jobs grew by 60,000.
Because of this demand, U.S. employers are willing to pay for the right talent—on average, tech workers in the U.S. earn about 61% more than the average salary. But some tech workers make more than others, depending on where they live.
This graphic by business.org uses data from the Bureau of Labor Statistics (BLS) to highlight the average annual tech salaries in each state, compared to the average salary of other occupations. We’ll also touch on the top-paying metro areas, and what type of tech jobs offer the highest compensation across the country.
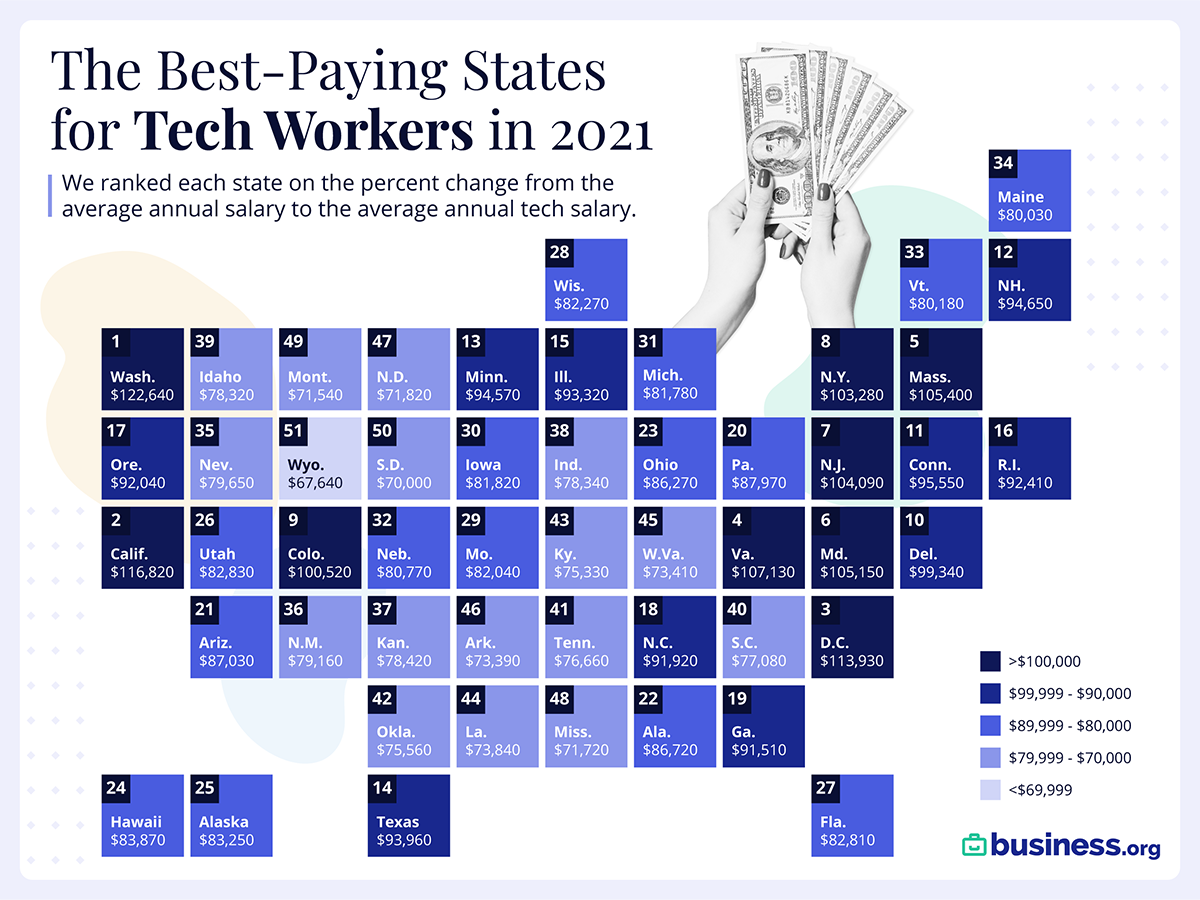
Average U.S. Tech Salaries by State
Perhaps unsurprisingly, Washington and California have the highest average salaries, largely because of the high job density in those areas.
However, when it comes to the difference in tech salary versus average salary, Alabama takes the top spot—on average, tech jobs pay 85% more than other occupations in that state.
| Rank | State | Average hourly wage for tech workers | Average salary for tech workers | % more that tech workers earn than all occupations |
|---|---|---|---|---|
| 1 | Alabama | $41.69 | $86,720 | 85% |
| 2 | Washington | $58.96 | $122,640 | 83% |
| 3 | North Carolina | $44.19 | $91,920 | 80% |
| 4 | Texas | $45.04 | $93,690 | 79% |
| 5 | Virginia | $51.50 | $107,130 | 78% |
| 6 | California | $56.16 | $116,820 | 78% |
| 7 | Georgia | $44.00 | $91,510 | 76% |
| 8 | Delaware | $47.76 | $99,340 | 75% |
| 9 | Mississippi | $34.48 | $71,720 | 72% |
| 10 | Ohio | $41.48 | $86,270 | 67% |
| 11 | Idaho | $37.65 | $78,320 | 67% |
| 12 | New Hampshire | $45.50 | $94,650 | 67% |
| 13 | South Carolina | $37.06 | $77,080 | 67% |
| 14 | Iowa | $39.34 | $81,820 | 66% |
| 15 | Florida | $39.81 | $82,810 | 66% |
| 16 | Maryland | $50.55 | $105,150 | 65% |
| 17 | Colorado | $48.33 | $100,520 | 65% |
| 18 | Arkansas | $35.28 | $73,390 | 64% |
| 19 | Kentucky | $36.21 | $75,330 | 64% |
| 20 | Missouri | $39.44 | $82,040 | 64% |
| 21 | New Jersey | $50.04 | $104,090 | 63% |
| 22 | Pennsylvania | $42.29 | $87,970 | 63% |
| 23 | Arizona | $41.84 | $87,030 | 63% |
| 24 | Oregon | $44.25 | $92,040 | 62% |
| 25 | West Virginia | $35.29 | $73,410 | 62% |
| 26 | Kansas | $37.70 | $78,420 | 61% |
| 27 | Tennessee | $36.86 | $76,660 | 61% |
| 28 | Utah | $39.82 | $82,830 | 61% |
| 29 | Minnesota | $45.47 | $94,570 | 61% |
| 30 | Indiana | $37.66 | $78,340 | 61% |
| 31 | Nebraska | $38.83 | $80,770 | 61% |
| 32 | Illinois | $44.87 | $93,320 | 61% |
| 33 | Wisconsin | $39.55 | $82,270 | 61% |
| 34 | Oklahoma | $36.33 | $75,560 | 60% |
| 35 | New Mexico | $38.06 | $79,160 | 59% |
| 36 | Louisiana | $35.50 | $73,840 | 59% |
| 37 | Nevada | $38.29 | $79,650 | 58% |
| 38 | Maine | $38.48 | $80,030 | 56% |
| 39 | South Dakota | $33.65 | $70,000 | 56% |
| 40 | Rhode Island | $44.43 | $92,410 | 53% |
| 41 | Michigan | $39.32 | $81,780 | 53% |
| 42 | New York | $49.65 | $103,280 | 52% |
| 43 | Montana | $34.40 | $71,540 | 51% |
| 44 | Massachusetts | $50.67 | $105,400 | 51% |
| 45 | Vermont | $38.55 | $80,180 | 50% |
| 46 | Connecticut | $45.94 | $95,550 | 46% |
| 47 | Hawaii | $40.32 | $83,870 | 44% |
| 48 | North Dakota | $34.53 | $71,820 | 37% |
| 49 | Alaska | $40.02 | $83,250 | 35% |
| 50 | Wyoming | $32.52 | $67,640 | 32% |
| 51 | District of Columbia | $54.78 | $113,930 | 20% |
Why are tech workers so generously compensated in Alabama? It could be because the area’s talent pool is not keeping up with demand.
In 2021, Huntsville, Alabama is expected to see 25,000 new jobs in aerospace, logistics, defense, and other tech-related industries. But these jobs could be difficult to fill given the area’s low unemployment rate.
On the other end of the spectrum, the District of Columbia has the smallest discrepancy between tech and other salaries. But at $95,330, the area has the highest average yearly salary for other occupations in the country—and tech workers still make 20% more.
Top 10 Metro Areas for Tech Salaries
Some of the highest-paying states are also home to the highest-paying metro areas.
For instance, when it comes to pay differences in tech, two of the top 10 metro areas are located in Washington state, while three are in California. The graphic below shows the metros with the highest difference between the area’s average salary and the average salary of tech jobs.
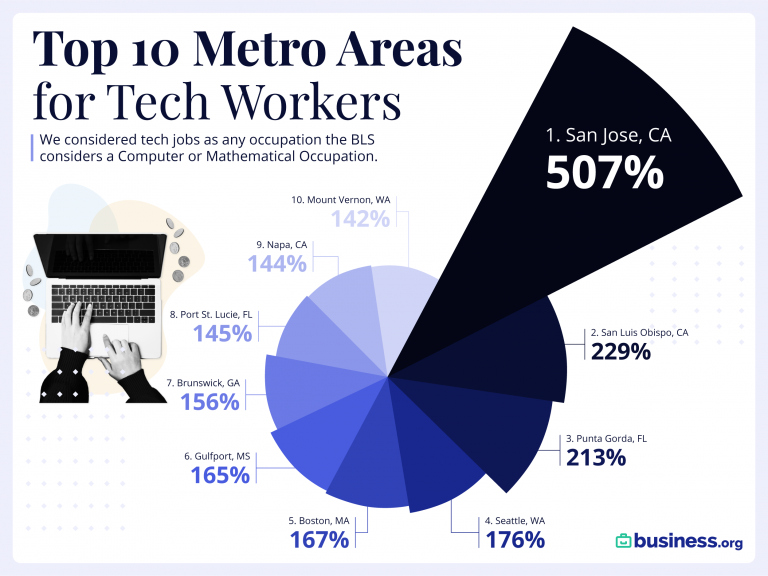
The highest pay difference between tech jobs vs the average salary is in San Jose, where tech workers make 507% more on average. This figure is almost certainly skewed because of the area’s high concentration of tech millionaires and top tier programmers.
Highest Paying Tech Jobs Nationally
Of course, location isn’t the only factor that plays into salary—the type of job is important, too. Here’s a look at U.S. tech salaries, organized by job type:
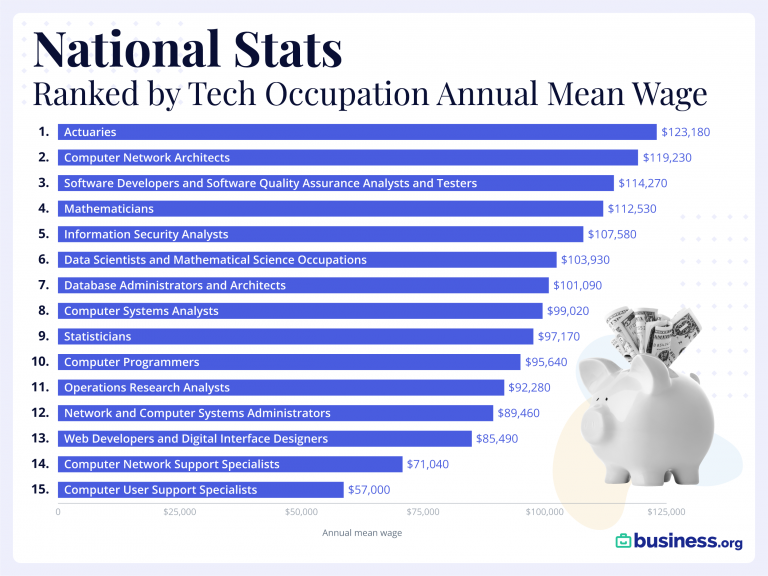
In this analysis, which looked at jobs in computer science as well as mathematics, actuaries are the highest paid professionals on average.
While actuaries are more on the mathematical and financial side of the equation, more commonly associated jobs with tech are all over the list as well: software developers, computer network architects, information security analysts, data scientists, computer programmers, web developers, computer systems analysts, and so on.
The Future of Tech is Bright
America’s information technology sector, worth about $1.6 trillion, is expected to grow to $5 trillion by the end of 2021. And as this fast-growing industry continues to boom, jobs in this sector are likely to remain in high supply.
Augmented Reality (AR) in the U.S. is looking especially promising and is projected to grow by a CAGR of 100% between 2021-2025.
In short, tech is expected to keep growing. And salaries will likely follow suit.


Economy
The Most Valuable Companies in Major EU Economies
From semiconductor equipment manufacturers to supercar makers, the EU’s most valuable companies run the gamut of industries.
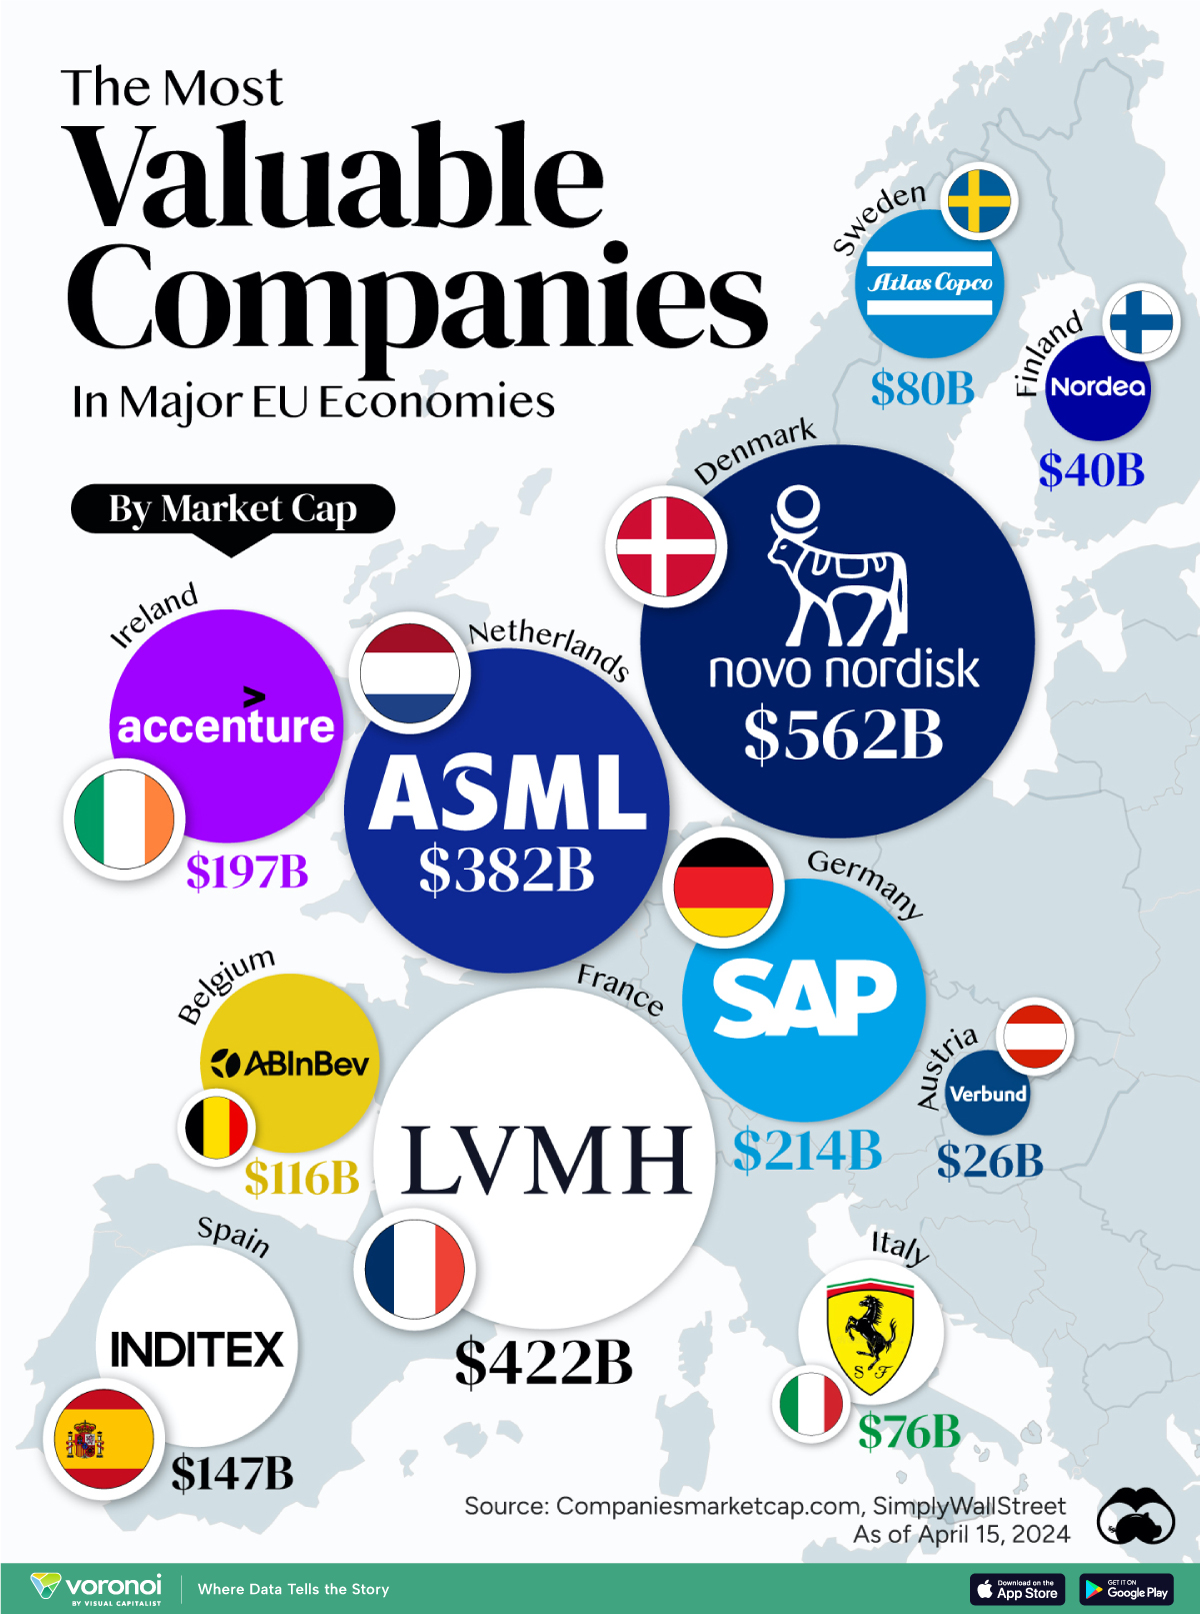
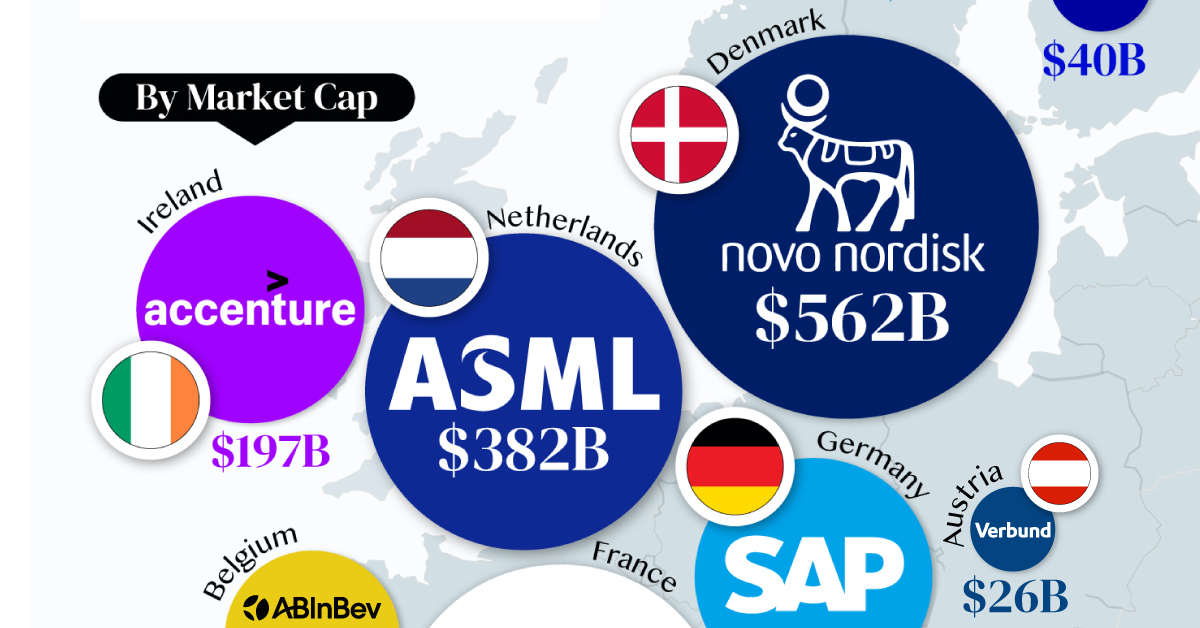
Most Valuable Companies in the EU, by Country
This was originally posted on our Voronoi app. Download the app for free on iOS or Android and discover incredible data-driven charts from a variety of trusted sources.
In this graphic, we mapped out the most valuable corporations in 11 major EU economies, based on their market capitalizations as of April 15th, 2024. All figures are in USD, and were sourced from Companiesmarketcap.com.
Novo Nordisk is currently worth more than $550 billion, making it Europe’s most valuable company by a wide margin. The pharmaceutical giant specializes in diabetes and weight-loss drugs. Demand for two of them, Ozempic and Wegovy, has surged due to their weight-loss capabilities, even causing nationwide shortages in the United States.
The following table includes an expanded list of the most valuable publicly-traded company in larger EU economies. Many of these were not included in the graphic due to space limitations.
| Country | Company | Sector | Market Cap |
|---|---|---|---|
| 🇩🇰 Denmark | 💊 Novo Nordisk | Pharmaceuticals | $562B |
| 🇫🇷 France | 👜 LVMH | Luxury Goods | $422B |
| 🇳🇱 Netherlands | 🔧 ASML | Semiconductor Equipment | $382B |
| 🇩🇪 Germany | 💼 SAP | Enterprise Software | $214B |
| 🇮🇪 Ireland | 🖥️ Accenture | IT Services | $197B |
| 🇪🇸 Spain | 👗 Inditex | Retail | $147B |
| 🇧🇪 Belgium | 🍻 Anheuser-Busch InBev | Beverages | $116B |
| 🇸🇪 Sweden | 🛠️ Atlas Copco | Industrial Equipment | $80B |
| 🇮🇹 Italy | 🏎️ Ferrari | Automotive | $76B |
| 🇫🇮 Finland | 🏦 Nordea Bank | Banking | $40B |
| 🇦🇹 Austria | 🔌 Verbund AG | Energy | $26B |
| 🇱🇺 Luxembourg | 🏗️ Tenaris | Oil & Gas Equipment | $22B |
| 🇨🇿 Czech Republic | 💡 CEZ Group | Energy | $20B |
| 🇵🇱 Poland | ⛽ PKN Orlen | Energy | $20B |
| 🇵🇹 Portugal | 🔌 EDP Group | Energy | $16B |
| 🇬🇷 Greece | 🏦 Eurobank | Banking | $7B |
| 🇭🇺 Hungary | ⛽ MOL Group | Energy | $7B |
| 🇭🇷 Croatia | 🏦 Zagrebacka Banka | Banking | $6B |
| 🇷🇴 Romania | ⛽ Romgaz | Energy | $4B |
| 🇸🇮 Slovenia | 💊 Krka | Pharmaceuticals | $4B |
Note: Figures are rounded and last updated on April 15th, 2024. Countries with top publicly-traded companies worth under $4 billion are excluded.
Luxury supergiant LVMH—which owns brands like Tiffany, Christian Dior, and TAG Heuer to name a few—is Europe’s second largest company by market cap, at $420 billion.
Rounding out the top three is ASML, which produces equipment crucial to chip manufacturers, worth $380 billion.
When looking at the region, there is a vast disparity between EU member states and their most valuable companies.
For example, as mentioned earlier, Denmark’s Novo Nordisk and France’s LVMH are worth between $400-550 billion each. Meanwhile, some countries don’t even have a single publicly-listed company that is worth over $1 billion.
In fact, only 12 EU countries (less than half of the union) are home to the top 100 most valuable companies within the bloc. An additional four countries are represented if you look at the list of the top 200 companies.

-

 Technology6 days ago
All of the Grants Given by the U.S. CHIPS Act
-

 Uranium2 weeks ago
The World’s Biggest Nuclear Energy Producers
-

 Education2 weeks ago
How Hard Is It to Get Into an Ivy League School?
-

 Debt2 weeks ago
How Debt-to-GDP Ratios Have Changed Since 2000
-

 Sports2 weeks ago
The Highest Earning Athletes in Seven Professional Sports
-

 Science2 weeks ago
Visualizing the Average Lifespans of Mammals
-

 Brands1 week ago
How Tech Logos Have Evolved Over Time
-

 Energy1 week ago
Ranked: The Top 10 EV Battery Manufacturers in 2023