Mining
TSX Venture Bear Market Now 1,000 Days and Counting [Chart]
![[Chart]](https://www.visualcapitalist.com/wp-content/uploads/2015/06/tsxv-bear-market-1000-day-chart.jpg)
TSX Venture Bear Market Now 1,000 Days and Counting [Chart]
The Chart of the Week is a weekly Visual Capitalist feature on Fridays.
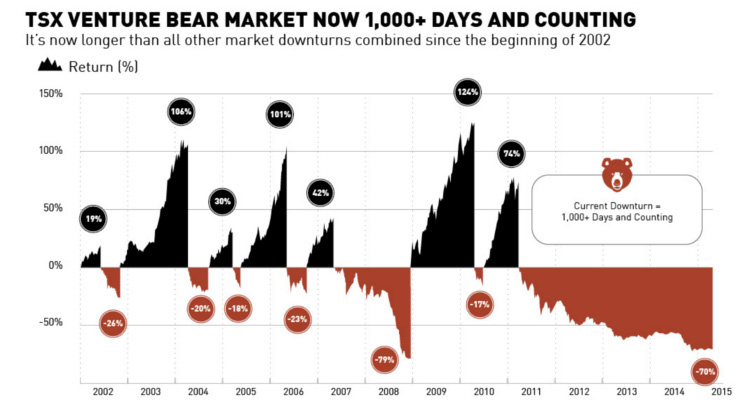
Last week, our friends at Palisade Capital, a merchant bank, sent us over a chart breaking up the S&P/TSX Venture Index into its booms and busts since the beginning of 2002. The index, which broadly represents the thousands of companies listed on the TSX Venture exchange, has reached a new ominous milestone.
“The most recent bear market for the TSX Venture began on April 11, 2011 and has now passed 1,000 trading days in length,” said Sean Zubick, Co-founder and COO of Palisade Capital, “That’s more than all bear markets combined since the beginning of 2002.”
The most recent re-wiring of the index was in the aftermath of the Dotcom bubble. This makes it even accurate to say that the current bear market is longer than all other downturns combined in the entire history of the index as we know it.
All previous downturns have occurred over the course of 802 trading days. The current bear market? Now over 1,000 trading days.
The majority of the companies on the index are listed as being in the business of materials (38%) and energy (30%), and these sectors have been in unprecedented slumps. As we previously noted, there is a “miner problem” in that there is a swath of zombie companies that have $2.15 billion of negative working capital on their books.
This type of systematic trouble is not something that gets rectified overnight, and that’s part of the reason the market is in such a mess.


Lithium
Ranked: The Top 10 EV Battery Manufacturers in 2023
Asia dominates this ranking of the world’s largest EV battery manufacturers in 2023.


The Top 10 EV Battery Manufacturers in 2023
This was originally posted on our Voronoi app. Download the app for free on iOS or Android and discover incredible data-driven charts from a variety of trusted sources.
Despite efforts from the U.S. and EU to secure local domestic supply, all major EV battery manufacturers remain based in Asia.
In this graphic we rank the top 10 EV battery manufacturers by total battery deployment (measured in megawatt-hours) in 2023. The data is from EV Volumes.
Chinese Dominance
Contemporary Amperex Technology Co. Limited (CATL) has swiftly risen in less than a decade to claim the title of the largest global battery group.
The Chinese company now has a 34% share of the market and supplies batteries to a range of made-in-China vehicles, including the Tesla Model Y, SAIC’s MG4/Mulan, and various Li Auto models.
| Company | Country | 2023 Production (megawatt-hour) | Share of Total Production |
|---|---|---|---|
| CATL | 🇨🇳 China | 242,700 | 34% |
| BYD | 🇨🇳 China | 115,917 | 16% |
| LG Energy Solution | 🇰🇷 Korea | 108,487 | 15% |
| Panasonic | 🇯🇵 Japan | 56,560 | 8% |
| SK On | 🇰🇷 Korea | 40,711 | 6% |
| Samsung SDI | 🇰🇷 Korea | 35,703 | 5% |
| CALB | 🇨🇳 China | 23,493 | 3% |
| Farasis Energy | 🇨🇳 China | 16,527 | 2% |
| Envision AESC | 🇨🇳 China | 8,342 | 1% |
| Sunwoda | 🇨🇳 China | 6,979 | 1% |
| Other | - | 56,040 | 8% |
In 2023, BYD surpassed LG Energy Solution to claim second place. This was driven by demand from its own models and growth in third-party deals, including providing batteries for the made-in-Germany Tesla Model Y, Toyota bZ3, Changan UNI-V, Venucia V-Online, as well as several Haval and FAW models.
The top three battery makers (CATL, BYD, LG) collectively account for two-thirds (66%) of total battery deployment.
Once a leader in the EV battery business, Panasonic now holds the fourth position with an 8% market share, down from 9% last year. With its main client, Tesla, now sourcing batteries from multiple suppliers, the Japanese battery maker seems to be losing its competitive edge in the industry.
Overall, the global EV battery market size is projected to grow from $49 billion in 2022 to $98 billion by 2029, according to Fortune Business Insights.

-

 Mining1 week ago
Gold vs. S&P 500: Which Has Grown More Over Five Years?
-

 Markets2 weeks ago
Ranked: The Most Valuable Housing Markets in America
-

 Money2 weeks ago
Which States Have the Highest Minimum Wage in America?
-

 AI2 weeks ago
Ranked: Semiconductor Companies by Industry Revenue Share
-

 Markets2 weeks ago
Ranked: The World’s Top Flight Routes, by Revenue
-

 Countries2 weeks ago
Population Projections: The World’s 6 Largest Countries in 2075
-

 Markets2 weeks ago
The Top 10 States by Real GDP Growth in 2023
-

 Demographics2 weeks ago
The Smallest Gender Wage Gaps in OECD Countries