Markets
The Top 10 U.S. Cities For Women-Owned Businesses
The Top 10 Cities For Women-Owned Businesses
Women are conquering the business world at a rapid pace, especially in areas such as small business and entrepreneurship.
The proof? In the last decade, the number of women-owned firms nationwide has grown by over 3.5 million, now representing 38% of all businesses in the United States.
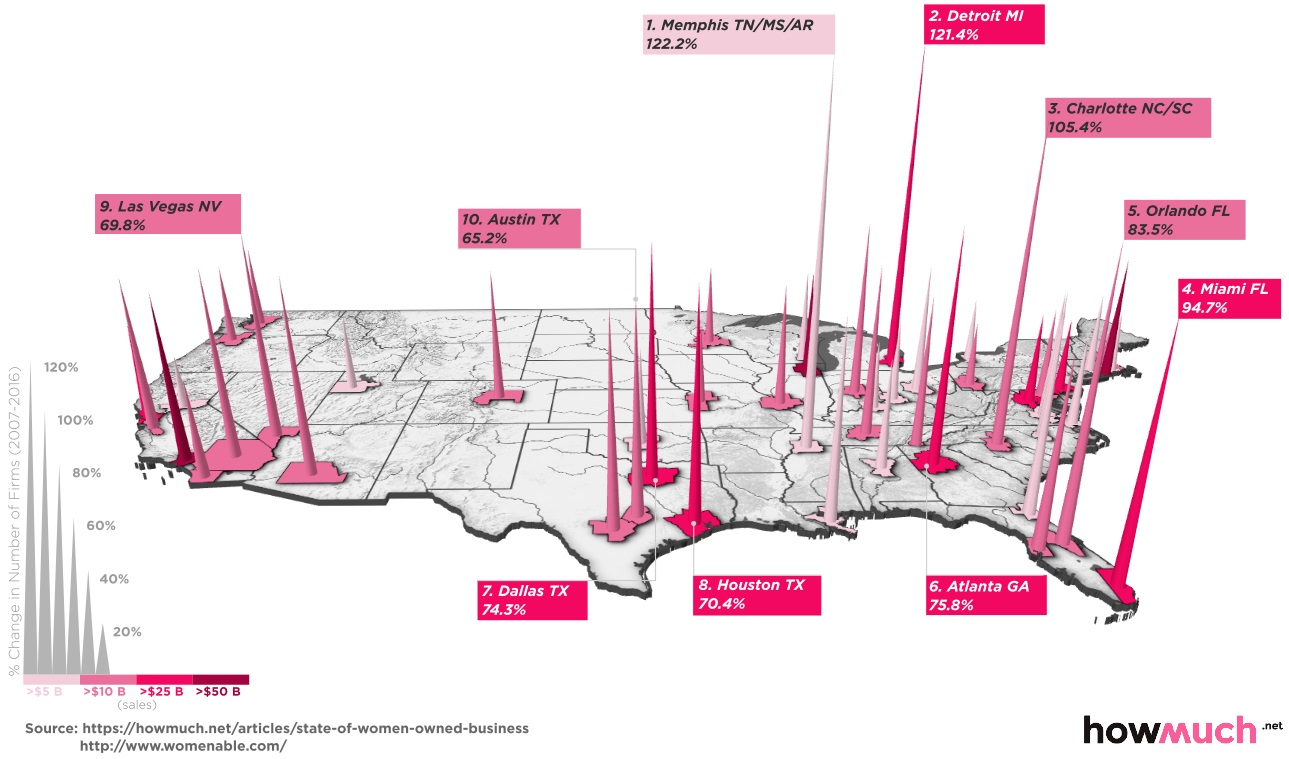
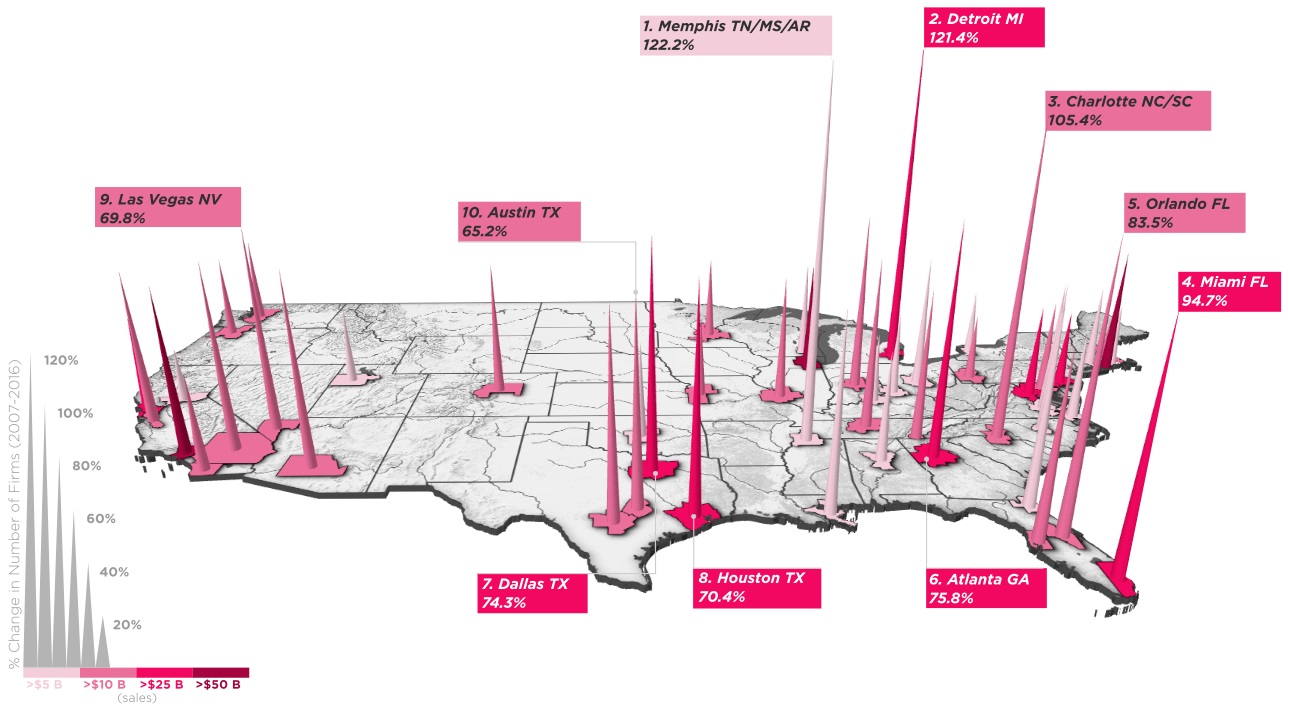
Today’s map from HowMuch.net shows the top American cities where business is booming for women entrepreneurs.
Where are Women-Owned Businesses Growing Fastest?
Looking at the percentage growth in women-owned businesses tells us a lot about the way local economies have developed in the past decade.
Though women-owned firms in larger cities may have more absolute growth and revenue, a high growth rate shows the rapid emergence of a business community where there may have not been one before.
| Rank | City | Growth as Percentage | Absolute Growth | Revenue ($ Billion) |
|---|---|---|---|---|
| 1 | Memphis | 122% | 47,798 | 6.1 |
| 2 | Detroit | 121.4% | 140,000 | 25.1 |
| 3 | Charlotte | 105.4% | 61,568 | 13.3 |
| 4 | Miami | 94.7% | 220,000 | 41.4 |
| 5 | Orlando | 83.5% | 72,930 | 12.3 |
| 6 | Atlanta | 75.8% | 133,000 | 36.9 |
| 7 | Dallas | 74.3% | 100,000 | 47.0 |
| 8 | Houston | 70.4% | 107,000 | 36.1 |
| 9 | Las Vegas | 69.8% | 44,341 | 10.4 |
| 10 | Austin | 65.2% | 41,413 | 10.3 |
Memphis’ women are leading the charge in the development of their city’s relatively small economy. Though the city is ranked only 45th in terms of revenue generation by women-owned firms, it’s adding new women-owned businesses at a very rapid pace.
The growth rate in Memphis of 122.2% between 2007-2016 leads the nation, making it one of only three cities (along with Charlotte and Detroit) where women-led business growth has more than doubled since 2007.
Absolute Growth Numbers
More metropolitan cities like New York or Los Angeles already have a bigger base of women entrepreneurs to start with, so their percentage growth is not high enough to show up on the aforementioned map.
However, it is worth looking at where the most women-owned businesses are being added (in absolute terms) as well:
| Rank | City | Absolute Growth | Growth as Percentage | Revenue ($ Billion) |
|---|---|---|---|---|
| 1 | New York City | 271,000 | 44.9% | 140.0 |
| 2 | Los Angeles | 225,000 | 55.0% | 95 |
| 3 | Miami | 220,000 | 94.7% | 41.4 |
| 4 | Detroit | 140,000 | 121.4% | 25.1 |
| 5 | Atlanta | 133,000 | 75.8% | 36.9 |
| 6 | Houston | 107,000 | 70.4% | 36.1 |
| 7 | Chicago | 105,500 | 39.0% | 50.0 |
| 8 | Dallas | 100,000 | 74.3% | 47.0 |
| 9 | Riverside | 60,000 | 62.8% | 19.9 |
| 10 | Washington, D.C. | 57,000 | 32.6% | 37.1 |
Interestingly enough, certain cities appear on both lists, showing impressive growth both in relative and absolute terms.
Detroit and Miami are fairly unique in that they make the top five on both lists. Detroit grew its women-owned businesses by 121.4%, or 140,000 in absolute terms. Meanwhile, Miami grew at 94.7% to add 220,000 businesses since 2007.
Houston and Atlanta are two other cities that fare very well on both lists.
Sponsored Infographics
The Money Project


Markets
The European Stock Market: Attractive Valuations Offer Opportunities
On average, the European stock market has valuations that are nearly 50% lower than U.S. valuations. But how can you access the market?


European Stock Market: Attractive Valuations Offer Opportunities
Europe is known for some established brands, from L’Oréal to Louis Vuitton. However, the European stock market offers additional opportunities that may be lesser known.
The above infographic, sponsored by STOXX, outlines why investors may want to consider European stocks.
Attractive Valuations
Compared to most North American and Asian markets, European stocks offer lower or comparable valuations.
| Index | Price-to-Earnings Ratio | Price-to-Book Ratio |
|---|---|---|
| EURO STOXX 50 | 14.9 | 2.2 |
| STOXX Europe 600 | 14.4 | 2 |
| U.S. | 25.9 | 4.7 |
| Canada | 16.1 | 1.8 |
| Japan | 15.4 | 1.6 |
| Asia Pacific ex. China | 17.1 | 1.8 |
Data as of February 29, 2024. See graphic for full index names. Ratios based on trailing 12 month financials. The price to earnings ratio excludes companies with negative earnings.
On average, European valuations are nearly 50% lower than U.S. valuations, potentially offering an affordable entry point for investors.
Research also shows that lower price ratios have historically led to higher long-term returns.
Market Movements Not Closely Connected
Over the last decade, the European stock market had low-to-moderate correlation with North American and Asian equities.
The below chart shows correlations from February 2014 to February 2024. A value closer to zero indicates low correlation, while a value of one would indicate that two regions are moving in perfect unison.
| EURO STOXX 50 | STOXX EUROPE 600 | U.S. | Canada | Japan | Asia Pacific ex. China |
|
|---|---|---|---|---|---|---|
| EURO STOXX 50 | 1.00 | 0.97 | 0.55 | 0.67 | 0.24 | 0.43 |
| STOXX EUROPE 600 | 1.00 | 0.56 | 0.71 | 0.28 | 0.48 | |
| U.S. | 1.00 | 0.73 | 0.12 | 0.25 | ||
| Canada | 1.00 | 0.22 | 0.40 | |||
| Japan | 1.00 | 0.88 | ||||
| Asia Pacific ex. China | 1.00 |
Data is based on daily USD returns.
European equities had relatively independent market movements from North American and Asian markets. One contributing factor could be the differing sector weights in each market. For instance, technology makes up a quarter of the U.S. market, but health care and industrials dominate the broader European market.
Ultimately, European equities can enhance portfolio diversification and have the potential to mitigate risk for investors.
Tracking the Market
For investors interested in European equities, STOXX offers a variety of flagship indices:
| Index | Description | Market Cap |
|---|---|---|
| STOXX Europe 600 | Pan-regional, broad market | €10.5T |
| STOXX Developed Europe | Pan-regional, broad-market | €9.9T |
| STOXX Europe 600 ESG-X | Pan-regional, broad market, sustainability focus | €9.7T |
| STOXX Europe 50 | Pan-regional, blue-chip | €5.1T |
| EURO STOXX 50 | Eurozone, blue-chip | €3.5T |
Data is as of February 29, 2024. Market cap is free float, which represents the shares that are readily available for public trading on stock exchanges.
The EURO STOXX 50 tracks the Eurozone’s biggest and most traded companies. It also underlies one of the world’s largest ranges of ETFs and mutual funds. As of November 2023, there were €27.3 billion in ETFs and €23.5B in mutual fund assets under management tracking the index.
“For the past 25 years, the EURO STOXX 50 has served as an accurate, reliable and tradable representation of the Eurozone equity market.”
— Axel Lomholt, General Manager at STOXX
Partnering with STOXX to Track the European Stock Market
Are you interested in European equities? STOXX can be a valuable partner:
- Comprehensive, liquid and investable ecosystem
- European heritage, global reach
- Highly sophisticated customization capabilities
- Open architecture approach to using data
- Close partnerships with clients
- Part of ISS STOXX and Deutsche Börse Group
With a full suite of indices, STOXX can help you benchmark against the European stock market.
Learn how STOXX’s European indices offer liquid and effective market access.

-

 Economy2 days ago
Economic Growth Forecasts for G7 and BRICS Countries in 2024
The IMF has released its economic growth forecasts for 2024. How do the G7 and BRICS countries compare?
-

 Markets1 week ago
U.S. Debt Interest Payments Reach $1 Trillion
U.S. debt interest payments have surged past the $1 trillion dollar mark, amid high interest rates and an ever-expanding debt burden.
-

 United States2 weeks ago
Ranked: The Largest U.S. Corporations by Number of Employees
We visualized the top U.S. companies by employees, revealing the massive scale of retailers like Walmart, Target, and Home Depot.
-

 Markets2 weeks ago
The Top 10 States by Real GDP Growth in 2023
This graphic shows the states with the highest real GDP growth rate in 2023, largely propelled by the oil and gas boom.
-

 Markets2 weeks ago
Ranked: The World’s Top Flight Routes, by Revenue
In this graphic, we show the highest earning flight routes globally as air travel continued to rebound in 2023.
-

 Markets2 weeks ago
Ranked: The Most Valuable Housing Markets in America
The U.S. residential real estate market is worth a staggering $47.5 trillion. Here are the most valuable housing markets in the country.


-

 Mining1 week ago
Gold vs. S&P 500: Which Has Grown More Over Five Years?
-
Markets2 weeks ago
Ranked: The Most Valuable Housing Markets in America
-

 Money2 weeks ago
Which States Have the Highest Minimum Wage in America?
-

 AI2 weeks ago
Ranked: Semiconductor Companies by Industry Revenue Share
-
Markets2 weeks ago
Ranked: The World’s Top Flight Routes, by Revenue
-

 Demographics2 weeks ago
Population Projections: The World’s 6 Largest Countries in 2075
-
Markets2 weeks ago
The Top 10 States by Real GDP Growth in 2023
-

 Demographics2 weeks ago
The Smallest Gender Wage Gaps in OECD Countries