Economy
The Top 10 Biggest Companies in Brazil
The Top 10 Biggest Companies in Brazil
In 2009, the at-the-time emerging economies of Brazil, Russia, India, and China held their first formal summits as members of BRIC (with South Africa joining in 2010).
Together, BRICS represents 26.7% of the world’s land surface and 41.5% of its population. By GDP ranking, they’re also some of the most powerful economies in the world.
But what drives their economies? We’re highlighting the top 10 biggest companies in each country, starting with Brazil.
What Are the Biggest Public Companies in Brazil?
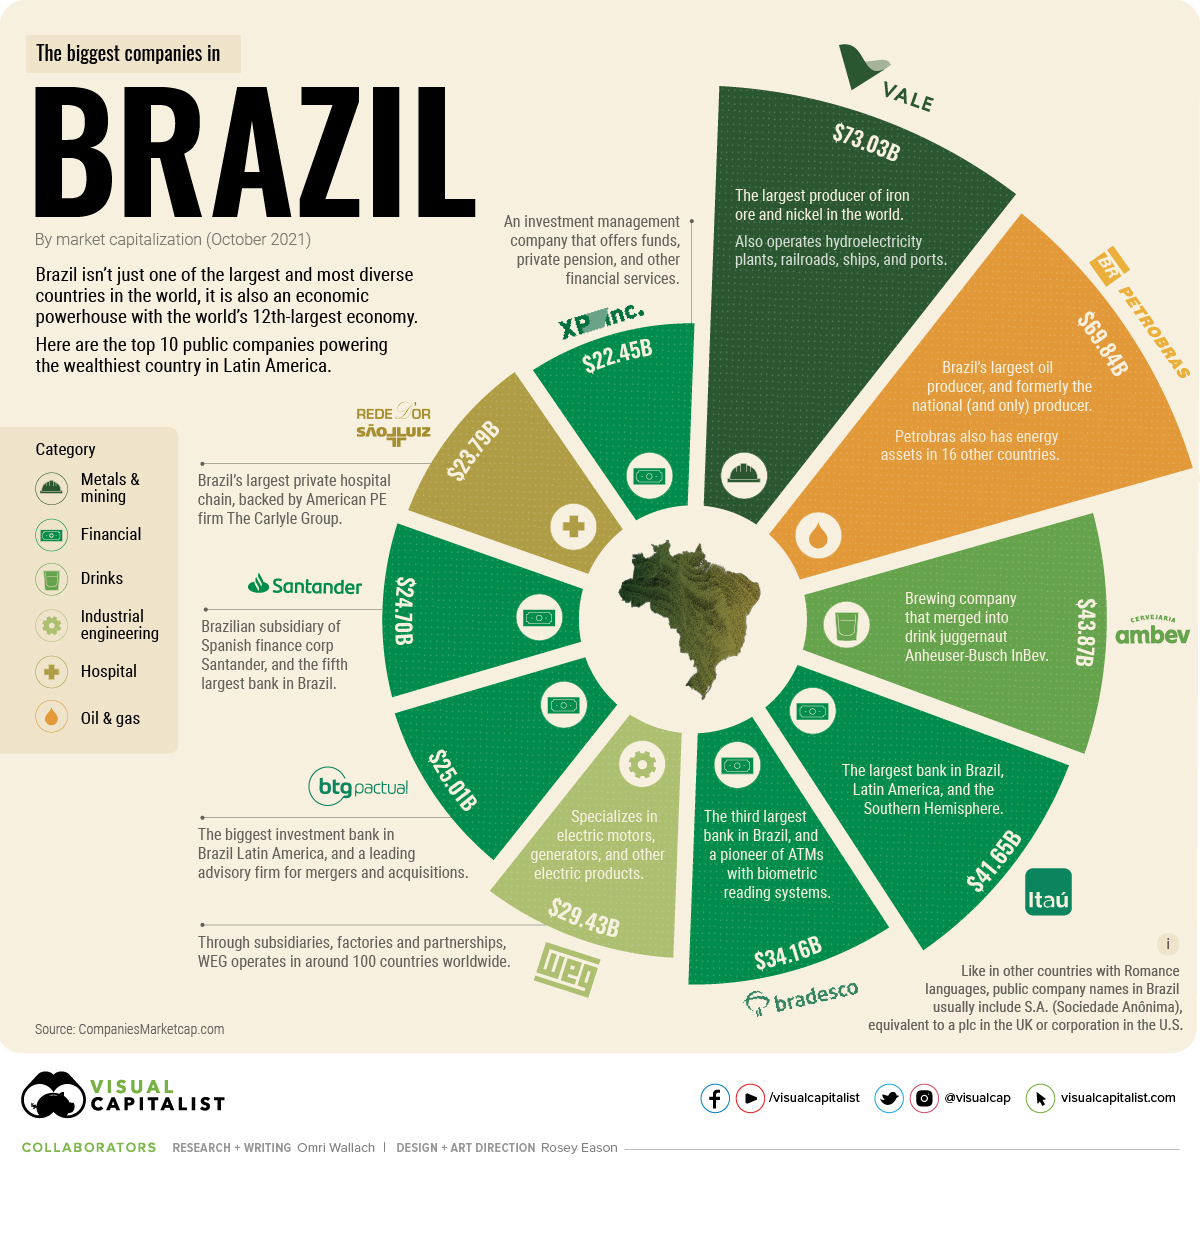
Brazil isn’t just one of the largest and most diverse countries in the world, it is also an economic powerhouse.
With over 213 million people, Brazil is the sixth most populous country on Earth and the largest in Latin America. It’s also the wealthiest on the continent, with the world’s 12th-largest economy.
Once a colony focused on sugar and gold, Brazil rapidly industrialized in the 20th century. Today, it is a top 10 exporter of industrial steel, with the country’s economic strength coming chiefly from natural resources and financials.
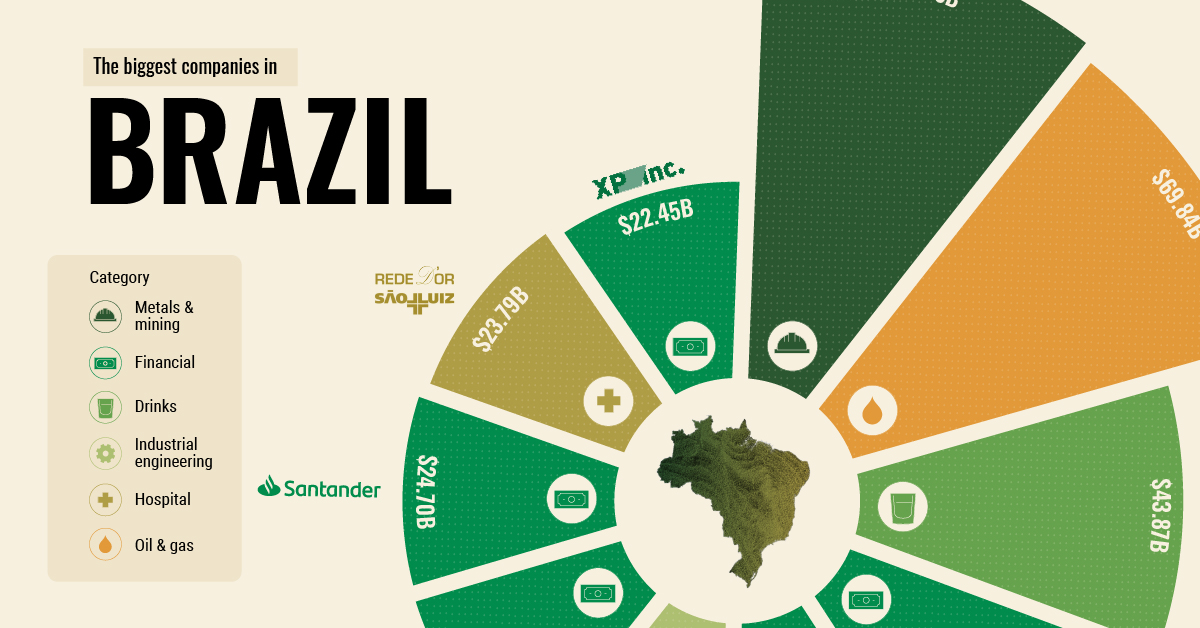
Here are Brazil’s biggest public companies by market capitalization in October 2021:
| Top 10 Companies (October 2021) | Category | Market Cap (USD) |
|---|---|---|
| Vale | Metals and Mining | $73.03B |
| Petróleo Brasileiro | Oil and Gas | $69.84B |
| Ambev | Drinks | $43.87B |
| Itaú Unibanco | Financial | $41.65B |
| Banco Bradesco | Financial | $34.16B |
| WEG | Industrial Engineering | $29.43B |
| BTG Pactual | Financial | $25.01B |
| Banco Santander Brasil | Financial | $24.70B |
| Rede D’Or Sao Luiz | Hospital | $23.79B |
| XP Inc. | Financial | $22.45B |
At the top of the ranking is Vale, a metals and mining giant that is the world’s largest producer of iron ore and nickel. Also the operator of infrastructure including hydroelectricity plants, railroads, and ports, It consistently ranks as the most valuable company in Latin America.
Vale and second-ranking company Petróleo Brasileiro, Brazil’s largest oil producer, were former state-owned corporations that became privatized in the 1990s.
Finance in Brazil’s Top 10 Biggest Companies
Other than former monopolies, the top 10 biggest companies in Brazil highlight the power of the banking sector.
Five of the 10 companies with a market cap above $20 billion are in the financial industry.
They include Itaú Unibanco, the largest bank in the Southern Hemisphere, and Banco Santander Brasil, the Brazilian subsidiary of Spanish finance corp.
Another well-known subsidiary is brewing company Ambev, which produces the majority of the country’s liquors and also bottles and distributes PepsiCo products in much of Latin America. Ambev is an important piece of Belgian drink juggernaut Anheuser-Busch InBev, which is one of the world’s largest 100 companies.
Noticeably missing from the top 10 list are companies in the agriculture sector, as Brazil is the world’s largest exporter of coffee, soybeans, beef, and ethanol. Many multinational corporations have Brazilian subsidiaries or partners for supply chain access, which has recently put a spotlight on Amazon deforestation.
What other companies or industries do you associate with Brazil?
Correction: Two companies listed had errors in their market cap calculations and have been updated. All data is as of October 11, 2021.


Markets
Mapped: Europe’s GDP Per Capita, by Country
Which European economies are richest on a GDP per capita basis? This map shows the results for 44 countries across the continent.


Mapped: Europe’s GDP Per Capita, by Country (2024)
This was originally posted on our Voronoi app. Download the app for free on iOS or Android and discover incredible data-driven charts from a variety of trusted sources.
Europe is home to some of the largest and most sophisticated economies in the world. But how do countries in the region compare with each other on a per capita productivity basis?
In this map, we show Europe’s GDP per capita levels across 44 nations in current U.S. dollars. Data for this visualization and article is sourced from the International Monetary Fund (IMF) via their DataMapper tool, updated April 2024.
Europe’s Richest and Poorest Nations, By GDP Per Capita
Luxembourg, Ireland, and Switzerland, lead the list of Europe’s richest nations by GDP per capita, all above $100,000.
| Rank | Country | GDP Per Capita (2024) |
|---|---|---|
| 1 | 🇱🇺 Luxembourg | $131,380 |
| 2 | 🇮🇪 Ireland | $106,060 |
| 3 | 🇨🇭 Switzerland | $105,670 |
| 4 | 🇳🇴 Norway | $94,660 |
| 5 | 🇮🇸 Iceland | $84,590 |
| 6 | 🇩🇰 Denmark | $68,900 |
| 7 | 🇳🇱 Netherlands | $63,750 |
| 8 | 🇸🇲 San Marino | $59,410 |
| 9 | 🇦🇹 Austria | $59,230 |
| 10 | 🇸🇪 Sweden | $58,530 |
| 11 | 🇧🇪 Belgium | $55,540 |
| 12 | 🇫🇮 Finland | $55,130 |
| 13 | 🇩🇪 Germany | $54,290 |
| 14 | 🇬🇧 UK | $51,070 |
| 15 | 🇫🇷 France | $47,360 |
| 16 | 🇦🇩 Andorra | $44,900 |
| 17 | 🇲🇹 Malta | $41,740 |
| 18 | 🇮🇹 Italy | $39,580 |
| 19 | 🇨🇾 Cyprus | $37,150 |
| 20 | 🇪🇸 Spain | $34,050 |
| 21 | 🇸🇮 Slovenia | $34,030 |
| 22 | 🇪🇪 Estonia | $31,850 |
| 23 | 🇨🇿 Czech Republic | $29,800 |
| 24 | 🇵🇹 Portugal | $28,970 |
| 25 | 🇱🇹 Lithuania | $28,410 |
| 26 | 🇸🇰 Slovakia | $25,930 |
| 27 | 🇱🇻 Latvia | $24,190 |
| 28 | 🇬🇷 Greece | $23,970 |
| 29 | 🇭🇺 Hungary | $23,320 |
| 30 | 🇵🇱 Poland | $23,010 |
| 31 | 🇭🇷 Croatia | $22,970 |
| 32 | 🇷🇴 Romania | $19,530 |
| 33 | 🇧🇬 Bulgaria | $16,940 |
| 34 | 🇷🇺 Russia | $14,390 |
| 35 | 🇹🇷 Türkiye | $12,760 |
| 36 | 🇲🇪 Montenegro | $12,650 |
| 37 | 🇷🇸 Serbia | $12,380 |
| 38 | 🇦🇱 Albania | $8,920 |
| 39 | 🇧🇦 Bosnia & Herzegovina | $8,420 |
| 40 | 🇲🇰 North Macedonia | $7,690 |
| 41 | 🇧🇾 Belarus | $7,560 |
| 42 | 🇲🇩 Moldova | $7,490 |
| 43 | 🇽🇰 Kosovo | $6,390 |
| 44 | 🇺🇦 Ukraine | $5,660 |
| N/A | 🇪🇺 EU Average | $44,200 |
Note: Figures are rounded.
Three Nordic countries (Norway, Iceland, Denmark) also place highly, between $70,000-90,000. Other Nordic peers, Sweden and Finland rank just outside the top 10, between $55,000-60,000.
Meanwhile, Europe’s biggest economies in absolute terms, Germany, UK, and France, rank closer to the middle of the top 20, with GDP per capitas around $50,000.
Finally, at the end of the scale, Eastern Europe as a whole tends to have much lower per capita GDPs. In that group, Ukraine ranks last, at $5,660.
A Closer Look at Ukraine
For a broader comparison, Ukraine’s per capita GDP is similar to Iran ($5,310), El Salvador ($5,540), and Guatemala ($5,680).
According to experts, Ukraine’s economy has historically underperformed to expectations. After the fall of the Berlin Wall, the economy contracted for five straight years. Its transition to a Western, liberalized economic structure was overshadowed by widespread corruption, a limited taxpool, and few revenue sources.
Politically, its transformation from authoritarian regime to civil democracy has proved difficult, especially when it comes to institution building.
Finally, after the 2022 invasion of the country, Ukraine’s GDP contracted by 30% in a single year—the largest loss since independence. Large scale emigration—to the tune of six million refugees—is also playing a role.
Despite these challenges, the country’s economic growth has somewhat stabilized while fighting continues.

-

 Markets6 days ago
The Most Valuable Companies in Major EU Economies
-

 Wealth2 weeks ago
Charted: Which City Has the Most Billionaires in 2024?
-

 Technology2 weeks ago
All of the Grants Given by the U.S. CHIPS Act
-

 Green2 weeks ago
The Carbon Footprint of Major Travel Methods
-

 United States1 week ago
Visualizing the Most Common Pets in the U.S.
-

 Culture1 week ago
The World’s Top Media Franchises by All-Time Revenue
-

 voronoi1 week ago
Best Visualizations of April on the Voronoi App
-

 Wealth1 week ago
Charted: Which Country Has the Most Billionaires in 2024?