Markets
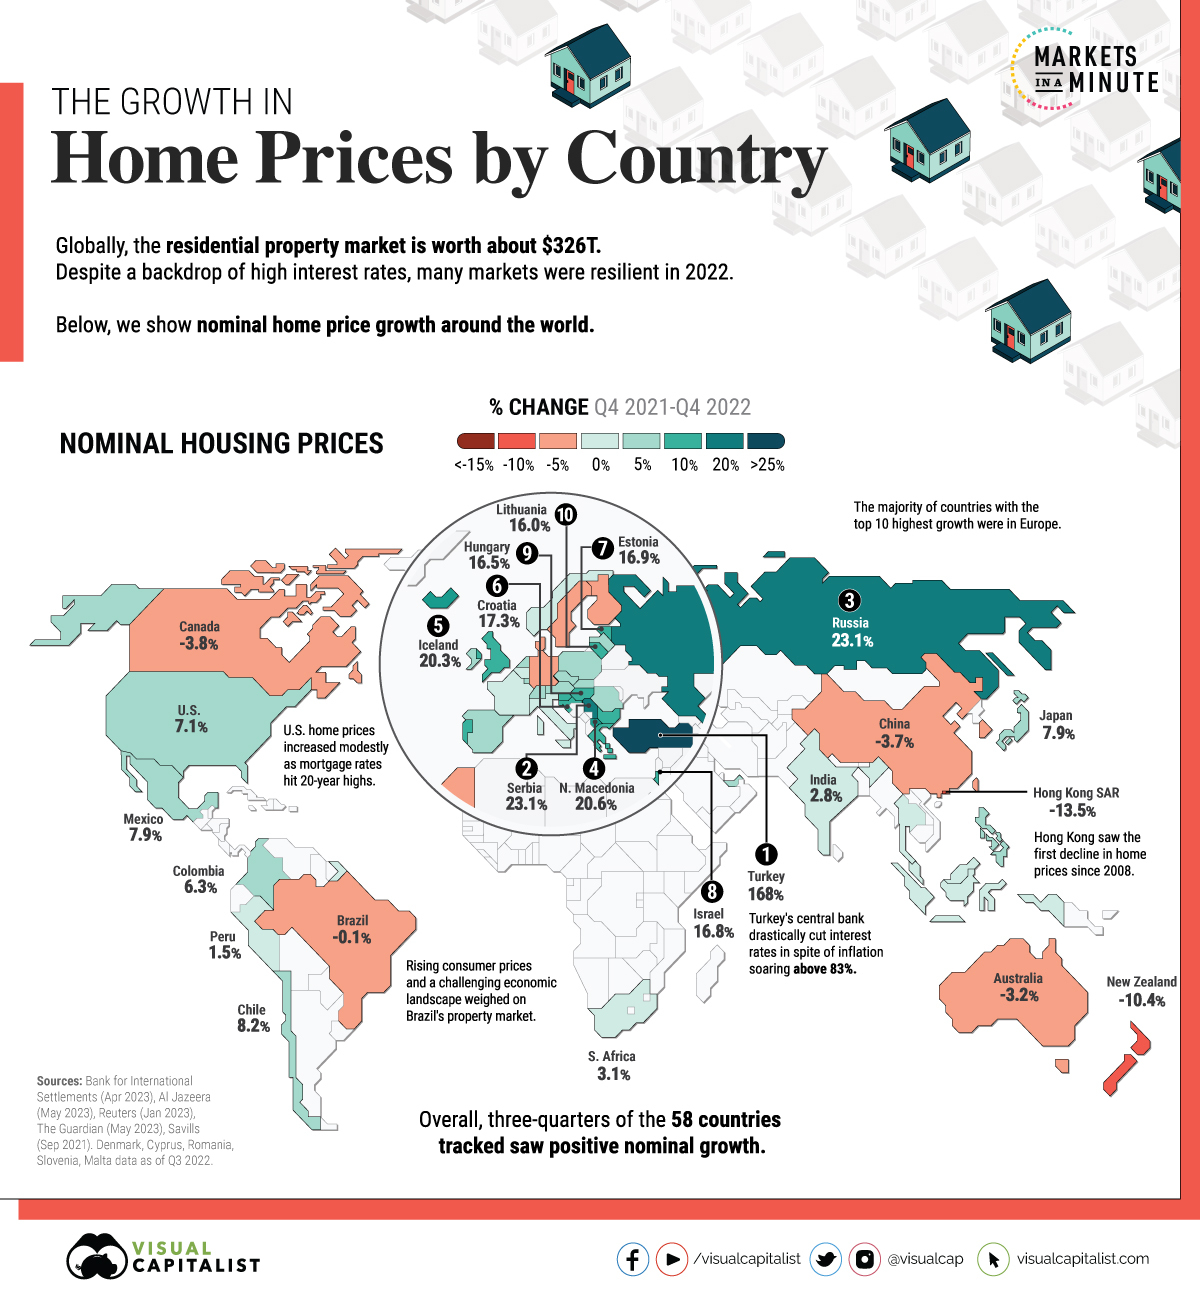
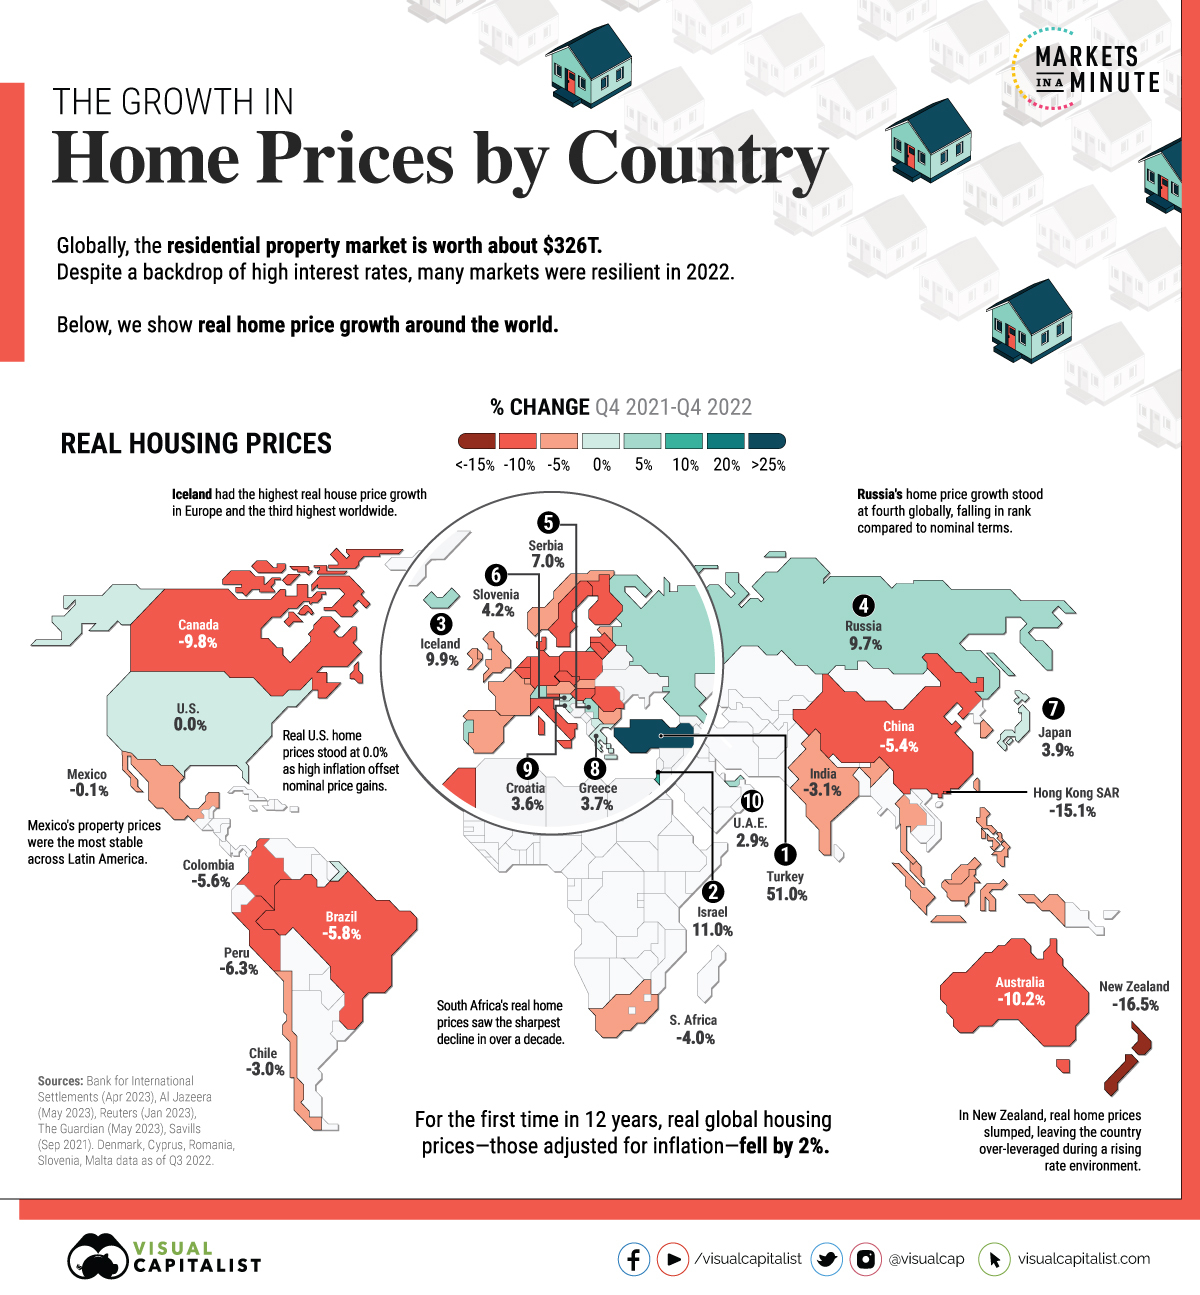
Mapped: The Growth in House Prices by Country
The following slider shows both nominal and real housing prices by country. Use slider arrows to navigate.

Mapped: The Growth in House Prices by Country
This was originally posted on Advisor Channel. Sign up to the free mailing list to get beautiful visualizations on financial markets that help advisors and their clients.
Global housing prices rose an average of 6% annually, between Q4 2021 and Q4 2022.
In real terms that take inflation into account, prices actually fell 2% for the first decline in 12 years. Despite a surge in interest rates and mortgage costs, housing markets were noticeably stable. Real prices remain 7% above pre-pandemic levels.
In this graphic, we show the change in residential property prices with data from the Bank for International Settlements (BIS).
The Growth in House Prices, Ranked
The following dataset from the BIS covers nominal and real house price growth across 58 countries and regions as of the fourth quarter of 2022:
| Price Growth Rank | Country / Region | Nominal Year-over-Year Change (%) | Real Year-over-Year Change (%) |
|---|---|---|---|
| 1 | 🇹🇷 Türkiye | 167.9 | 51.0 |
| 2 | 🇷🇸 Serbia | 23.1 | 7.0 |
| 3 | 🇷🇺 Russia | 23.1 | 9.7 |
| 4 | 🇲🇰 North Macedonia | 20.6 | 1.0 |
| 5 | 🇮🇸 Iceland | 20.3 | 9.9 |
| 6 | 🇭🇷 Croatia | 17.3 | 3.6 |
| 7 | 🇪🇪 Estonia | 16.9 | -3.0 |
| 8 | 🇮🇱 Israel | 16.8 | 11.0 |
| 9 | 🇭🇺 Hungary | 16.5 | -5.1 |
| 10 | 🇱🇹 Lithuania | 16.0 | -5.5 |
| 11 | 🇸🇮 Slovenia | 15.4 | 4.2 |
| 12 | 🇧🇬 Bulgaria | 13.4 | -3.2 |
| 13 | 🇬🇷 Greece | 12.2 | 3.7 |
| 14 | 🇵🇹 Portugal | 11.3 | 1.3 |
| 15 | 🇬🇧 United Kingdom | 10.0 | -0.7 |
| 16 | 🇸🇰 Slovak Republic | 9.7 | -4.8 |
| 17 | 🇦🇪 United Arab Emirates | 9.6 | 2.9 |
| 18 | 🇵🇱 Poland | 9.3 | -6.9 |
| 19 | 🇱🇻 Latvia | 9.1 | -10.2 |
| 20 | 🇸🇬 Singapore | 8.6 | 1.9 |
| 21 | 🇮🇪 Ireland | 8.6 | -0.2 |
| 22 | 🇨🇱 Chile | 8.2 | -3.0 |
| 23 | 🇯🇵 Japan | 7.9 | 3.9 |
| 24 | 🇲🇽 Mexico | 7.9 | -0.1 |
| 25 | 🇵🇭 Philippines | 7.7 | -0.2 |
| 26 | 🇺🇸 United States | 7.1 | 0.0 |
| 27 | 🇨🇿 Czechia | 6.9 | -7.6 |
| 28 | 🇷🇴 Romania | 6.7 | -7.5 |
| 29 | 🇲🇹 Malta | 6.3 | -0.7 |
| 30 | 🇨🇾 Cyprus | 6.3 | -2.9 |
| 31 | 🇨🇴 Colombia | 6.3 | -5.6 |
| 32 | 🇱🇺 Luxembourg | 5.6 | -0.5 |
| 33 | 🇪🇸 Spain | 5.5 | -1.1 |
| 34 | 🇨🇭 Switzerland | 5.4 | 2.4 |
| 35 | 🇳🇱 Netherlands | 5.4 | -5.3 |
| 36 | 🇦🇹 Austria | 5.2 | -4.8 |
| 37 | 🇫🇷 France | 4.8 | -1.2 |
| 38 | 🇧🇪 Belgium | 4.7 | -5.7 |
| 39 | 🇹🇭 Thailand | 4.7 | -1.1 |
| 40 | 🇿🇦 South Africa | 3.1 | -4.0 |
| 41 | 🇮🇳 India | 2.8 | -3.1 |
| 42 | 🇮🇹 Italy | 2.8 | -8.0 |
| 43 | 🇳🇴 Norway | 2.6 | -3.8 |
| 44 | 🇮🇩 Indonesia | 2.0 | -3.4 |
| 45 | 🇵🇪 Peru | 1.5 | -6.3 |
| 46 | 🇲🇾 Malaysia | 1.2 | -2.6 |
| 47 | 🇰🇷 South Korea | -0.1 | -5.0 |
| 48 | 🇲🇦 Morocco | -0.1 | -7.7 |
| 49 | 🇧🇷 Brazil | -0.1 | -5.8 |
| 50 | 🇫🇮 Finland | -2.3 | -10.2 |
| 51 | 🇩🇰 Denmark | -2.4 | -10.6 |
| 52 | 🇦🇺 Australia | -3.2 | -10.2 |
| 53 | 🇩🇪 Germany | -3.6 | -12.1 |
| 54 | 🇸🇪 Sweden | -3.7 | -13.7 |
| 55 | 🇨🇳 China | -3.7 | -5.4 |
| 56 | 🇨🇦 Canada | -3.8 | -9.8 |
| 57 | 🇳🇿 New Zealand | -10.4 | -16.5 |
| 58 | 🇭🇰 Hong Kong SAR | -13.5 | -15.1 |
Türkiye’s property prices jumped the highest globally, at nearly 168% amid soaring inflation.
Real estate demand has increased alongside declining interest rates. The government drastically cut interest rates from 19% in late 2021 to 8.5% to support a weakening economy.
Many European countries saw some of the highest price growth in nominal terms. A strong labor market and low interest rates pushed up prices, even as mortgage rates broadly doubled across the continent. For real price growth, most countries were in negative territory—notably Sweden, Germany, and Denmark.
Nominal U.S. housing prices grew just over 7%, while real price growth halted to 0%. Prices have remained elevated given the stubbornly low supply of inventory. In fact, residential prices remain 45% above pre-pandemic levels.
How Do Interest Rates Impact Property Markets?
Global house prices boomed during the pandemic as central banks cut interest rates to prop up economies.
Now, rates have returned to levels last seen before the Global Financial Crisis. On average, rates have increased four percentage points in many major economies. Roughly three-quarters of the countries in the BIS dataset witnessed negative year-over-year real house price growth as of the fourth quarter of 2022.
Interest rates have a large impact on property prices. Cross-country evidence shows that for every one percentage point increase in real interest rates, the growth rate of housing prices tends to fall by about two percentage points.
When Will Housing Prices Fall?
The rise in U.S. interest rates has been counteracted by homeowners being reluctant to sell so they can keep their low mortgage rates. As a result, it is keeping inventory low and prices high. Homeowners can’t sell and keep their low mortgage rates unless they meet strict conditions on a new property.
Additionally, several other factors impact price dynamics. Construction costs, income growth, labor shortages, and population growth all play a role.
With a strong labor market continuing through 2023, stable incomes may help stave off prices from falling. On the other hand, buyers with floating-rate mortgages face steeper costs and may be unable to afford new rates. This could increase housing supply in the market, potentially leading to lower prices.


Markets
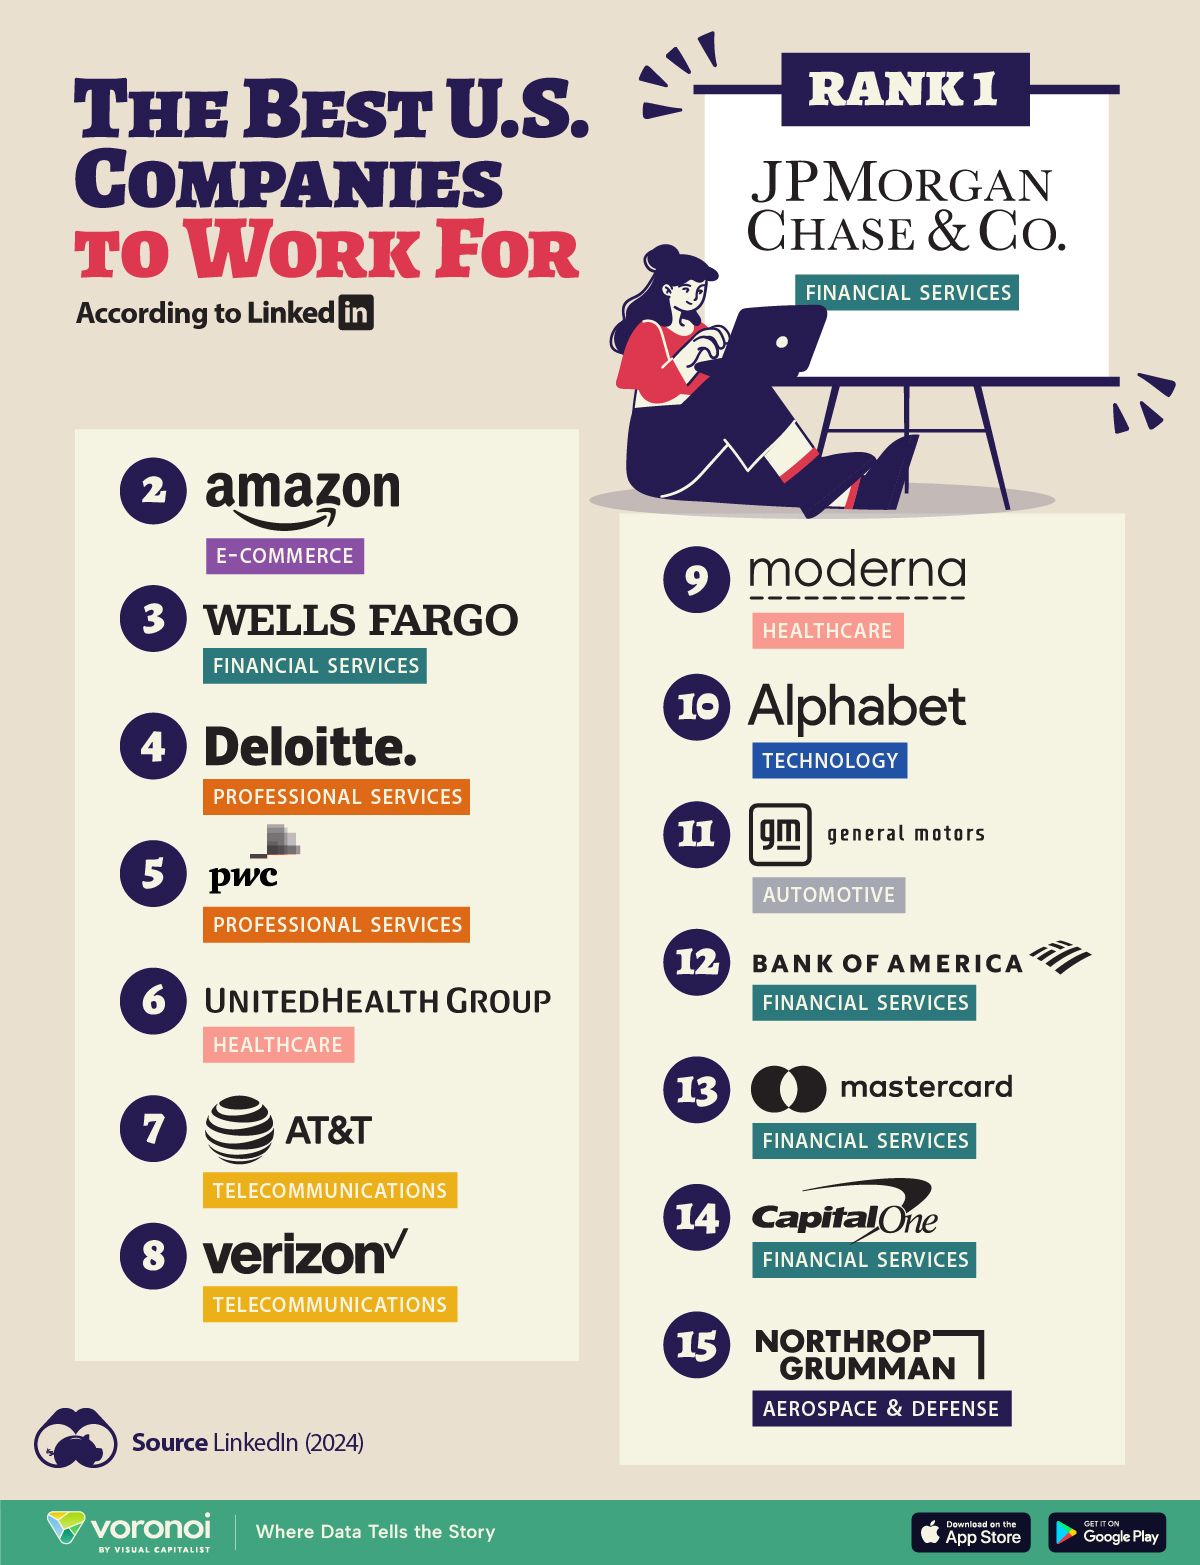
The Best U.S. Companies to Work for According to LinkedIn
We visualized the results of a LinkedIn study on the best U.S. companies to work for in 2024.
The Best U.S. Companies to Work for According to LinkedIn
This was originally posted on our Voronoi app. Download the app for free on iOS or Android and discover incredible data-driven charts from a variety of trusted sources.
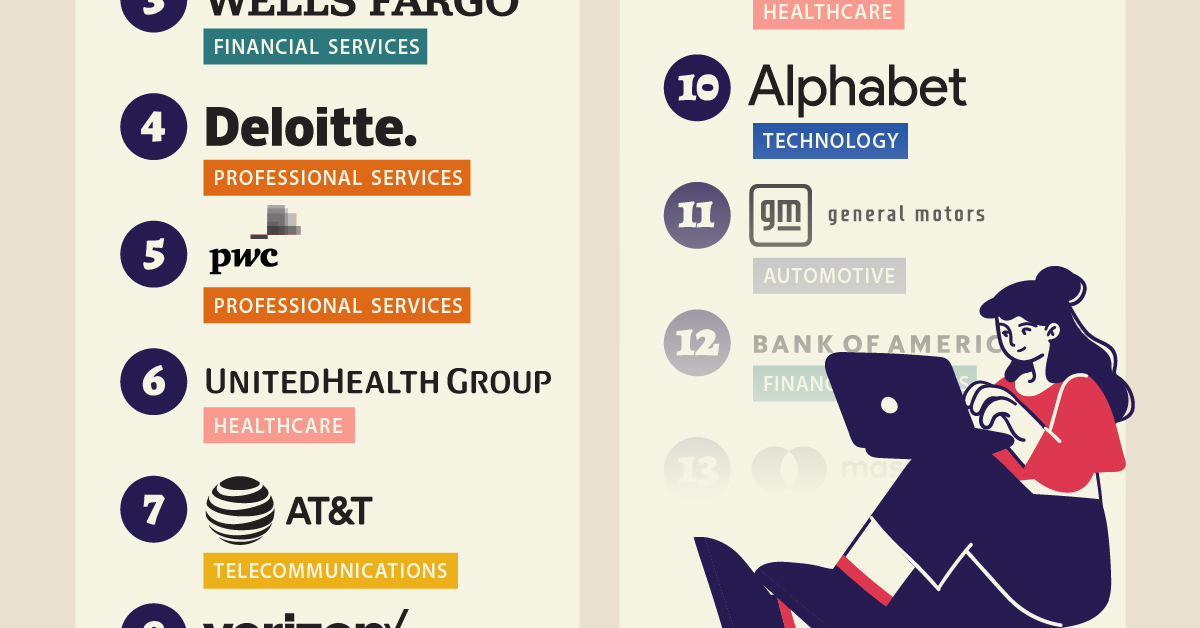
In this graphic, we list the 15 best U.S. companies to work for in 2024, according to LinkedIn data.
LinkedIn ranked companies based on eight pillars: ability to advance, skills growth, company stability, external opportunity, company affinity, gender diversity, educational background, and employee presence in the country.
To be eligible, companies must have had 5,000 or more global employees, with at least 500 in the country as of December 31, 2023.
Data and Highlights
Financial institutions dominate the ranking of the best U.S. companies to work for in 2024, with JP Morgan Chase & Co. ranking first.
| Rank | Company | Industry |
|---|---|---|
| 1 | JP Morgan Chase & Co. | Financial Services |
| 2 | Amazon | E-commerce |
| 3 | Wells Fargo | Financial Services |
| 4 | Deloitte | Professional Services |
| 5 | PwC | Professional Services |
| 6 | UnitedHealth Group | Healthcare |
| 7 | AT&T | Telecommunications |
| 8 | Verizon | Telecommunications |
| 9 | Moderna | Pharmaceuticals |
| 10 | Alphabet Inc. | Technology |
| 11 | General Motors | Automotive |
| 12 | Bank of America | Financial Services |
| 13 | Mastercard | Financial Services |
| 14 | Capital One | Financial Services |
| 15 | Northrop Grumman | Aerospace & Defense |
J.P. Morgan has a program that offers opportunities for candidates without a university degree. In fact, in 2022, 75% of job descriptions at the bank for experienced hires did not require a college degree.
Meanwhile, Deloitte and Amazon offer a variety of free training courses, including in AI.
Moderna includes in its employee package benefits to help avoid employee burnout — from subsidized commuter expenses and pop-up daycare centers, to wellness coaches.
Mastercard offers flexible work availability, with 11.5% remote and 89% hybrid options.
It’s also interesting to note that only Amazon and Alphabet made the cut from the ‘Magnificent Seven’ companies (Apple, Microsoft, Google parent Alphabet, Amazon, Nvidia, Meta Platforms, and Tesla).
See more about the best companies to work for in this infographic, which covers a separate ranking from Glassdoor.

-

 VC+7 days ago
VC+: Get Our Key Takeaways From the IMF’s World Economic Outlook
-

 Maps2 weeks ago
The Largest Earthquakes in the New York Area (1970-2024)
-

 Green2 weeks ago
Ranked: The Countries With the Most Air Pollution in 2023
-

 Green2 weeks ago
Ranking the Top 15 Countries by Carbon Tax Revenue
-

 Markets2 weeks ago
U.S. Debt Interest Payments Reach $1 Trillion
-

 Mining2 weeks ago
Gold vs. S&P 500: Which Has Grown More Over Five Years?
-

 Energy2 weeks ago
The World’s Biggest Nuclear Energy Producers
-

 Misc2 weeks ago
How Hard Is It to Get Into an Ivy League School?