Markets
The Anatomy of the $2 Trillion COVID-19 Stimulus Bill
The Anatomy of the $2 Trillion COVID-19 Stimulus Bill
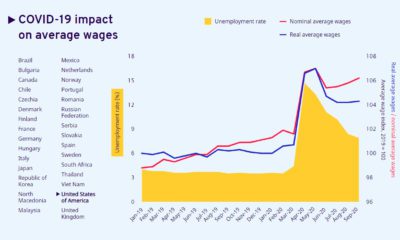
The unprecedented response to the COVID-19 pandemic has prioritized keeping people apart to slow the spread of the virus. While measures such as business closures and travel restrictions are effective at fighting a pandemic, they also have a dramatic impact on the economy.
To help right the ship, the Coronavirus Aid, Relief, and Economic Security Act — also known as the CARES Act — was passed by U.S. lawmakers last week with little fanfare. The act became the largest economic stimulus bill in modern history, more than doubling the stimulus act passed in 2009 during the Financial Crisis.
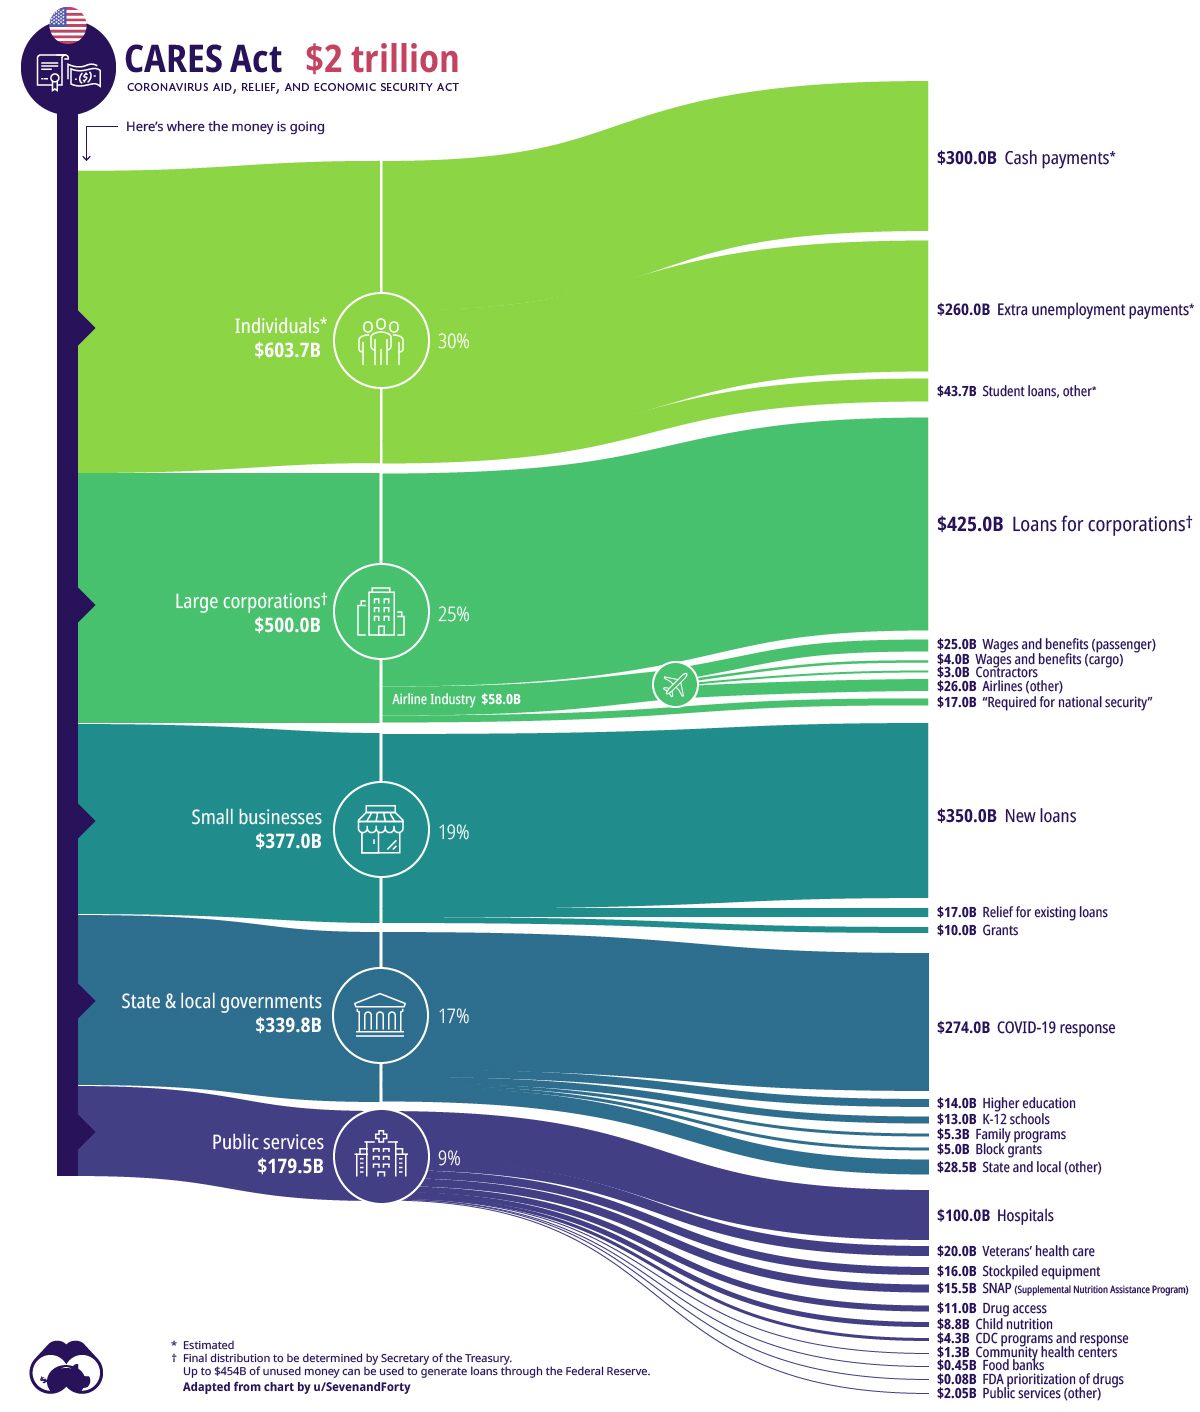
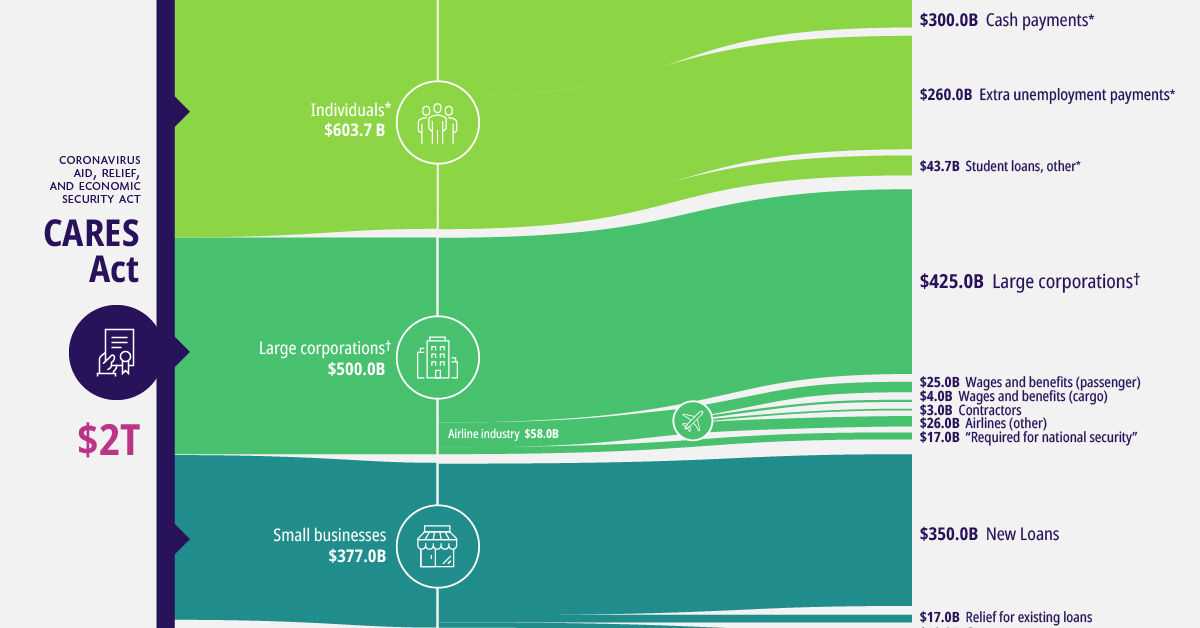
Today’s Sankey diagram is a visual representation of where the $2 trillion will be spent. Broadly speaking, there are five components to the COVID-19 stimulus bill:
| Category | Total Amount | Share of the Package |
|---|---|---|
| Individuals / Families | $603.7 billion | 30% |
| Big Business | $500.0 billion | 25% |
| Small Business | $377.0 billion | 19% |
| State and Local Government | $340.0 billion | 17% |
| Public Services | $179.5 billion | 9% |
Although the COVID-19 stimulus bill is incredibly complex, here are some of the most important parts to be aware of.
Funds for Individuals
Amount: $603.7 billion – 30% of total CARES Act
In order to stimulate the sputtering economy quickly, the U.S. government will deploy “helicopter money” — direct cash payments to individuals and families.
The centerpiece of this plan is a $1,200 direct payment for those earning up to $75,000 per year. For higher earners, payment amounts will phase out, ending altogether at the $99,000 income level. Families will also receive $500 per child.
There are three other key things to know about this portion of the stimulus funds:
- There will be a temporary suspension for any student loan held by the federal government. This means no payments required and no interest accrued until the end of September, 2020.
- Borrowers with federally backed loans can request forbearance on mortgage payments for up to six months.
- There will be an expansion of unemployment benefits, including a four-month enhancement of benefits. This plan includes freelancers, workers in the gig economy, and furloughed employees.
Big Business
Amount: $500.0 billion – 25% of total CARES Act
This component of the package is aimed at stabilizing big businesses in hard-hit sectors.
The most obvious industry to receive support will be the airlines. About $58 billion has been earmarked for commercial and cargo airlines, as well as airline contractors. Perhaps in response to recent criticism of the industry, companies receiving stimulus money will be barred from engaging in stock buybacks for the term of the loan plus one year.
One interesting pathway highlighted by today’s Sankey diagram is the $17 billion allocated to “maintaining national security”. While this provision doesn’t mention any specific company by name, the primary recipient is believed to be Boeing.
The bill also indicates that an inspector general will oversee the recovery process, along with a special committee.
Small Business
Amount: $377.0 billion – 19% of total CARES Act
To ease the strain on businesses around the country, the Small Business Administration (SBA) will be given $350 billion to provide loans of up to $10 million to qualifying organizations. These funds can be used for mission critical activities, such as paying rent or keeping employees on the payroll during COVID-19 closures.
As well, the bill sets aside $10 billion in grants for small businesses that need help covering short-term operating costs.
State and Local Governments
Amount: $340.0 billion – 17% of total CARES Act
The biggest portion of funds going to local and state governments is the $274 billion allocated towards direct COVID-19 response. The rest of the funds in this component will go to schools and child care services.
Public and Health Services
Amount: $179.5 billion – 9% of total CARES Act
The biggest slice of this pie goes to healthcare providers, who will receive $100 billion in grants to help fight COVID-19. This was a major ask from groups representing the healthcare industry, as they look to make up the lost revenue caused by focusing on the outbreak — as opposed to performing elective surgeries and other procedures. There will also be a 20% increase in Medicare payments for treating patients with the virus.
Money is also set aside for initiatives such as increasing the availability of ventilators and masks for the Strategic National Stockpile, as well as providing additional funding for the Center for Disease Control and expanding the reach of virtual doctors.
Finally, beyond the healthcare-related funding, the CARES Act also addresses food security programs and a long list of educational and arts initiatives.
Hat tip to Reddit user SevenandForty for inspiring this graphic.


Markets
The European Stock Market: Attractive Valuations Offer Opportunities
On average, the European stock market has valuations that are nearly 50% lower than U.S. valuations. But how can you access the market?


European Stock Market: Attractive Valuations Offer Opportunities
Europe is known for some established brands, from L’Oréal to Louis Vuitton. However, the European stock market offers additional opportunities that may be lesser known.
The above infographic, sponsored by STOXX, outlines why investors may want to consider European stocks.
Attractive Valuations
Compared to most North American and Asian markets, European stocks offer lower or comparable valuations.
| Index | Price-to-Earnings Ratio | Price-to-Book Ratio |
|---|---|---|
| EURO STOXX 50 | 14.9 | 2.2 |
| STOXX Europe 600 | 14.4 | 2 |
| U.S. | 25.9 | 4.7 |
| Canada | 16.1 | 1.8 |
| Japan | 15.4 | 1.6 |
| Asia Pacific ex. China | 17.1 | 1.8 |
Data as of February 29, 2024. See graphic for full index names. Ratios based on trailing 12 month financials. The price to earnings ratio excludes companies with negative earnings.
On average, European valuations are nearly 50% lower than U.S. valuations, potentially offering an affordable entry point for investors.
Research also shows that lower price ratios have historically led to higher long-term returns.
Market Movements Not Closely Connected
Over the last decade, the European stock market had low-to-moderate correlation with North American and Asian equities.
The below chart shows correlations from February 2014 to February 2024. A value closer to zero indicates low correlation, while a value of one would indicate that two regions are moving in perfect unison.
| EURO STOXX 50 | STOXX EUROPE 600 | U.S. | Canada | Japan | Asia Pacific ex. China |
|
|---|---|---|---|---|---|---|
| EURO STOXX 50 | 1.00 | 0.97 | 0.55 | 0.67 | 0.24 | 0.43 |
| STOXX EUROPE 600 | 1.00 | 0.56 | 0.71 | 0.28 | 0.48 | |
| U.S. | 1.00 | 0.73 | 0.12 | 0.25 | ||
| Canada | 1.00 | 0.22 | 0.40 | |||
| Japan | 1.00 | 0.88 | ||||
| Asia Pacific ex. China | 1.00 |
Data is based on daily USD returns.
European equities had relatively independent market movements from North American and Asian markets. One contributing factor could be the differing sector weights in each market. For instance, technology makes up a quarter of the U.S. market, but health care and industrials dominate the broader European market.
Ultimately, European equities can enhance portfolio diversification and have the potential to mitigate risk for investors.
Tracking the Market
For investors interested in European equities, STOXX offers a variety of flagship indices:
| Index | Description | Market Cap |
|---|---|---|
| STOXX Europe 600 | Pan-regional, broad market | €10.5T |
| STOXX Developed Europe | Pan-regional, broad-market | €9.9T |
| STOXX Europe 600 ESG-X | Pan-regional, broad market, sustainability focus | €9.7T |
| STOXX Europe 50 | Pan-regional, blue-chip | €5.1T |
| EURO STOXX 50 | Eurozone, blue-chip | €3.5T |
Data is as of February 29, 2024. Market cap is free float, which represents the shares that are readily available for public trading on stock exchanges.
The EURO STOXX 50 tracks the Eurozone’s biggest and most traded companies. It also underlies one of the world’s largest ranges of ETFs and mutual funds. As of November 2023, there were €27.3 billion in ETFs and €23.5B in mutual fund assets under management tracking the index.
“For the past 25 years, the EURO STOXX 50 has served as an accurate, reliable and tradable representation of the Eurozone equity market.”
— Axel Lomholt, General Manager at STOXX
Partnering with STOXX to Track the European Stock Market
Are you interested in European equities? STOXX can be a valuable partner:
- Comprehensive, liquid and investable ecosystem
- European heritage, global reach
- Highly sophisticated customization capabilities
- Open architecture approach to using data
- Close partnerships with clients
- Part of ISS STOXX and Deutsche Börse Group
With a full suite of indices, STOXX can help you benchmark against the European stock market.
Learn how STOXX’s European indices offer liquid and effective market access.

-

 Economy2 days ago
Economic Growth Forecasts for G7 and BRICS Countries in 2024
The IMF has released its economic growth forecasts for 2024. How do the G7 and BRICS countries compare?
-

 Markets1 week ago
U.S. Debt Interest Payments Reach $1 Trillion
U.S. debt interest payments have surged past the $1 trillion dollar mark, amid high interest rates and an ever-expanding debt burden.
-

 United States2 weeks ago
Ranked: The Largest U.S. Corporations by Number of Employees
We visualized the top U.S. companies by employees, revealing the massive scale of retailers like Walmart, Target, and Home Depot.
-

 Markets2 weeks ago
The Top 10 States by Real GDP Growth in 2023
This graphic shows the states with the highest real GDP growth rate in 2023, largely propelled by the oil and gas boom.
-

 Markets2 weeks ago
Ranked: The World’s Top Flight Routes, by Revenue
In this graphic, we show the highest earning flight routes globally as air travel continued to rebound in 2023.
-

 Markets2 weeks ago
Ranked: The Most Valuable Housing Markets in America
The U.S. residential real estate market is worth a staggering $47.5 trillion. Here are the most valuable housing markets in the country.


-

 Energy1 week ago
The World’s Biggest Nuclear Energy Producers
-

 Money2 weeks ago
Which States Have the Highest Minimum Wage in America?
-

 Technology2 weeks ago
Ranked: Semiconductor Companies by Industry Revenue Share
-
Markets2 weeks ago
Ranked: The World’s Top Flight Routes, by Revenue
-

 Countries2 weeks ago
Population Projections: The World’s 6 Largest Countries in 2075
-
Markets2 weeks ago
The Top 10 States by Real GDP Growth in 2023
-

 Demographics2 weeks ago
The Smallest Gender Wage Gaps in OECD Countries
-

 United States2 weeks ago
Where U.S. Inflation Hit the Hardest in March 2024