Markets
How Investment Goals Vary by Country and Age
How Investment Goals Vary by Country and Age
It goes without saying that investors want to see their money grow.
However, it turns out that why investors want their money to grow changes considerably, depending on who you are talking to.
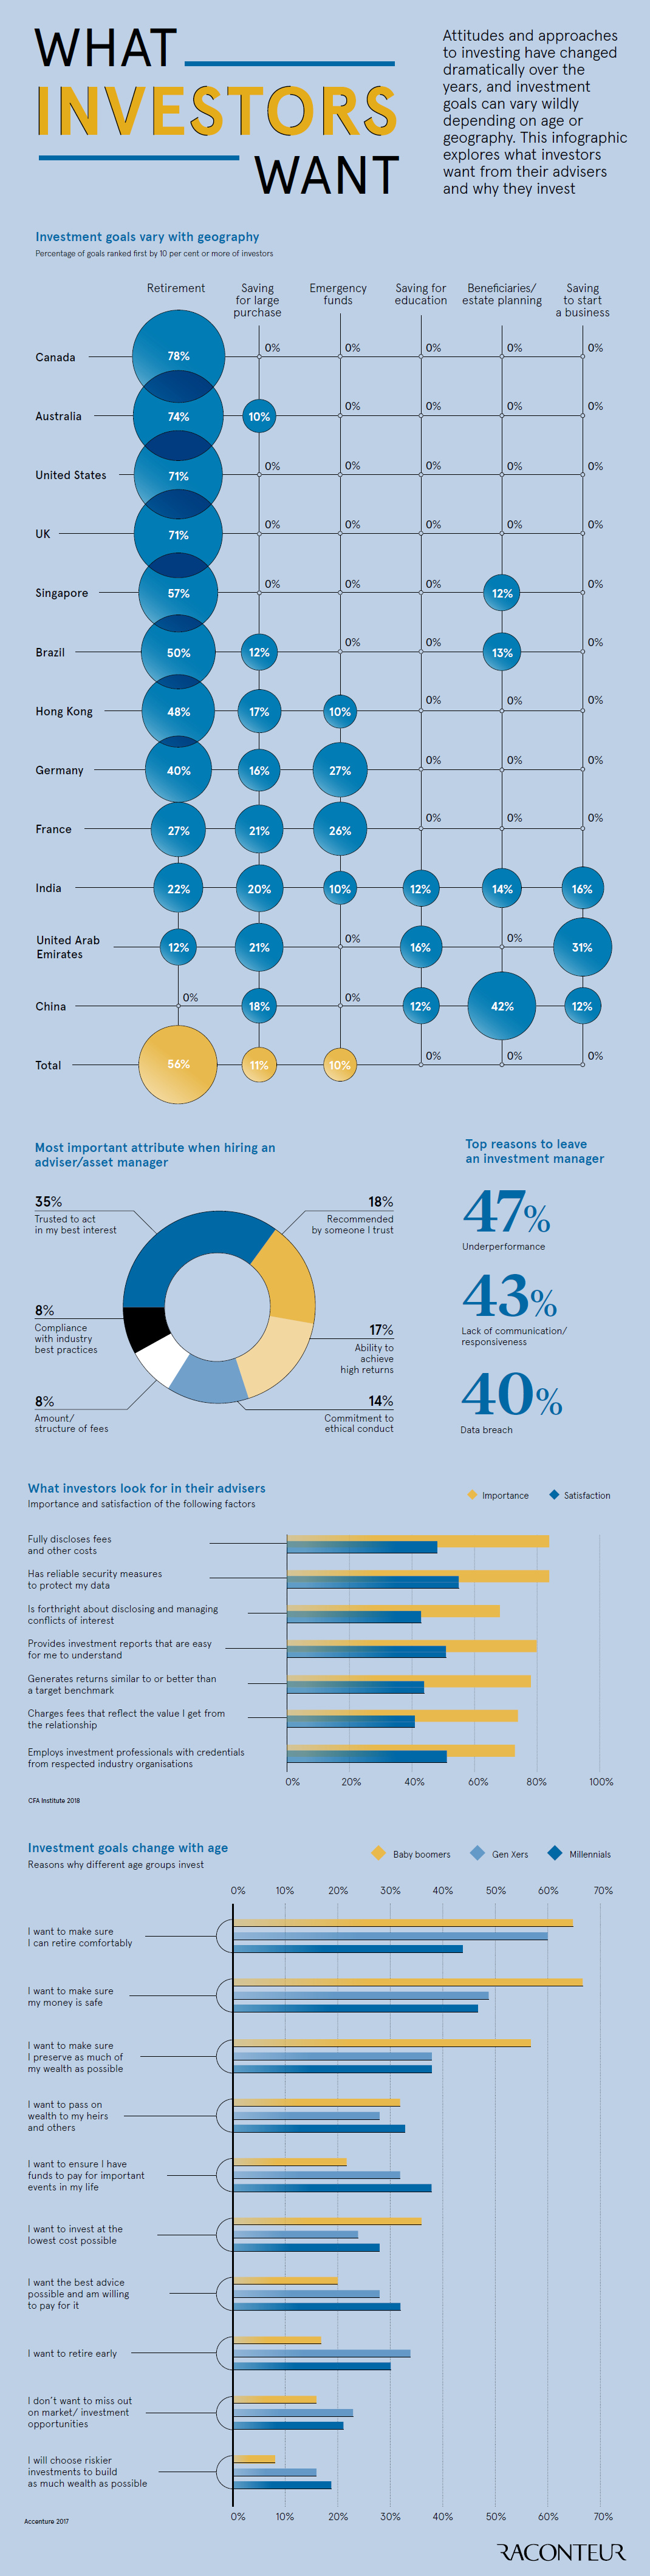
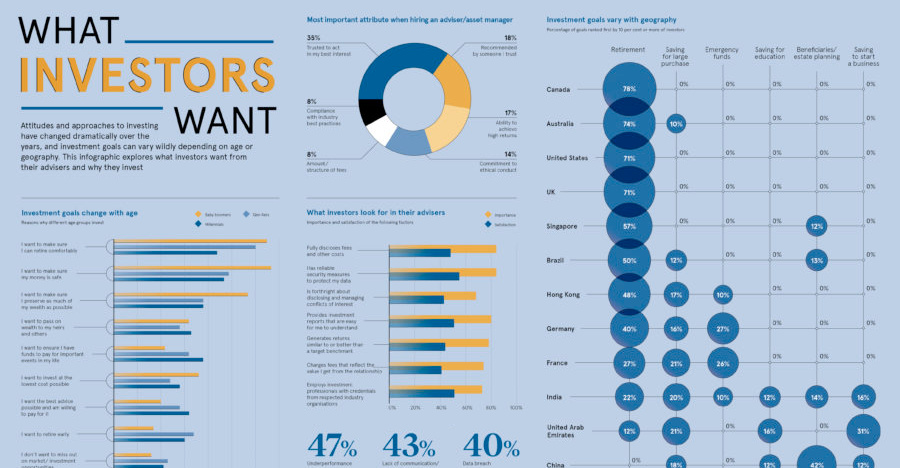
Investment Goals by Geography
Today’s infographic from Raconteur first shows why people invest based on country of residence.
In the following table, we’ll show selected data to illustrate an interesting contrast between North American, Asian, and European cultures:
| Country | Primary Investing Goal | Percentage |
|---|---|---|
| Canada | Saving for retirement | 78% |
| USA | Saving for retirement | 71% |
| UK | Saving for retirement | 71% |
| Hong Kong | Saving for retirement | 48% |
| Germany | Saving for retirement | 40% |
| France | Saving for retirement | 27% |
| UAE | Saving to start a business | 31% |
| China | Beneficiaries / estate planning | 42% |
In Canada, the United States, and the United Kingdom, saving for retirement is the primary investment goal for 70% or more of all respondents. However, in Europe and Asia, there is a much wider diversity of investment goals.
In Germany and France, for example, close to a quarter of respondents mentioned that saving for an emergency was their primary goal, behind saving for retirement. Meanwhile, in the UAE and in China, the primary investment goal was not retirement – it was instead saving to start a business (UAE) and setting up family and/or beneficiaries for success (China).
Goals by Generation
It’s not just geographical boundaries, the level of economic development, and the local culture that impacts investment goals.
Another factor is generational: Baby Boomers, Gen Xers, and Millennials are at very different stages of life, and each generation has their own quirky preferences, anyway.
| Statement (I want to…) | Highest Agreeance | Lowest agreeance |
|---|---|---|
| Retire comfortably | Boomers | Millennials |
| Make sure money is safe | Boomers | Millennials |
| Preserve as much wealth as possible | Boomers | Millennials |
| Pass on wealth to my heirs and others | Millennials | Gen Xers |
| Ensure I have funds to pay for important events | Millennials | Boomers |
| Invest at the lowest cost possible | Boomers | Gen Xers |
| Have the best advice possible and am willing to pay | Millennials | Boomers |
| Retire early | Gen Xers | Boomers |
| Not miss out on market opportunities | Gen Xers | Boomers |
| Choose riskier investments to build wealth fast | Millennials | Boomers |
Not surprisingly, as people get older, their goals shift away from making immediate big-ticket purchases, and holding riskier investments for a higher rate of return. Later on in life, goals are more focused on retirement and maximizing wealth.
That said, there are some anomalies in the above data that are interesting.
For example, Millennials – not Baby Boomers – are most concerned about building wealth to pass onto their heirs. Finally, it is the Millennials that are willing to pay the most for investment advice, in order to get the best possible result.


Markets
Mapped: Europe’s GDP Per Capita, by Country
Which European economies are richest on a GDP per capita basis? This map shows the results for 44 countries across the continent.


Mapped: Europe’s GDP Per Capita, by Country (2024)
This was originally posted on our Voronoi app. Download the app for free on iOS or Android and discover incredible data-driven charts from a variety of trusted sources.
Europe is home to some of the largest and most sophisticated economies in the world. But how do countries in the region compare with each other on a per capita productivity basis?
In this map, we show Europe’s GDP per capita levels across 44 nations in current U.S. dollars. Data for this visualization and article is sourced from the International Monetary Fund (IMF) via their DataMapper tool, updated April 2024.
Europe’s Richest and Poorest Nations, By GDP Per Capita
Luxembourg, Ireland, and Switzerland, lead the list of Europe’s richest nations by GDP per capita, all above $100,000.
| Rank | Country | GDP Per Capita (2024) |
|---|---|---|
| 1 | 🇱🇺 Luxembourg | $131,380 |
| 2 | 🇮🇪 Ireland | $106,060 |
| 3 | 🇨🇭 Switzerland | $105,670 |
| 4 | 🇳🇴 Norway | $94,660 |
| 5 | 🇮🇸 Iceland | $84,590 |
| 6 | 🇩🇰 Denmark | $68,900 |
| 7 | 🇳🇱 Netherlands | $63,750 |
| 8 | 🇸🇲 San Marino | $59,410 |
| 9 | 🇦🇹 Austria | $59,230 |
| 10 | 🇸🇪 Sweden | $58,530 |
| 11 | 🇧🇪 Belgium | $55,540 |
| 12 | 🇫🇮 Finland | $55,130 |
| 13 | 🇩🇪 Germany | $54,290 |
| 14 | 🇬🇧 UK | $51,070 |
| 15 | 🇫🇷 France | $47,360 |
| 16 | 🇦🇩 Andorra | $44,900 |
| 17 | 🇲🇹 Malta | $41,740 |
| 18 | 🇮🇹 Italy | $39,580 |
| 19 | 🇨🇾 Cyprus | $37,150 |
| 20 | 🇪🇸 Spain | $34,050 |
| 21 | 🇸🇮 Slovenia | $34,030 |
| 22 | 🇪🇪 Estonia | $31,850 |
| 23 | 🇨🇿 Czech Republic | $29,800 |
| 24 | 🇵🇹 Portugal | $28,970 |
| 25 | 🇱🇹 Lithuania | $28,410 |
| 26 | 🇸🇰 Slovakia | $25,930 |
| 27 | 🇱🇻 Latvia | $24,190 |
| 28 | 🇬🇷 Greece | $23,970 |
| 29 | 🇭🇺 Hungary | $23,320 |
| 30 | 🇵🇱 Poland | $23,010 |
| 31 | 🇭🇷 Croatia | $22,970 |
| 32 | 🇷🇴 Romania | $19,530 |
| 33 | 🇧🇬 Bulgaria | $16,940 |
| 34 | 🇷🇺 Russia | $14,390 |
| 35 | 🇹🇷 Türkiye | $12,760 |
| 36 | 🇲🇪 Montenegro | $12,650 |
| 37 | 🇷🇸 Serbia | $12,380 |
| 38 | 🇦🇱 Albania | $8,920 |
| 39 | 🇧🇦 Bosnia & Herzegovina | $8,420 |
| 40 | 🇲🇰 North Macedonia | $7,690 |
| 41 | 🇧🇾 Belarus | $7,560 |
| 42 | 🇲🇩 Moldova | $7,490 |
| 43 | 🇽🇰 Kosovo | $6,390 |
| 44 | 🇺🇦 Ukraine | $5,660 |
| N/A | 🇪🇺 EU Average | $44,200 |
Note: Figures are rounded.
Three Nordic countries (Norway, Iceland, Denmark) also place highly, between $70,000-90,000. Other Nordic peers, Sweden and Finland rank just outside the top 10, between $55,000-60,000.
Meanwhile, Europe’s biggest economies in absolute terms, Germany, UK, and France, rank closer to the middle of the top 20, with GDP per capitas around $50,000.
Finally, at the end of the scale, Eastern Europe as a whole tends to have much lower per capita GDPs. In that group, Ukraine ranks last, at $5,660.
A Closer Look at Ukraine
For a broader comparison, Ukraine’s per capita GDP is similar to Iran ($5,310), El Salvador ($5,540), and Guatemala ($5,680).
According to experts, Ukraine’s economy has historically underperformed to expectations. After the fall of the Berlin Wall, the economy contracted for five straight years. Its transition to a Western, liberalized economic structure was overshadowed by widespread corruption, a limited taxpool, and few revenue sources.
Politically, its transformation from authoritarian regime to civil democracy has proved difficult, especially when it comes to institution building.
Finally, after the 2022 invasion of the country, Ukraine’s GDP contracted by 30% in a single year—the largest loss since independence. Large scale emigration—to the tune of six million refugees—is also playing a role.
Despite these challenges, the country’s economic growth has somewhat stabilized while fighting continues.

-

 Markets5 days ago
The World’s Fastest Growing Emerging Markets (2024-2029 Forecast)
-

 Technology2 weeks ago
All of the Grants Given by the U.S. CHIPS Act
-

 Green2 weeks ago
The Carbon Footprint of Major Travel Methods
-

 United States2 weeks ago
Visualizing the Most Common Pets in the U.S.
-

 Culture2 weeks ago
The World’s Top Media Franchises by All-Time Revenue
-

 Best of1 week ago
Best Visualizations of April on the Voronoi App
-

 Wealth1 week ago
Charted: Which Country Has the Most Billionaires in 2024?
-

 Markets1 week ago
The Top Private Equity Firms by Country