

Global debt reached $226T by the end of 2020 – the biggest one-year jump since WWII. This graphic compares the debt-to-GDP ratio of various countries.


Where does the world's economic activity take place? This cartogram shows the $94 trillion global economy divided into 1,000 hexagons.
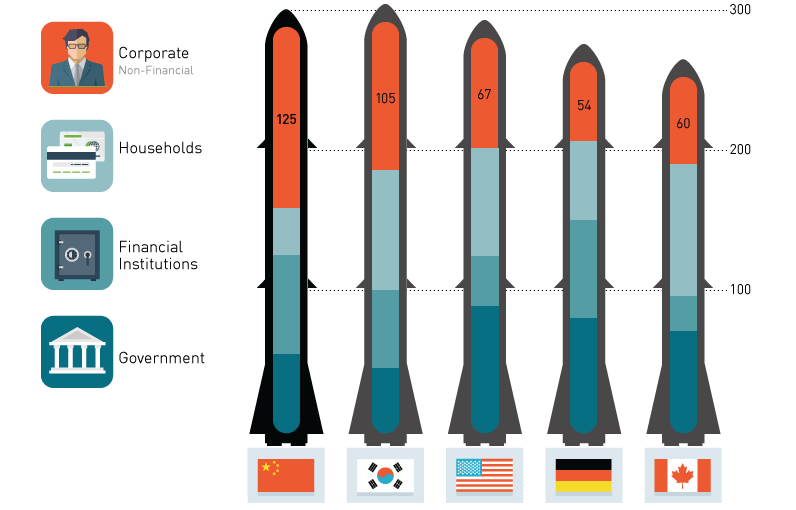
No one knows the size of China's debt bomb. Here we look at estimates of the payload as well as what could potentially ignite the fuse.
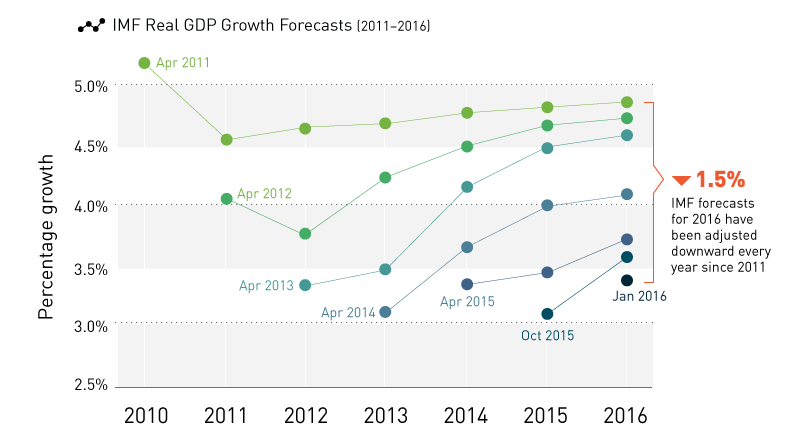
After five years of downward revisions to global real GDP growth, will next week's IMF economic report finally be grounded in reality?
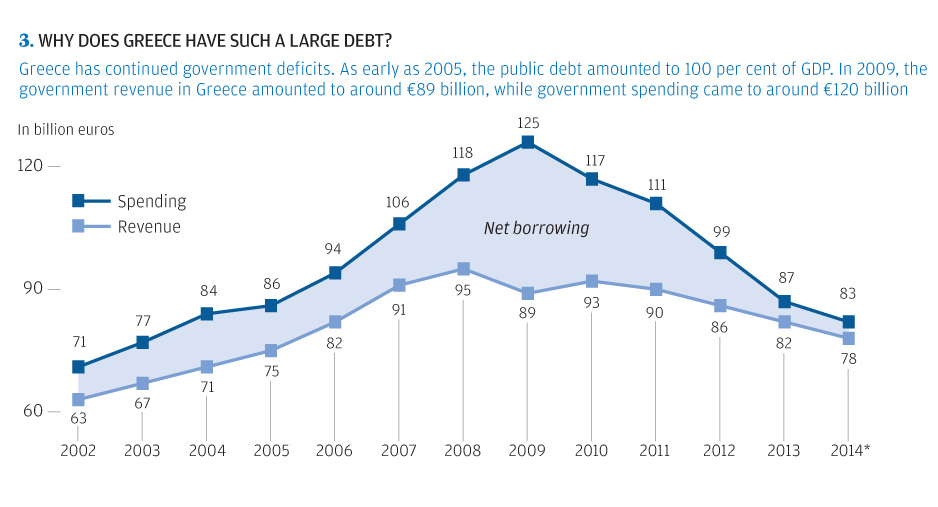
The story of Greece's debt crisis through charts. The origin of the Greek crisis shown in bond yields, population, unemployment, timeline, and more.
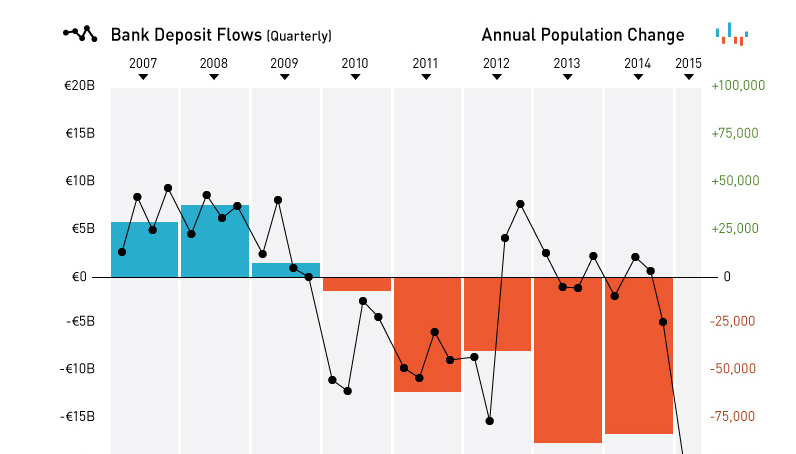
Today's chart shows the Greek exodus, as capital and people flee the sinking Greek economic ship in unprecedented numbers.


