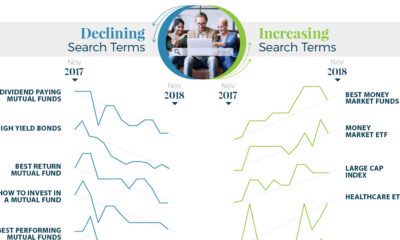

What types of investments are investors searching for? Get a unique picture of it in this infographic, which visualizes search trends between 2017 and 2018.
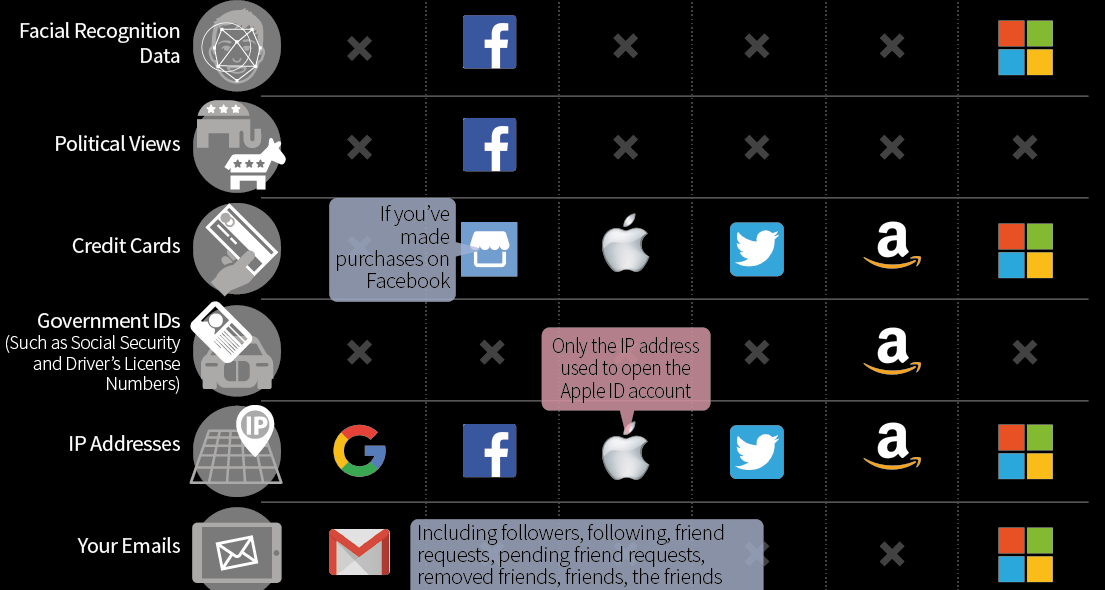
Comparing the types of data that the big tech companies like Facebook, Google, and Amazon admit to collecting in their privacy policies.
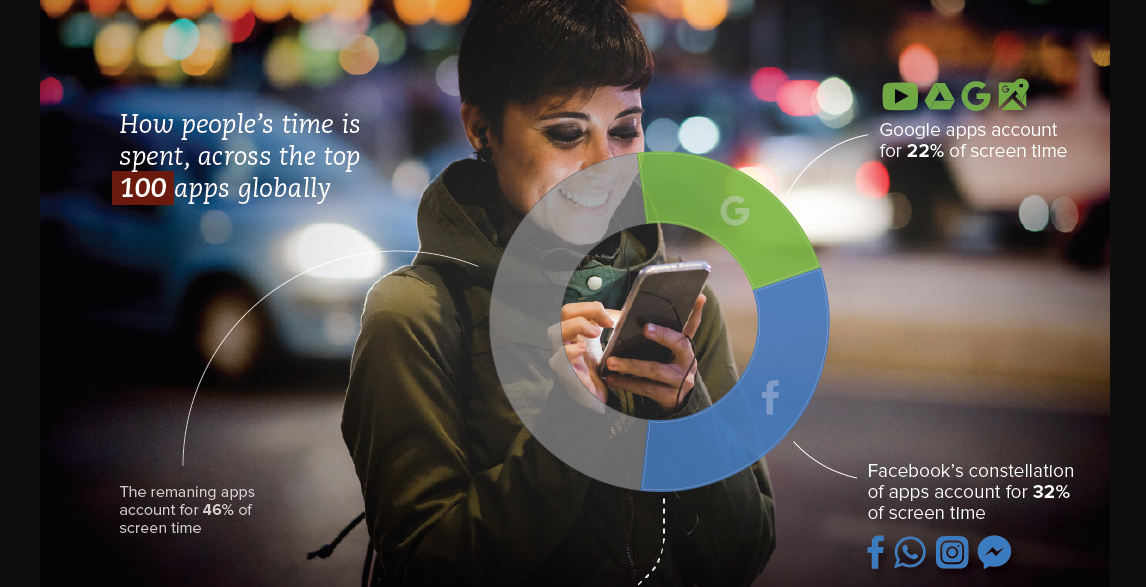
Facebook and Google owned apps capture 54% of all app screen time, out of the top 100 most popular apps around the world.
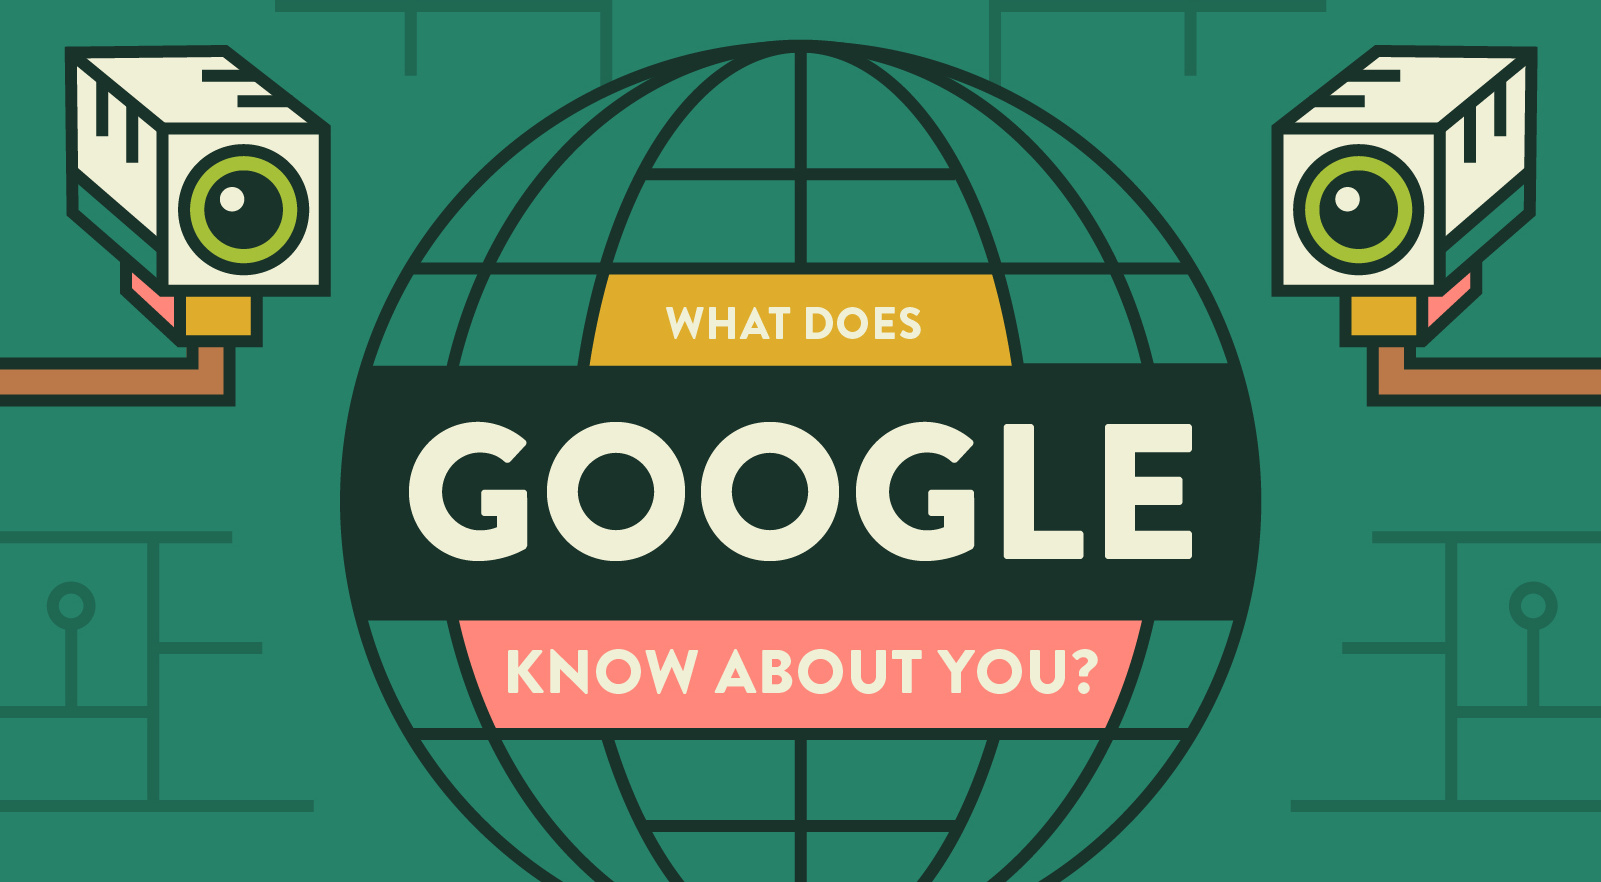
Google tracks pretty much everything you do, including where you've been, what you look like, and your personal beliefs. See what Google knows about you.
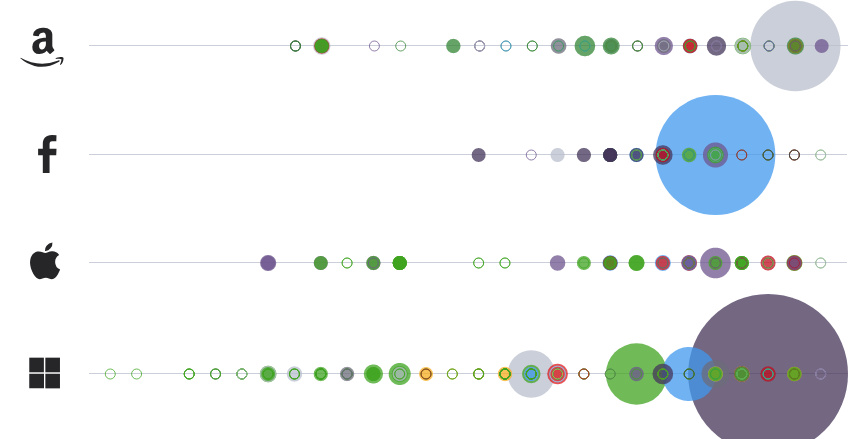
See what types of companies are getting gobbled up by Amazon, Facebook, Google, and other tech majors on this interactive tech acquisition chart.
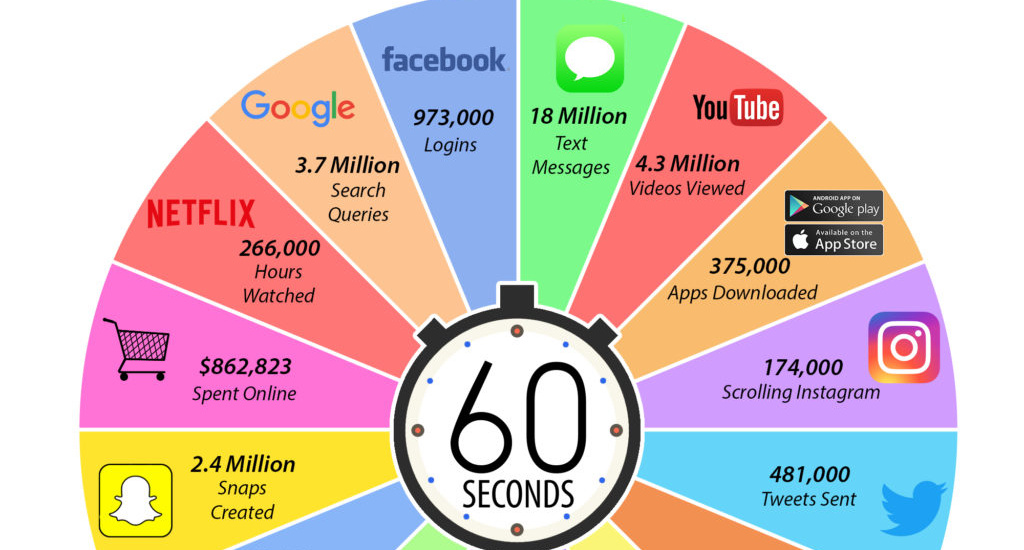
Not much happens in a minute of everyday life - but on the internet, it's a different story! See the web's scale visualized with this internet...
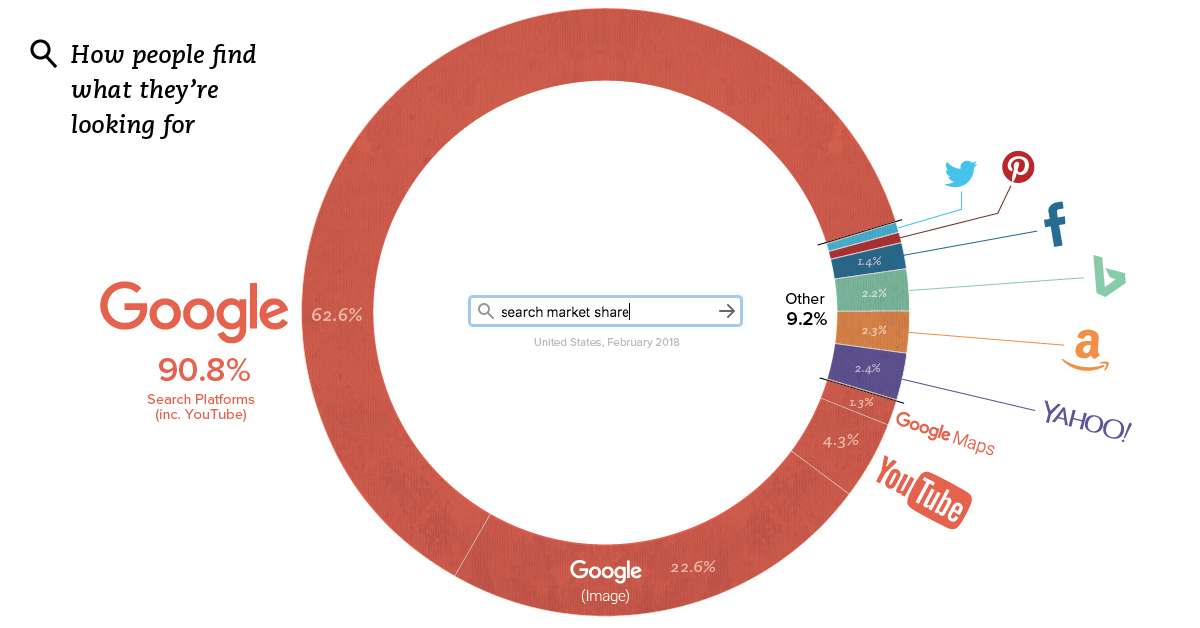
Yes, it's a given that Google dominates the search market - but the fact is, Google is probably even more dominant than you would have guessed.
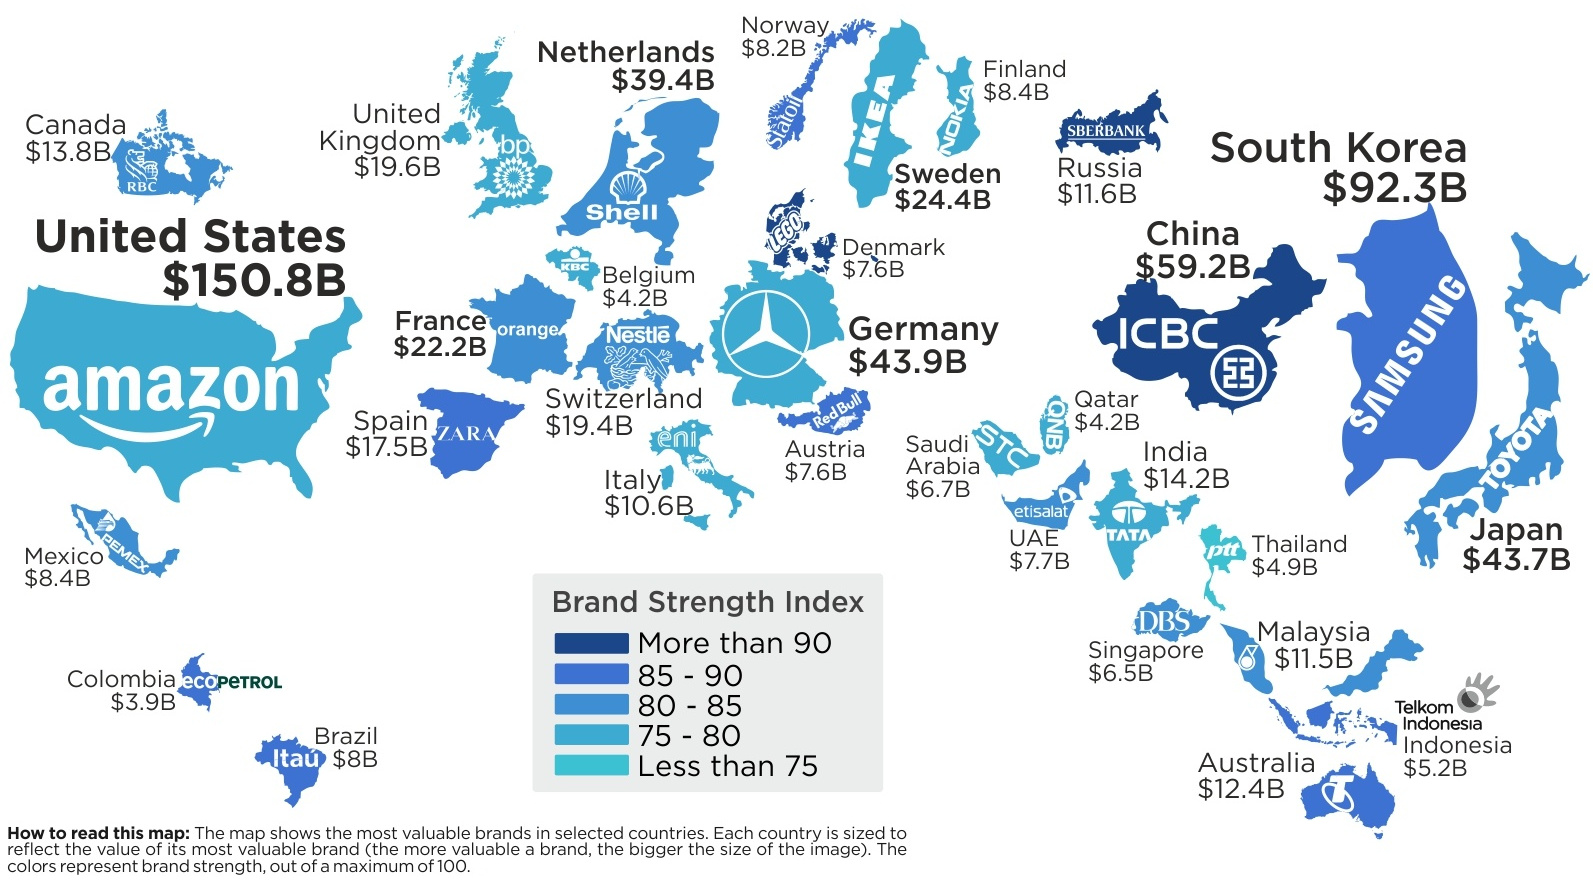
Amazon edged out Google and Apple to become the most valuable brand in the U.S. - and by far the most dominant brand globally.
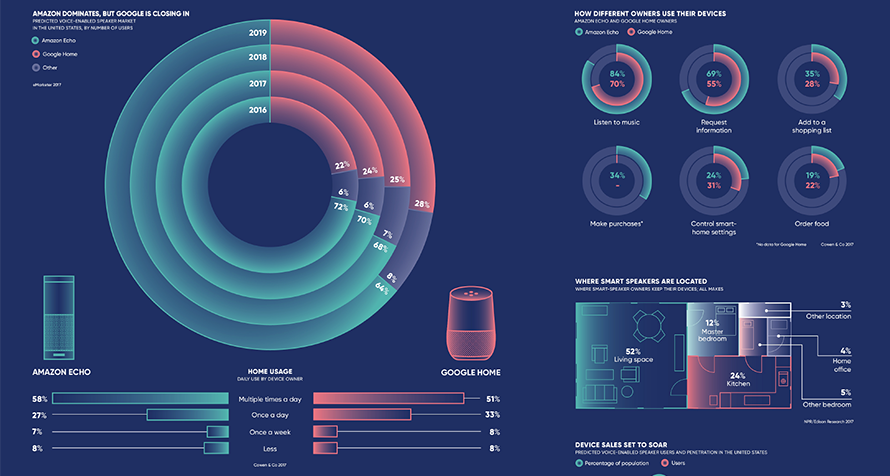
The growing array of AI-powered 'smart speakers' on the market points to a larger consumer shift. Here's what you need to know.
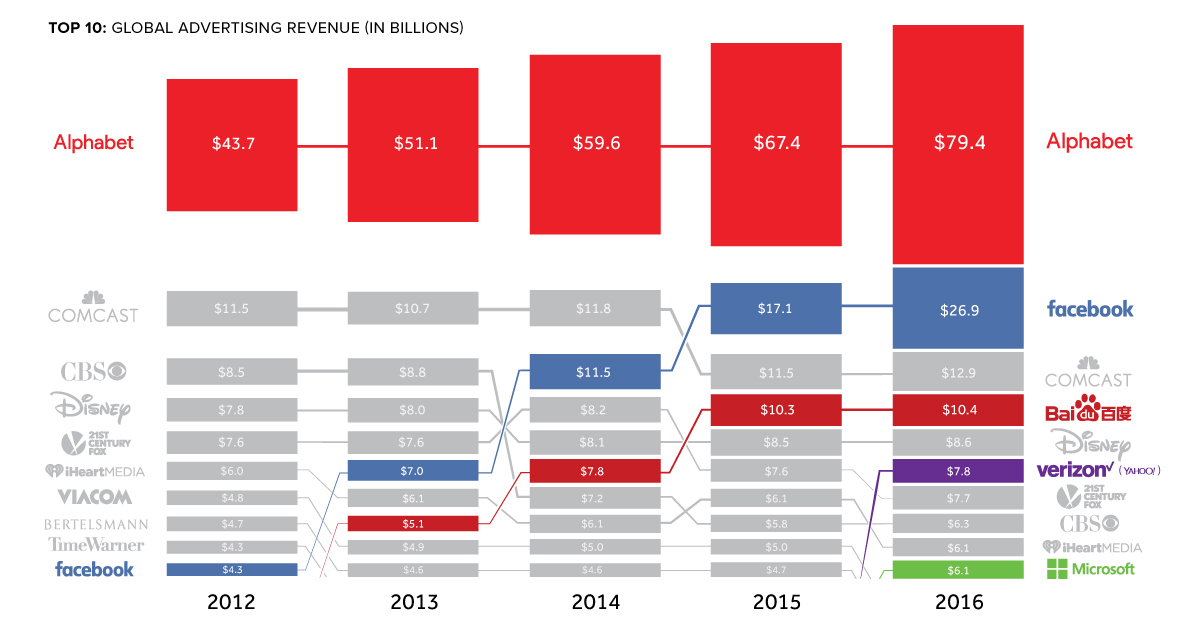
Traditional media is having a tough time keeping up, as Google, Facebook, and Chinese search giant Baidu lead the tech takeover of advertising.


