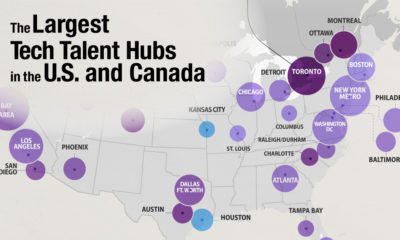

6.5 million skilled tech workers currently work in the U.S. and Canada. Here we look at the largest tech hubs across the two countries
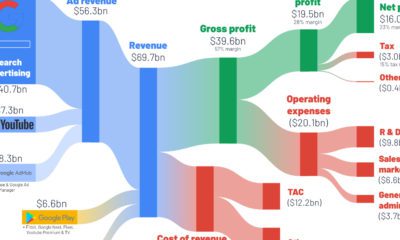

How do the big tech giants make their money? This series of graphics shows a breakdown of big tech revenue, using Q2 2022 income statements.
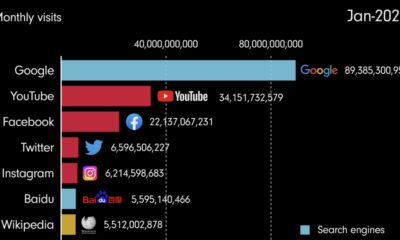

This video shows the evolution of the internet, highlighting the most popular websites from 1993 until 2022.
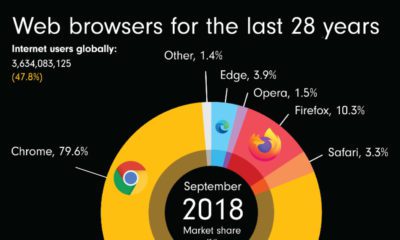

This animation shows the evolution of web browser market share since 1994, showing the rise and fall of various internet portals.
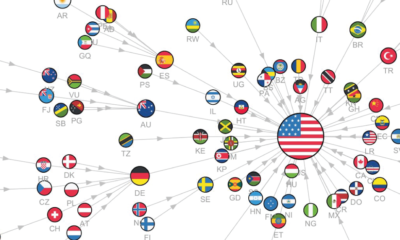

This series of visualizations uses Google trends search data to show the most googled countries around the world, from 2004 to 2022.
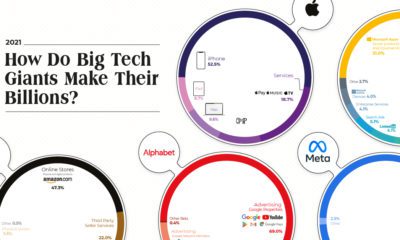

The Big Five tech companies made $1.4 trillion in revenue combined—more than Mexico’s entire GDP. Here's how they earned it all.
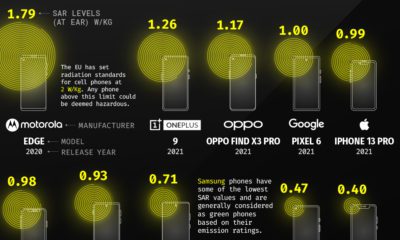

The parameter used to measure phone radiation emissions is the SAR value. Here we visualize the SAR values of some popular smartphones.
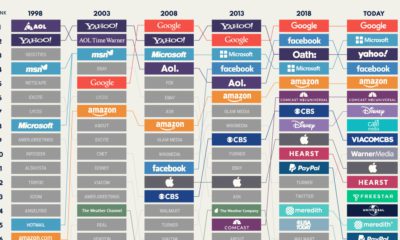

A lot has changed since Yahoo and AOL were the homepages of choice. This visualization looks at the largest internet giants in the U.S. since 1998.
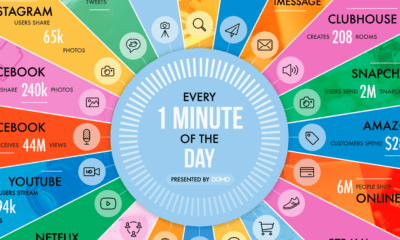

A lot can happen in an internet minute. This stat-heavy graphic looks at the epic numbers behind the online services billions use every day.


The spookiest time of the year is back. Here we visualize the most popular Halloween costumes in the U.S. in 2021.


 Creator Program