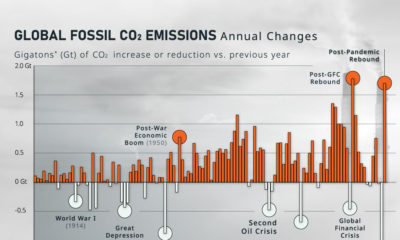

How much do global CO₂ emissions change on a year-to-year basis? Here, we show the annual rate of change in emissions since 1900.
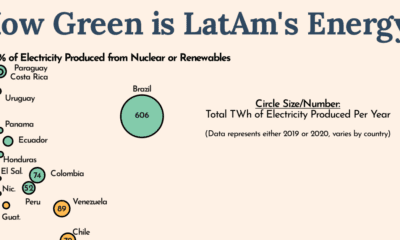

Countries around the world are looking to decarbonize, but Latin America is leading the charge in green energy usage.
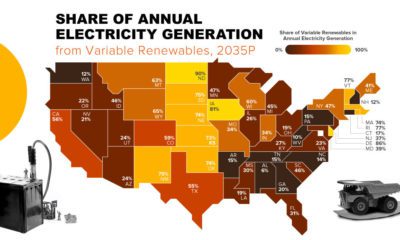

As the U.S. transitions to clean energy, investing in battery metals like lithium and cobalt can help secure an energy-independent future.
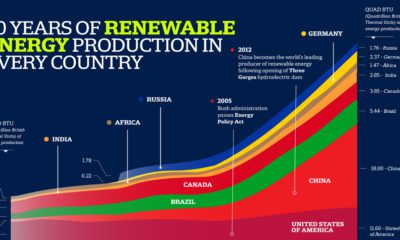

Here's a snapshot of global energy production, and which countries have produced the most fossil fuels, nuclear, and renewable energy since 1980.
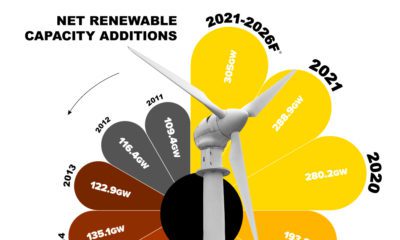

This infographic explores the exponential growth of the technologies that are shaping the new era of energy.
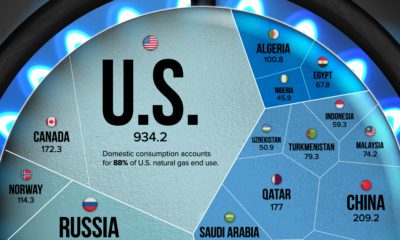

Natural gas prices have risen since Russia's invasion of Ukraine. This visualization highlights the world’s largest natural gas producers.
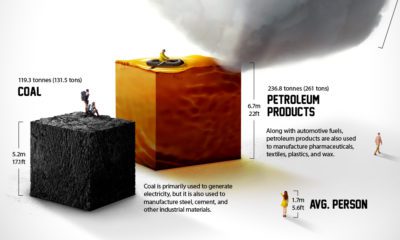

Each year the average American consumes more than 23 barrels of petroleum products. What does a lifetime of fossil fuel consumption look like?
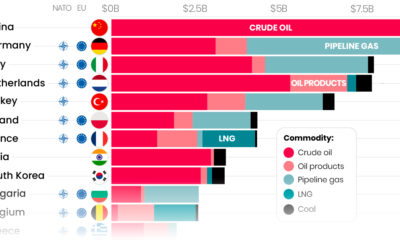

Here are the top importers of Russian fossil fuels since the start of the war.
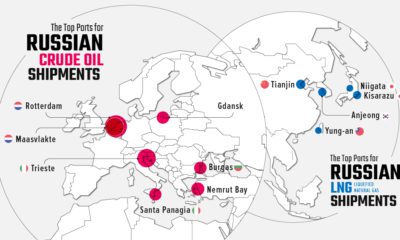

Russia's energy exports have become a hot topic. See which ports received fossil shipments during the first 100 days of the Ukraine invasion
The current energy transition is unprecedented in both scale and speed. This infographic puts it into historical context.


 Creator Program