Energy
Charted: 40 Years of Global Energy Production, by Country
Article/Editing:
Energy was already a hot topic before 2022, but soaring household energy bills and a cost of living crisis has brought it even more to the forefront.
Which countries are the biggest energy producers, and what types of energy are they churning out? This graphic by 911 Metallurgist gives a breakdown of global energy production, showing which countries have used the most fossil fuels, nuclear, and renewable energy since 1980.
All figures refer to the British thermal unit (BTU), equivalent to the heat required to heat one pound of water by one degree Fahrenheit.
Editor’s note: Click on any graphic to see a full-width version that is higher resolution
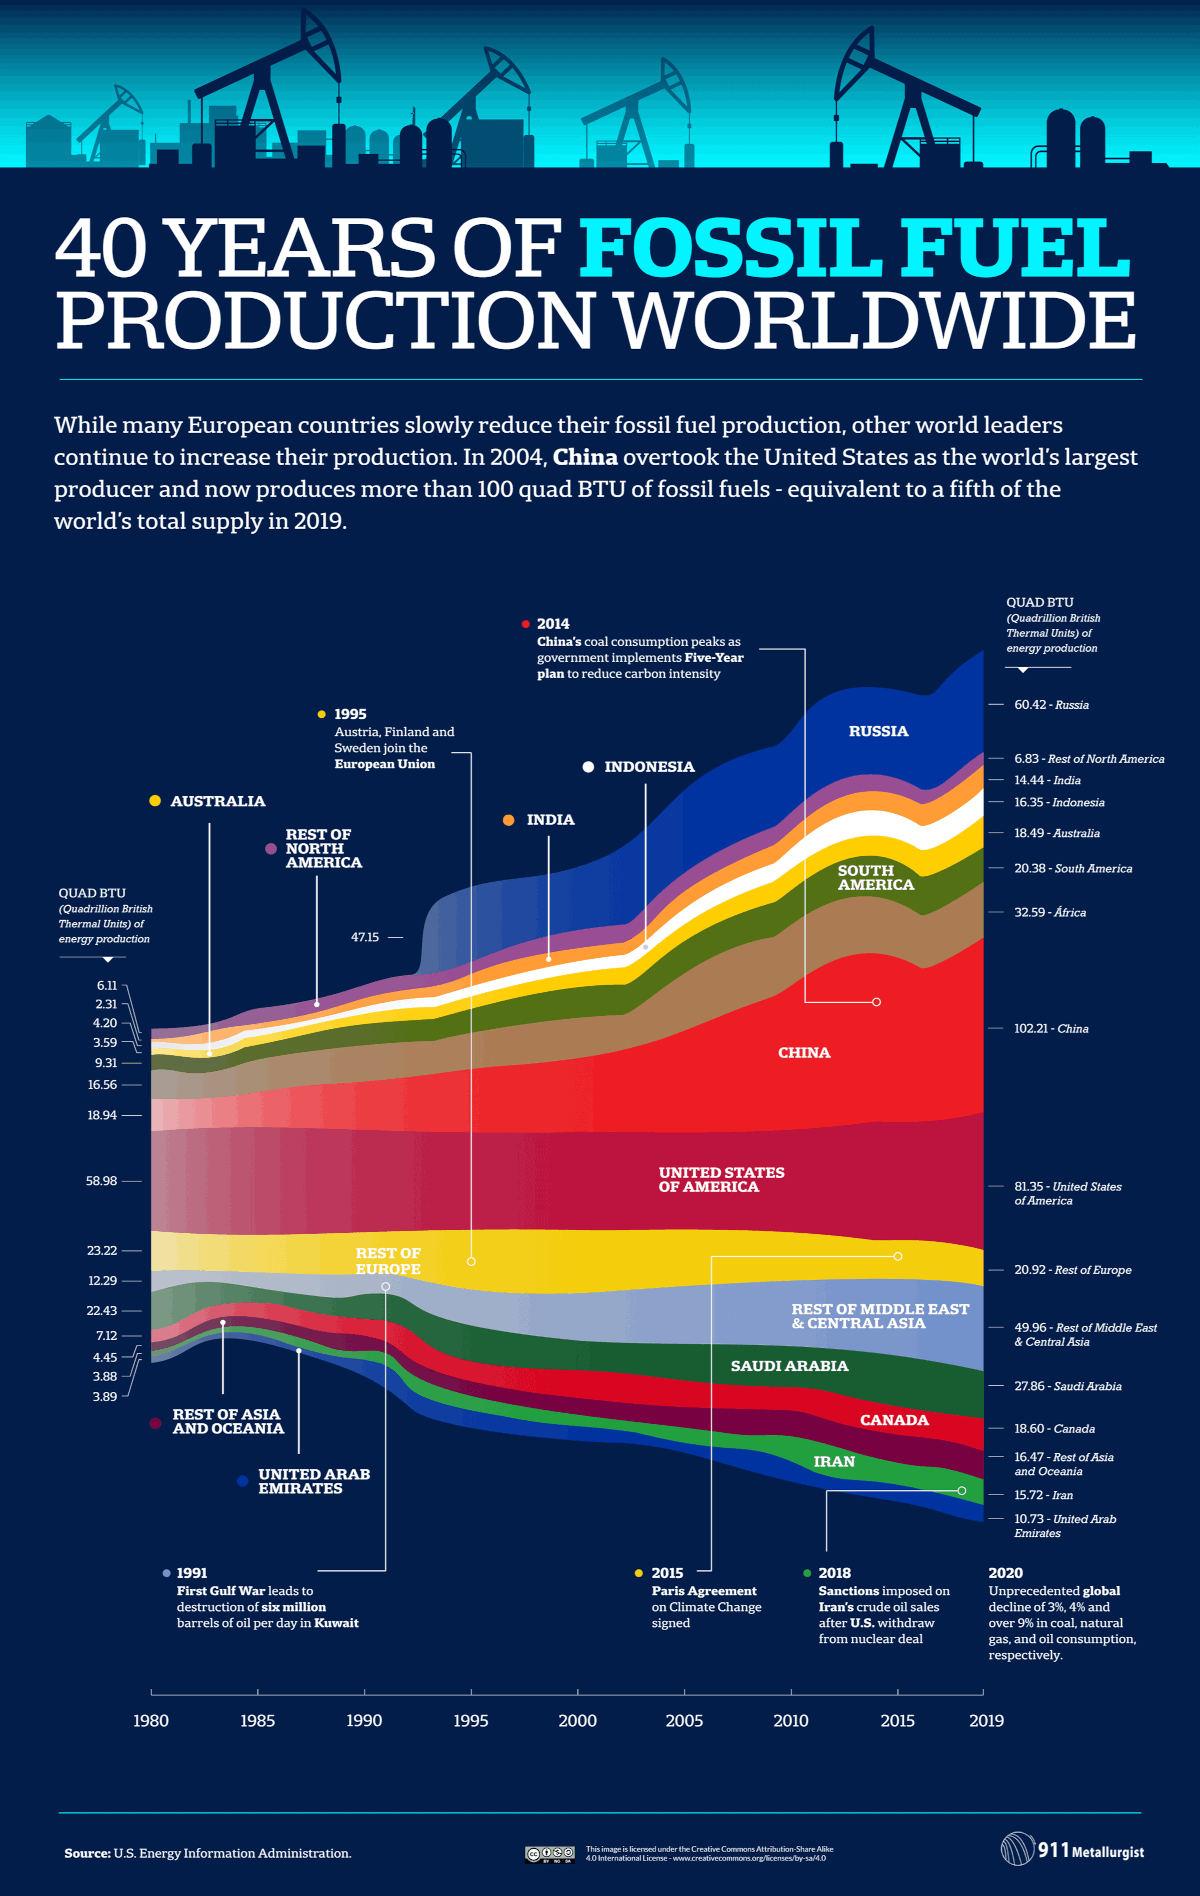
1. Fossil Fuels
View the full-size infographic
While the U.S. is a dominant player in both oil and natural gas production, China holds the top spot as the world’s largest fossil fuel producer, largely because of its significant production and consumption of coal.
Over the last decade, China has used more coal than the rest of the world, combined.
However, it’s worth noting that the country’s fossil fuel consumption and production have dipped in recent years, ever since the government launched a five-year plan back in 2014 to help reduce carbon emissions.
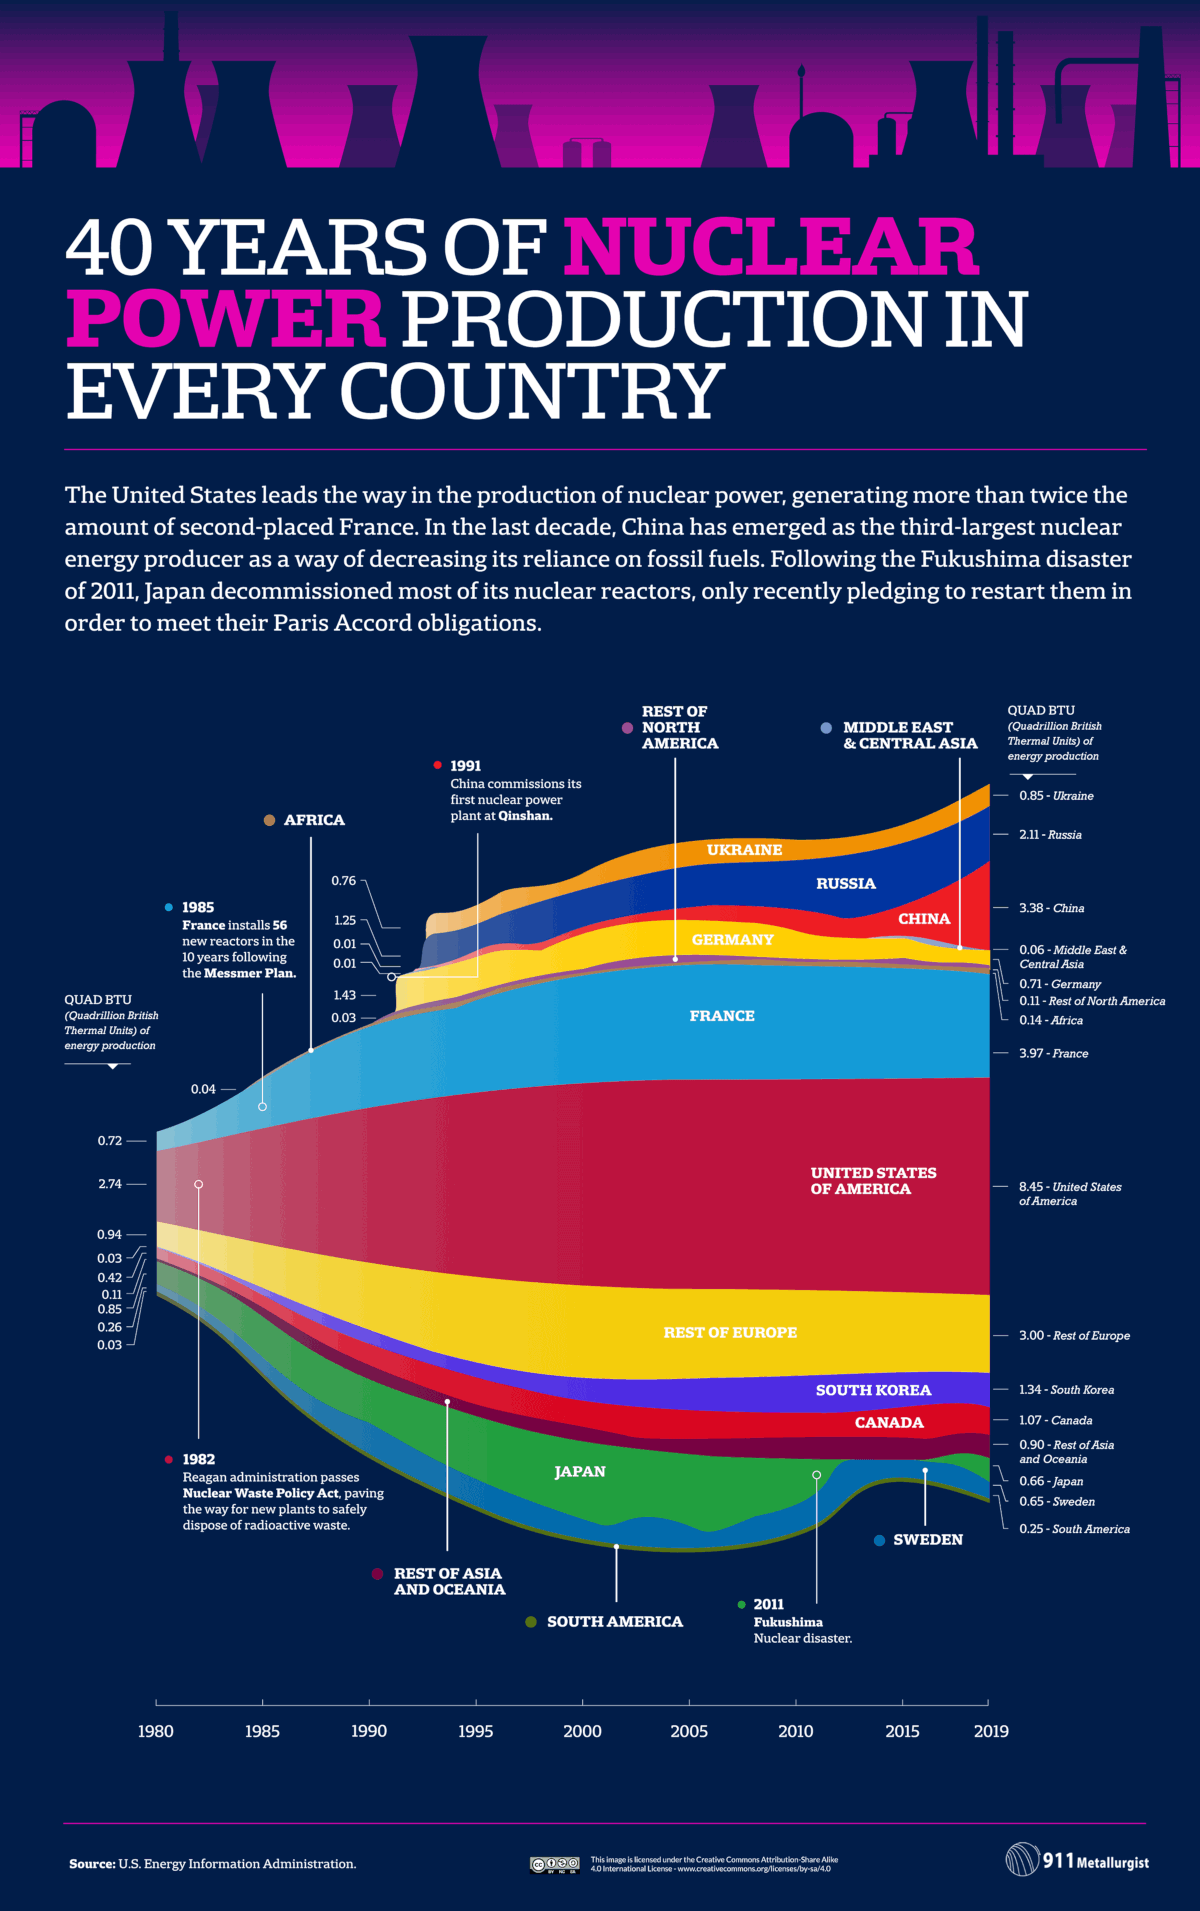
2. Nuclear Power
View the full-size infographic
The U.S. is the world’s largest producer of nuclear power by far, generating about double the amount of nuclear energy as France, the second-largest producer.
While nuclear power provides a carbon-free alternative to fossil fuels, the nuclear disaster in Fukushima caused many countries to move away from the energy source, which is why global use has dipped in recent years.
Despite the fact that many countries have recently pivoted away from nuclear energy, it still powers about 10% of the world’s electricity. It’s also possible that nuclear energy will play an expanded role in the energy mix going forward, since decarbonization has emerged as a top priority for nations around the world.
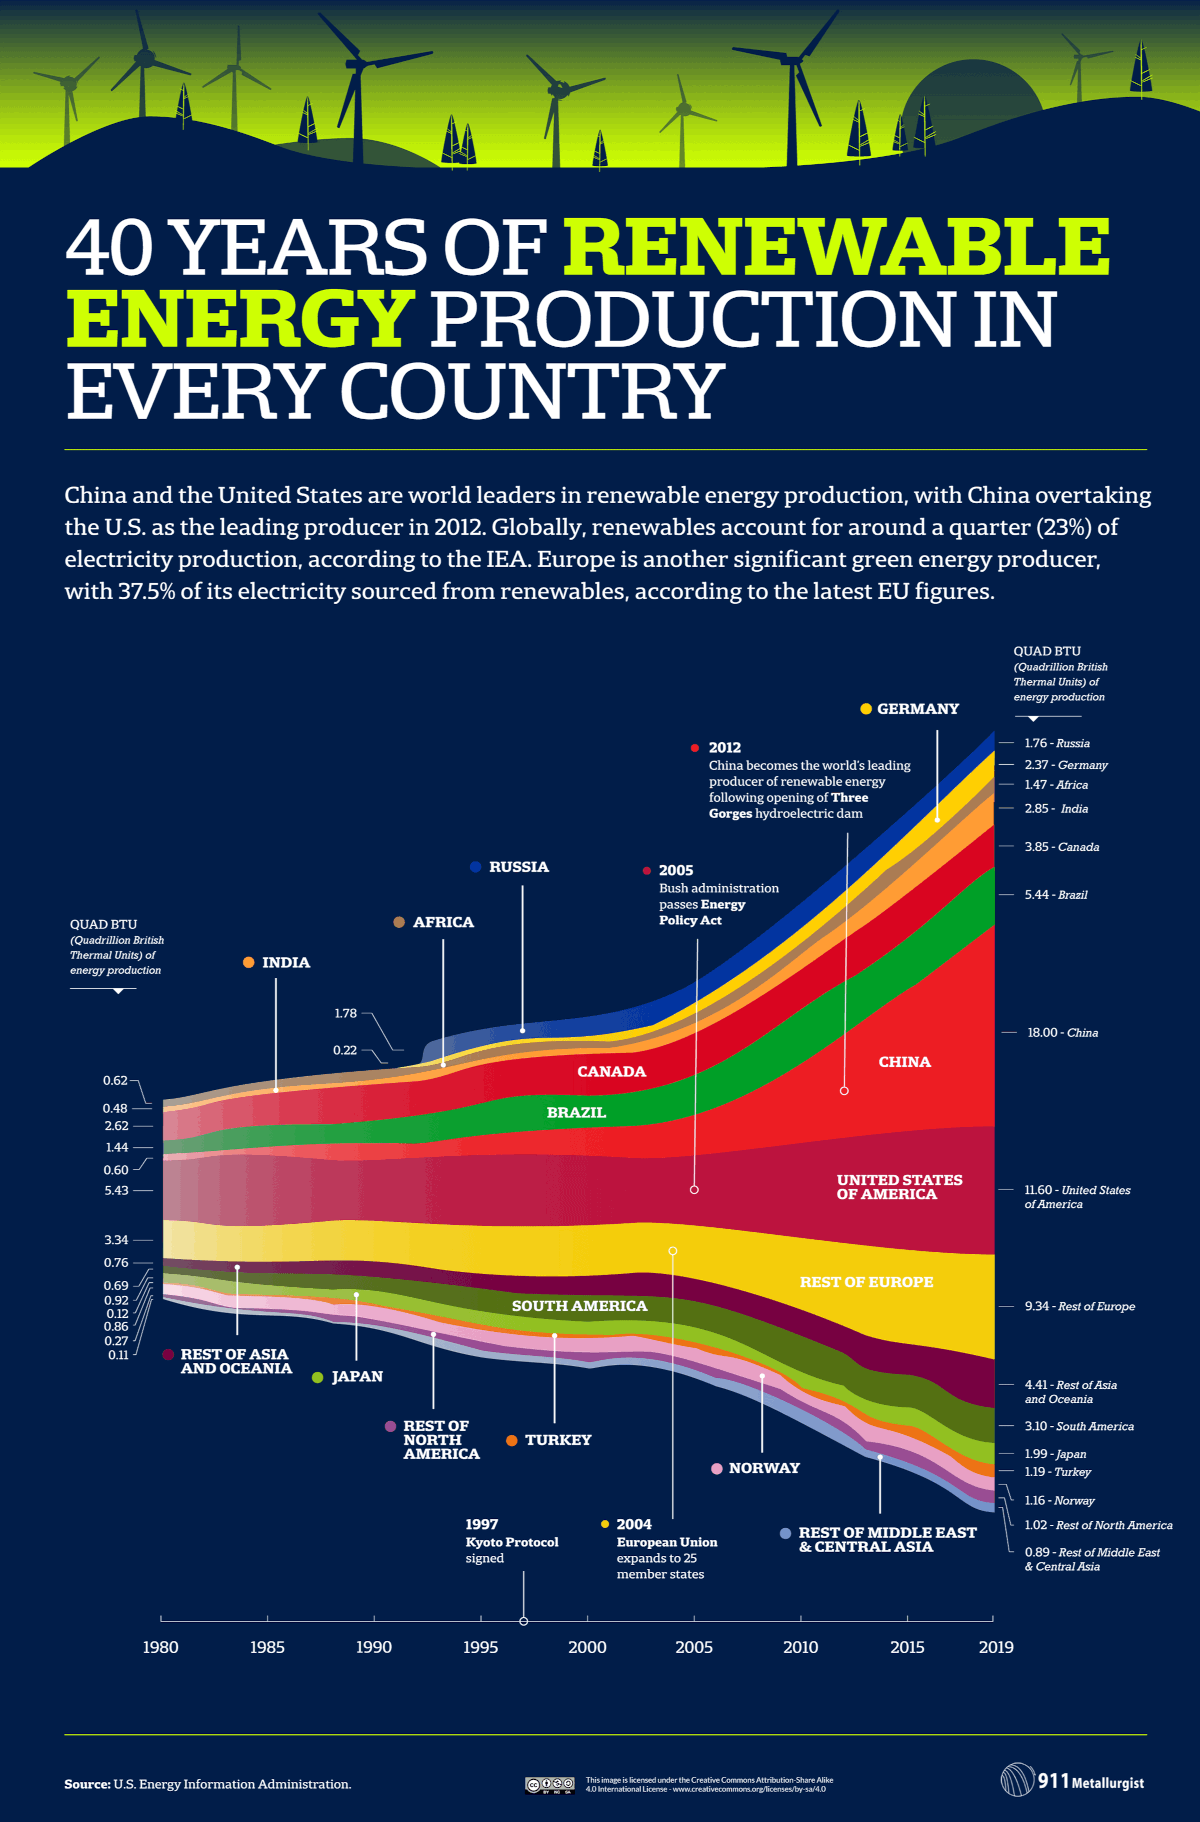
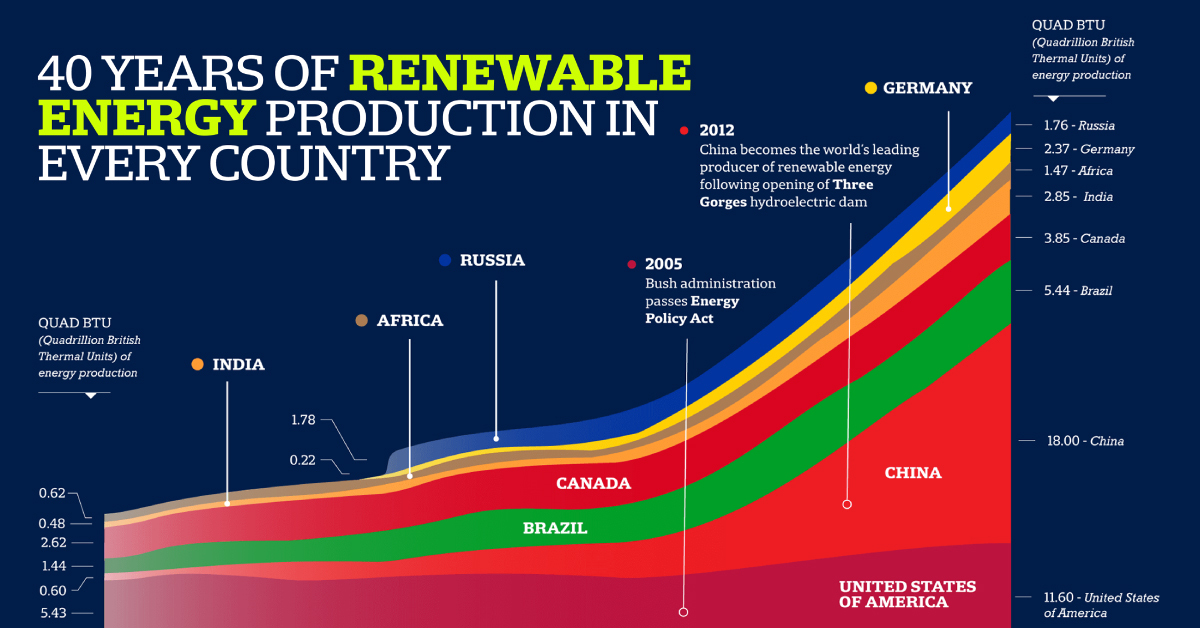
3. Renewable Energy
View the full-size infographic
Renewable energy sources (including wind, hydro, and solar) account for about 23% of electricity production worldwide. China leads the front on renewable production, while the U.S. comes in second place.
While renewable energy production has ramped up in recent years, more countries will need to ramp up their renewable energy production in order to reach net-zero targets by 2050.

This article was published as a part of Visual Capitalist's Creator Program, which features data-driven visuals from some of our favorite Creators around the world.


Lithium
Ranked: The Top 10 EV Battery Manufacturers in 2023
Asia dominates this ranking of the world’s largest EV battery manufacturers in 2023.


The Top 10 EV Battery Manufacturers in 2023
This was originally posted on our Voronoi app. Download the app for free on iOS or Android and discover incredible data-driven charts from a variety of trusted sources.
Despite efforts from the U.S. and EU to secure local domestic supply, all major EV battery manufacturers remain based in Asia.
In this graphic we rank the top 10 EV battery manufacturers by total battery deployment (measured in megawatt-hours) in 2023. The data is from EV Volumes.
Chinese Dominance
Contemporary Amperex Technology Co. Limited (CATL) has swiftly risen in less than a decade to claim the title of the largest global battery group.
The Chinese company now has a 34% share of the market and supplies batteries to a range of made-in-China vehicles, including the Tesla Model Y, SAIC’s MG4/Mulan, and various Li Auto models.
| Company | Country | 2023 Production (megawatt-hour) | Share of Total Production |
|---|---|---|---|
| CATL | 🇨🇳 China | 242,700 | 34% |
| BYD | 🇨🇳 China | 115,917 | 16% |
| LG Energy Solution | 🇰🇷 Korea | 108,487 | 15% |
| Panasonic | 🇯🇵 Japan | 56,560 | 8% |
| SK On | 🇰🇷 Korea | 40,711 | 6% |
| Samsung SDI | 🇰🇷 Korea | 35,703 | 5% |
| CALB | 🇨🇳 China | 23,493 | 3% |
| Farasis Energy | 🇨🇳 China | 16,527 | 2% |
| Envision AESC | 🇨🇳 China | 8,342 | 1% |
| Sunwoda | 🇨🇳 China | 6,979 | 1% |
| Other | - | 56,040 | 8% |
In 2023, BYD surpassed LG Energy Solution to claim second place. This was driven by demand from its own models and growth in third-party deals, including providing batteries for the made-in-Germany Tesla Model Y, Toyota bZ3, Changan UNI-V, Venucia V-Online, as well as several Haval and FAW models.
The top three battery makers (CATL, BYD, LG) collectively account for two-thirds (66%) of total battery deployment.
Once a leader in the EV battery business, Panasonic now holds the fourth position with an 8% market share, down from 9% last year. With its main client, Tesla, now sourcing batteries from multiple suppliers, the Japanese battery maker seems to be losing its competitive edge in the industry.
Overall, the global EV battery market size is projected to grow from $49 billion in 2022 to $98 billion by 2029, according to Fortune Business Insights.

-

 Mining1 week ago
Gold vs. S&P 500: Which Has Grown More Over Five Years?
-

 Markets2 weeks ago
Ranked: The Most Valuable Housing Markets in America
-

 Money2 weeks ago
Which States Have the Highest Minimum Wage in America?
-

 AI2 weeks ago
Ranked: Semiconductor Companies by Industry Revenue Share
-

 Markets2 weeks ago
Ranked: The World’s Top Flight Routes, by Revenue
-

 Countries2 weeks ago
Population Projections: The World’s 6 Largest Countries in 2075
-

 Markets2 weeks ago
The Top 10 States by Real GDP Growth in 2023
-

 Demographics2 weeks ago
The Smallest Gender Wage Gaps in OECD Countries