Energy
Which Countries Produce the Most Natural Gas?
![]() Subscribe to the Elements free mailing list for more like this
Subscribe to the Elements free mailing list for more like this


Which Countries Produce the Most Natural Gas?
This was originally posted on Elements. Sign up to the free mailing list to get beautiful visualizations on natural resource megatrends in your email every week.
Natural gas prices have risen since Russia’s invasion of Ukraine, exacerbating an already tight supply situation.
Making matters worse, Moscow has since cut gas exports to Europe to multi-year lows, sending Europe’s gas price to almost 10 times its pre-war average.
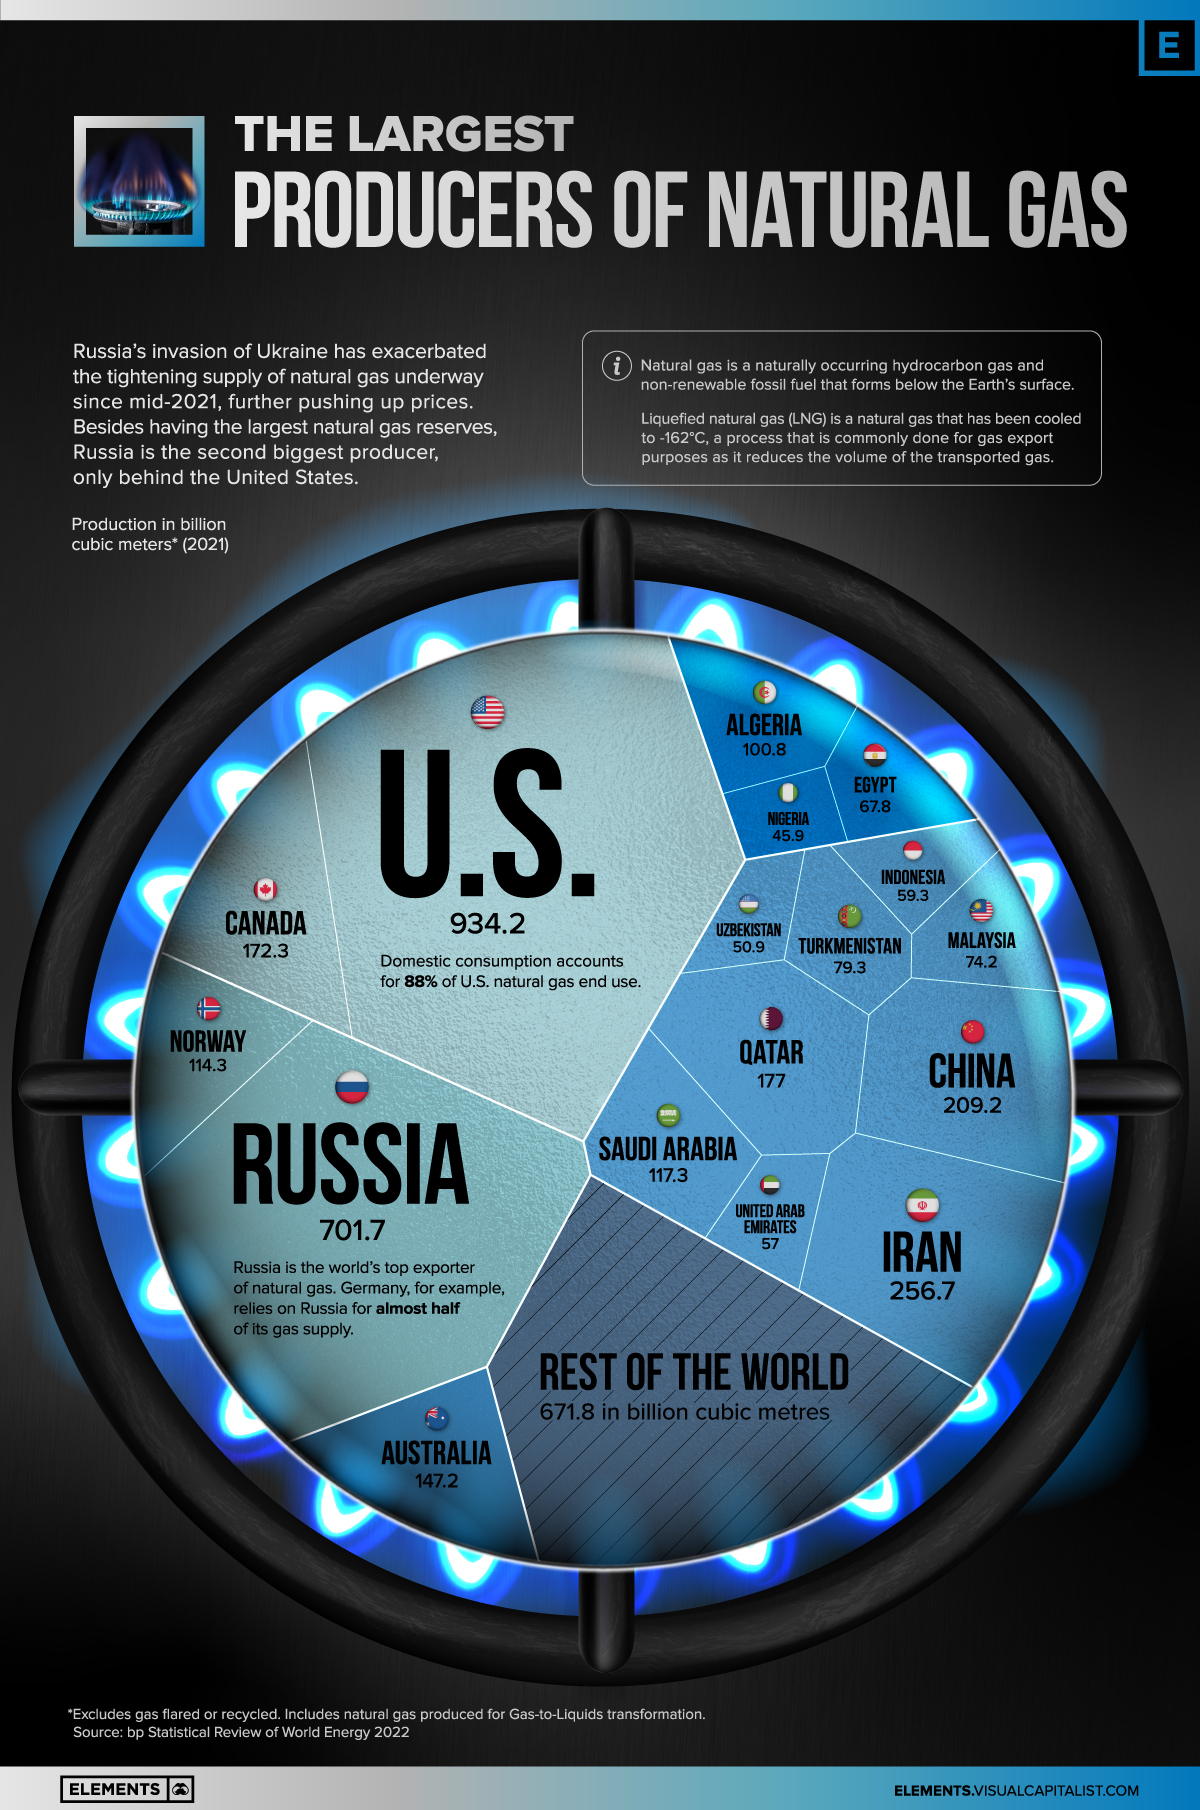
Using data from BP’s Statistical Review of World Energy, the above infographic provides further context on the gas market by visualizing the world’s largest gas producers in 2021.
Natural Gas Consumption at All-Time High in 2021
Natural gas is part of nearly every aspect of our daily lives. It is used for heating, cooking, electricity generation, as fuel for motor vehicles, in fertilizers, and in the manufacture of plastics.
The fuel is a naturally occurring hydrocarbon gas and non-renewable fossil fuel that forms below the Earth’s surface. Although the Earth has enormous quantities of natural gas, much of it is in areas far from where the fuel is needed. To facilitate transport and reduce volume, natural gas is frequently converted into liquefied natural gas (LNG), in a process called liquefaction.
Despite global efforts to reduce reliance on fossil fuels, natural gas consumption reached a new all-time high in 2021, surpassing the previous record set in 2019 by 3.3%.
Demand is expected to decline slightly in 2022 and remain subdued up to 2025, according to the International Energy Agency.
| Region | 2021 Demand in Billion Cubic Meters (bcm) | 2022P (bcm) | 2025P (bcm) |
|---|---|---|---|
| Africa | 169 | 172 | 188 |
| Asia Pacific | 895 | 907 | 990 |
| Central and South America | 153 | 147 | 153 |
| Eurasia | 634 | 619 | 632 |
| Europe | 604 | 549 | 536 |
| Middle East | 564 | 582 | 627 |
| North America | 1,084 | 1,108 | 1,116 |
| World | 4,103 | 4,083 | 4,243 |
The Asia Pacific region and the industrial sector are expected to be the main drivers of global gas consumption in the coming years
Natural Gas Production, by Country
The world’s top 10 producers of natural gas account for about 73% of total production.
| Rank | Country | 2021 Production (bcm) | Share % |
|---|---|---|---|
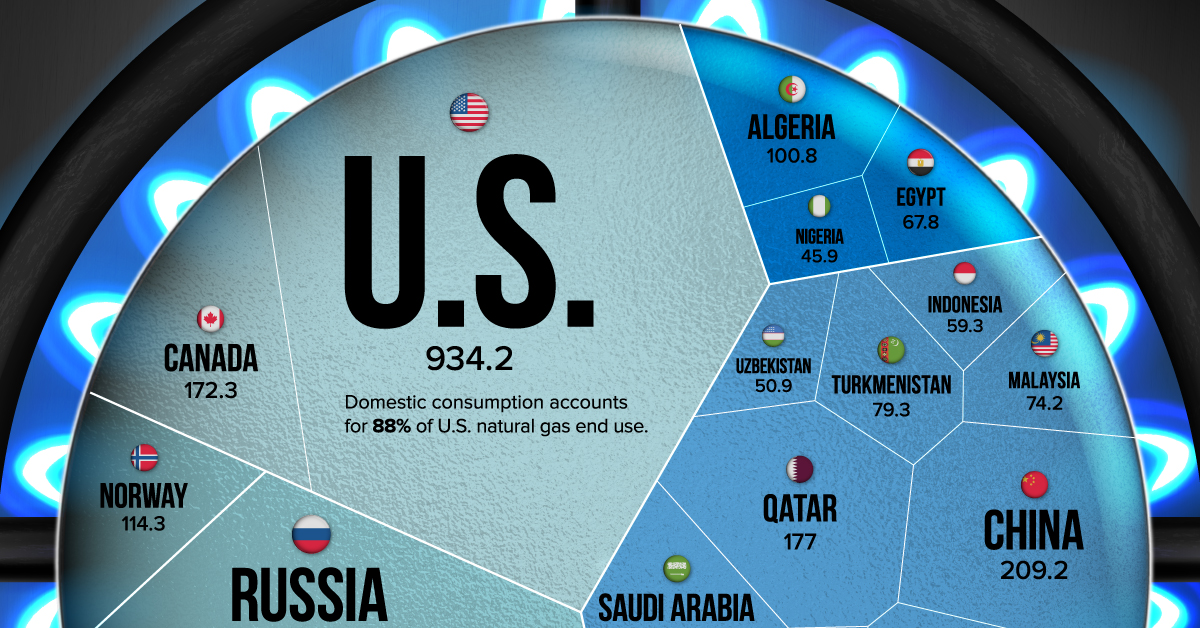
| #1 | 🇺🇸 United States | 934.2 | 23.1% |
| #2 | 🇷🇺 Russia | 701.7 | 17.4% |
| #3 | 🇮🇷 Iran | 256.7 | 6.4% |
| #4 | 🇨🇳 China | 209.2 | 5.2% |
| #5 | 🇶🇦 Qatar | 177.0 | 4.4% |
| #6 | 🇨🇦 Canada | 172.3 | 4.3% |
| #7 | 🇦🇺 Australia | 147.2 | 3.6% |
| #8 | 🇸🇦 Saudi Arabia | 117.3 | 2.9% |
| #9 | 🇳🇴 Norway | 114.3 | 2.8% |
| #10 | 🇩🇿 Algeria | 100.8 | 2.5% |
| #12 | 🇹🇲 Turkmenistan | 79.3 | 2.0% |
| #13 | 🇲🇾 Malaysia | 74.2 | 1.8% |
| #14 | 🇪🇬 Egypt | 67.8 | 1.7% |
| #15 | 🇮🇩 Indonesia | 59.3 | 1.5% |
| #16 | 🇦🇪 United Arab Emirates | 57.0 | 1.4% |
| #17 | 🇺🇿 Uzbekistan | 50.9 | 1.3% |
| #18 | 🇳🇬 Nigeria | 45.9 | 1.1% |
| 🌐 Rest of the World | 671.8 | 16.6% | |
| 🌐 Global Total | 4,036.9 | 100.0% |
Natural gas accounts for 32% of primary energy consumption in the United States, the world’s largest producer. Russia is the second biggest producer, and also has at least 37 trillion cubic meters of natural gas reserves, the most in the world.
China’s natural gas production grew by 7.8% in 2021, and it has nearly doubled since 2011. This sustained growth in production is partly down to government policies incentivizing coal-to-gas switching.
Europe’s Natural Gas Crisis
Russia has significantly reduced flows of natural gas to Europe since Western nations imposed sanctions on the Kremlin following the invasion of Ukraine. Before the war, the European Union (EU) imported about 40% of its natural gas from Russia.
The gas is transported by the Nord Stream system, a pair of offshore natural gas pipeline networks in Europe that run under the Baltic Sea from Russia to Germany.
Russian energy giant Gazprom recently halved the amount of natural gas flowing through the Nord Stream 1 pipeline to 20% of capacity, blaming Western sanctions for a delay in the delivery in a necessary turbine. EU officials say Russia is “weaponizing” its gas supply.
Amid tensions, the EU bloc outlined a plan to phase out dependence on Russian fossil fuels. Lithuania ceased Russian gas imports at the beginning of April. Estonia’s and Latvia’s imports also dropped to zero at the start of that month. Bulgaria, the Netherlands, and Poland all announced that they do not intend to renew long-term contracts with Gazprom.
Despite these efforts, Europe remains dependent on Russia for its supply of natural gas, at least in the short and medium term.


Energy
Charted: 4 Reasons Why Lithium Could Be the Next Gold Rush
Visual Capitalist has partnered with EnergyX to show why drops in prices and growing demand may make now the right time to invest in lithium.


4 Reasons Why You Should Invest in Lithium
Lithium’s importance in powering EVs makes it a linchpin of the clean energy transition and one of the world’s most precious minerals.
In this graphic, Visual Capitalist partnered with EnergyX to explore why now may be the time to invest in lithium.
1. Lithium Prices Have Dropped
One of the most critical aspects of evaluating an investment is ensuring that the asset’s value is higher than its price would indicate. Lithium is integral to powering EVs, and, prices have fallen fast over the last year:
| Date | LiOH·H₂O* | Li₂CO₃** |
|---|---|---|
| Feb 2023 | $76 | $71 |
| March 2023 | $71 | $61 |
| Apr 2023 | $43 | $33 |
| May 2023 | $43 | $33 |
| June 2023 | $47 | $45 |
| July 2023 | $44 | $40 |
| Aug 2023 | $35 | $35 |
| Sept 2023 | $28 | $27 |
| Oct 2023 | $24 | $23 |
| Nov 2023 | $21 | $21 |
| Dec 2023 | $17 | $16 |
| Jan 2024 | $14 | $15 |
| Feb 2024 | $13 | $14 |
Note: Monthly spot prices were taken as close to the 14th of each month as possible.
*Lithium hydroxide monohydrate MB-LI-0033
**Lithium carbonate MB-LI-0029
2. Lithium-Ion Battery Prices Are Also Falling
The drop in lithium prices is just one reason to invest in the metal. Increasing economies of scale, coupled with low commodity prices, have caused the cost of lithium-ion batteries to drop significantly as well.
In fact, BNEF reports that between 2013 and 2023, the price of a Li-ion battery dropped by 82%.
| Year | Price per KWh |
|---|---|
| 2023 | $139 |
| 2022 | $161 |
| 2021 | $150 |
| 2020 | $160 |
| 2019 | $183 |
| 2018 | $211 |
| 2017 | $258 |
| 2016 | $345 |
| 2015 | $448 |
| 2014 | $692 |
| 2013 | $780 |

3. EV Adoption is Sustainable
One of the best reasons to invest in lithium is that EVs, one of the main drivers behind the demand for lithium, have reached a price point similar to that of traditional vehicle.
According to the Kelly Blue Book, Tesla’s average transaction price dropped by 25% between 2022 and 2023, bringing it in line with many other major manufacturers and showing that EVs are a realistic transport option from a consumer price perspective.
| Manufacturer | September 2022 | September 2023 |
|---|---|---|
| BMW | $69,000 | $72,000 |
| Ford | $54,000 | $56,000 |
| Volkswagon | $54,000 | $56,000 |
| General Motors | $52,000 | $53,000 |
| Tesla | $68,000 | $51,000 |
4. Electricity Demand in Transport is Growing
As EVs become an accessible transport option, there’s an investment opportunity in lithium. But possibly the best reason to invest in lithium is that the IEA reports global demand for the electricity in transport could grow dramatically by 2030:
| Transport Type | 2022 | 2025 | 2030 |
|---|---|---|---|
| Buses 🚌 | 23,000 GWh | 50,000 GWh | 130,000 GWh |
| Cars 🚙 | 65,000 GWh | 200,000 GWh | 570,000 GWh |
| Trucks 🛻 | 4,000 GWh | 15,000 GWh | 94,000 GWh |
| Vans 🚐 | 6,000 GWh | 16,000 GWh | 72,000 GWh |
The Lithium Investment Opportunity
Lithium presents a potentially classic investment opportunity. Lithium and battery prices have dropped significantly, and recently, EVs have reached a price point similar to other vehicles. By 2030, the demand for clean energy, especially in transport, will grow dramatically.
With prices dropping and demand skyrocketing, now is the time to invest in lithium.
EnergyX is poised to exploit lithium demand with cutting-edge lithium extraction technology capable of extracting 300% more lithium than current processes.

-

 Lithium5 days ago
Ranked: The Top 10 EV Battery Manufacturers in 2023
Asia dominates this ranking of the world’s largest EV battery manufacturers in 2023.
-

 Energy1 week ago
The World’s Biggest Nuclear Energy Producers
China has grown its nuclear capacity over the last decade, now ranking second on the list of top nuclear energy producers.
-

 Energy1 month ago
The World’s Biggest Oil Producers in 2023
Just three countries accounted for 40% of global oil production last year.
-

 Energy1 month ago
How Much Does the U.S. Depend on Russian Uranium?
Currently, Russia is the largest foreign supplier of nuclear power fuel to the U.S.
-

 Uranium2 months ago
Charted: Global Uranium Reserves, by Country
We visualize the distribution of the world’s uranium reserves by country, with 3 countries accounting for more than half of total reserves.
-

 Energy3 months ago
Visualizing the Rise of the U.S. as Top Crude Oil Producer
Over the last decade, the United States has established itself as the world’s top producer of crude oil, surpassing Saudi Arabia and Russia.

-

 Debt1 week ago
How Debt-to-GDP Ratios Have Changed Since 2000
-

 Markets2 weeks ago
Ranked: The World’s Top Flight Routes, by Revenue
-

 Countries2 weeks ago
Population Projections: The World’s 6 Largest Countries in 2075
-

 Markets2 weeks ago
The Top 10 States by Real GDP Growth in 2023
-

 Demographics2 weeks ago
The Smallest Gender Wage Gaps in OECD Countries
-

 United States2 weeks ago
Where U.S. Inflation Hit the Hardest in March 2024
-

 Green2 weeks ago
Top Countries By Forest Growth Since 2001
-

 United States2 weeks ago
Ranked: The Largest U.S. Corporations by Number of Employees