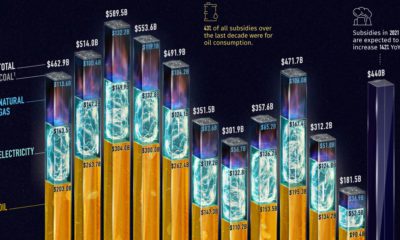

Governments pour nearly $500 billion into fossil fuel subsidies annually. This chart breaks down fossil fuel subsidies between 2010 and 2021.
Nuclear power accounted for 10% of global electricity generated in 2020. Here's a look at the largest nuclear power producers.
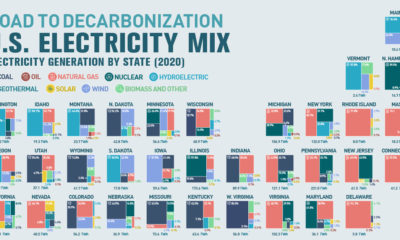

Can America become carbon-free by 2035? This graphic breaks down the United States’ electricity mix, by state.
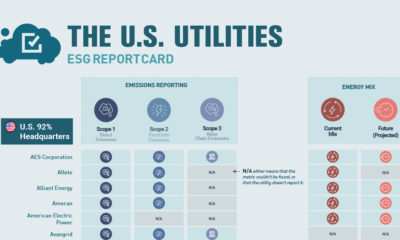

This graphic acts as an ESG report card that tracks the ESG metrics reported by different utilities in the U.S.—what gets left out?
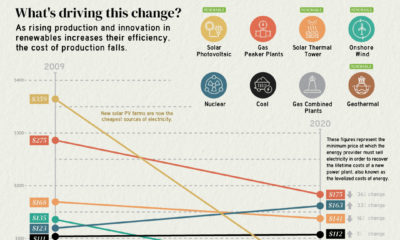

The cost of electricity from solar PV plants has decreased by 90% since 2009, highlighting the rapidly changing economics of electricity production.
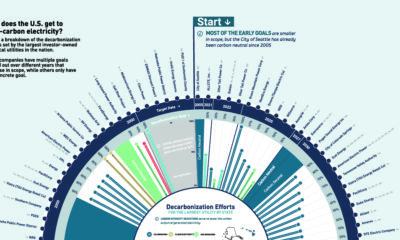

How are utilities reducing carbon emissions? Here are the decarbonization targets of the largest U.S. utilities.
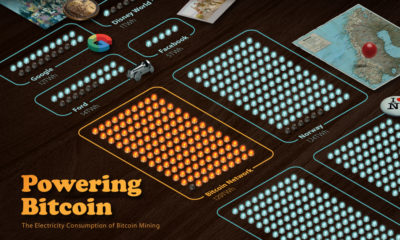

Bitcoin mining requires significant amounts of energy, but what does this consumption look like when compared to countries and companies?
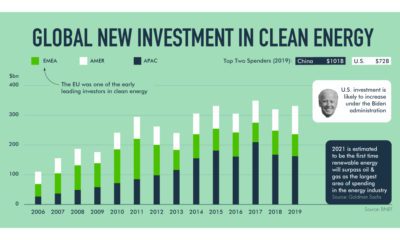

How is the renewable energy shift unfolding? This exploration highlights the market and governmental forces in action.
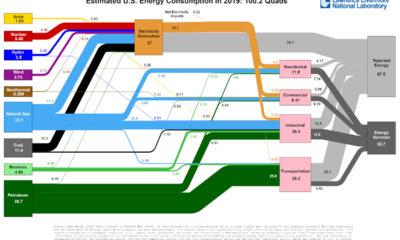

This incredible flow diagram shows how U.S. energy use broke down in 2019, including by source and end sector.
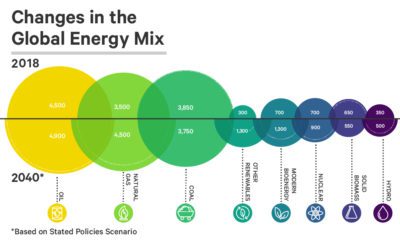

See how the world's future energy mix is expected to change by 2040, using projections based on two different policy scenarios.


