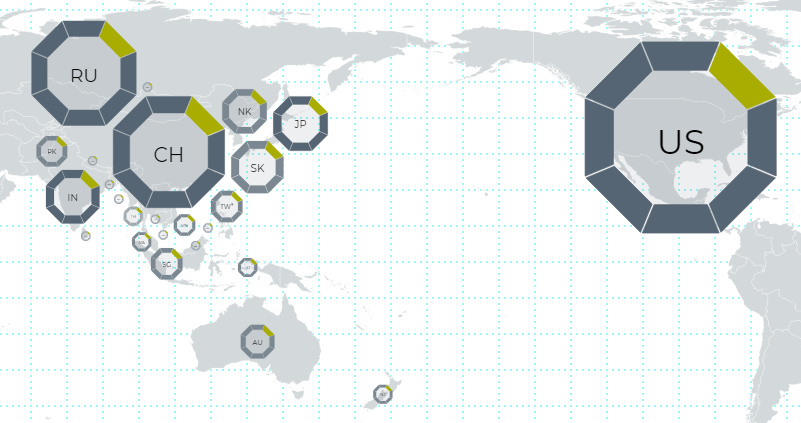
This interactive map uses 114 metrics to measure the geopolitical power and influence of 25 countries, focusing on Asian powers and the United States.
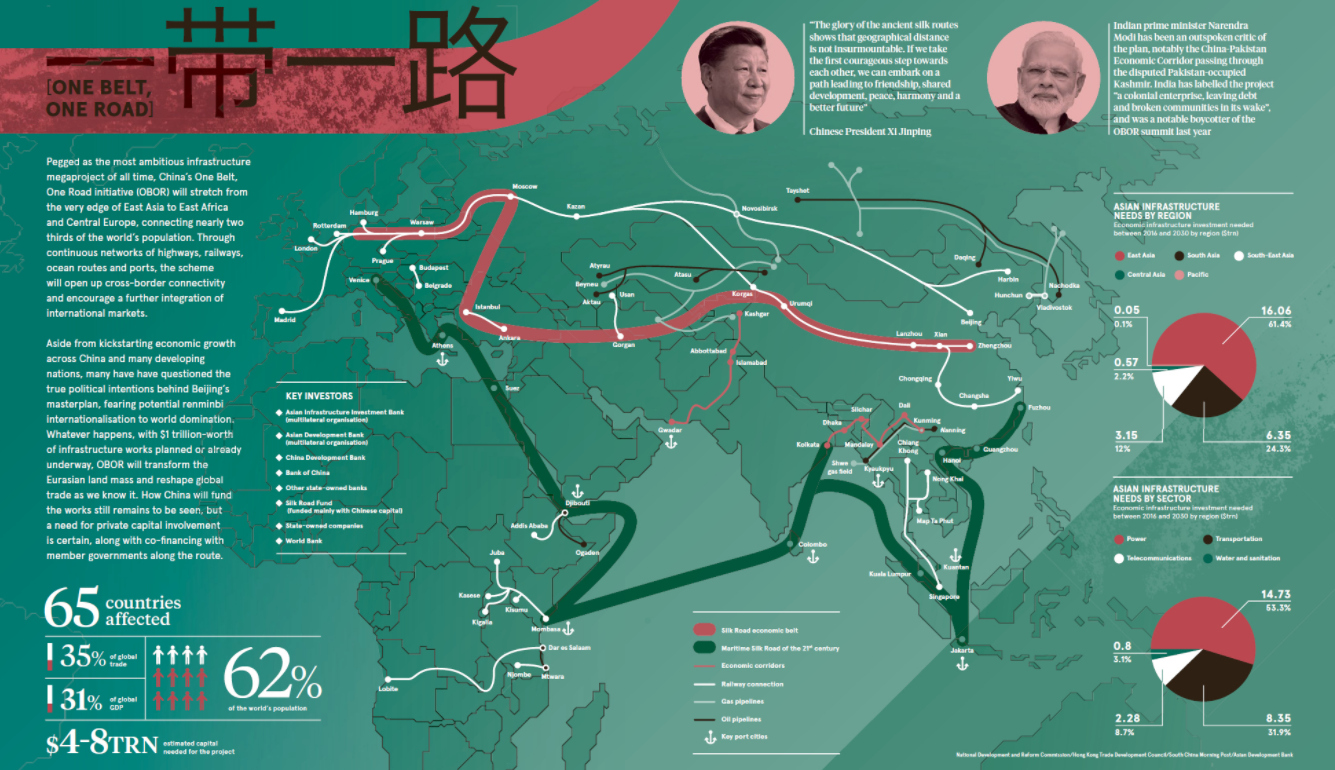
China's One Belt One Road (OBOR) initiative will cost $4-8 trillion, affecting 62% of the world's population. See all about the megaproject in this graphic.
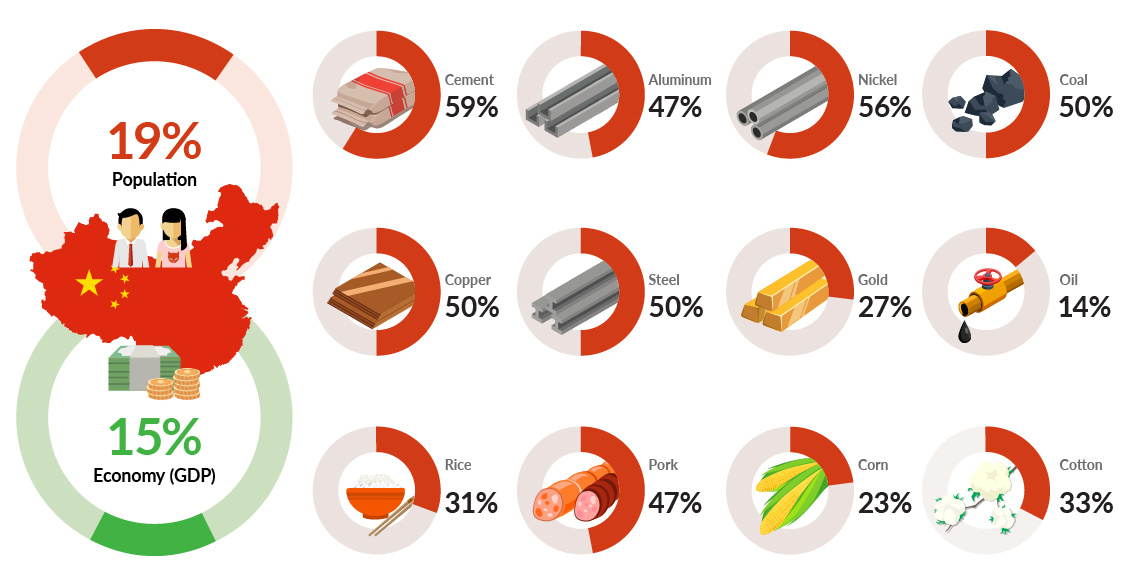
China uses more steel, cement, copper, nickel, and coal than the rest of the world combined. This chart shows China's incredible demand for commodities.
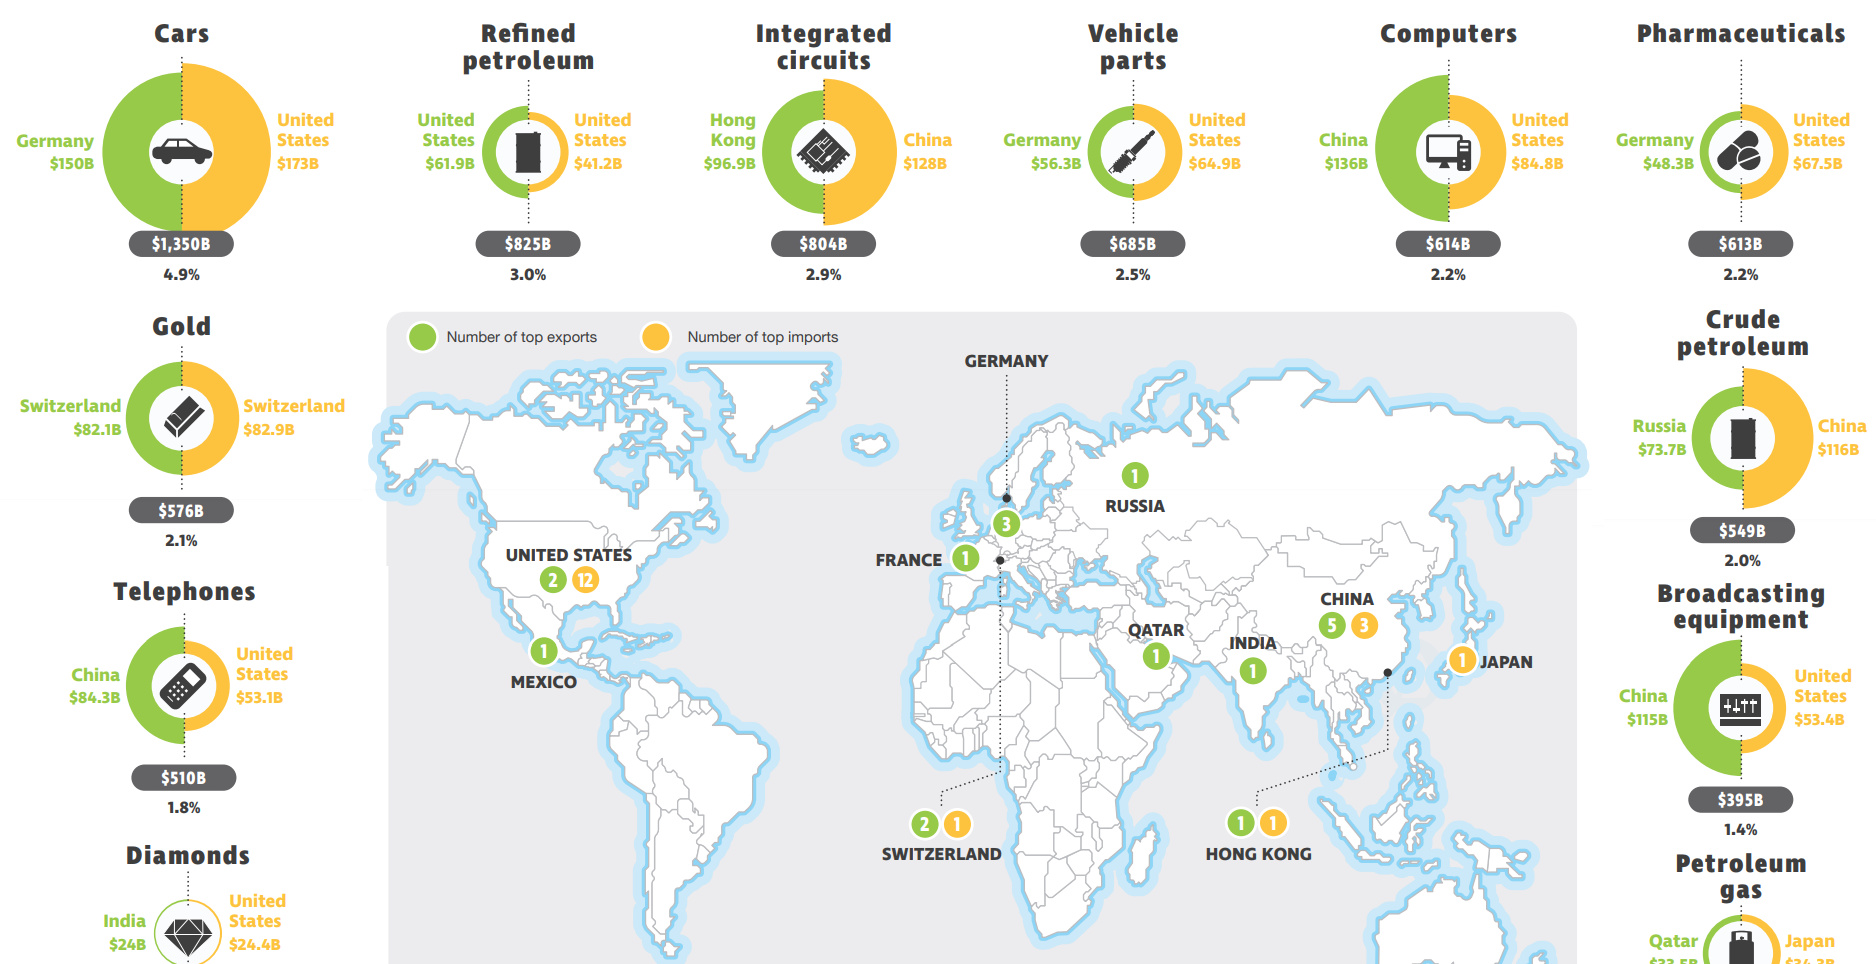
What are the most traded goods in the world? This map shows the 18 top goods, as well as the biggest importer and exporter of each...
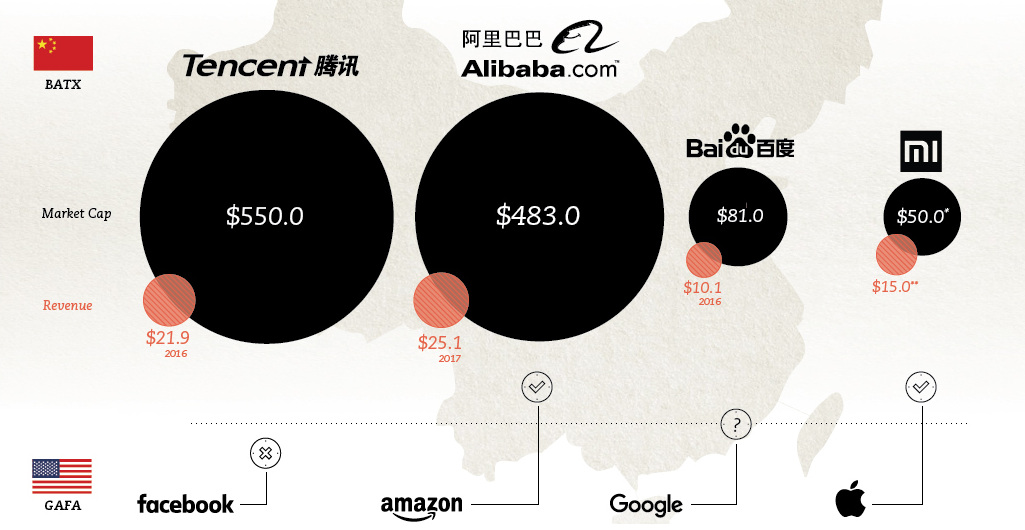
The fast-growing tech giants in China look recognizably familiar - but markedly different - to the ones we know so well in Silicon Valley.
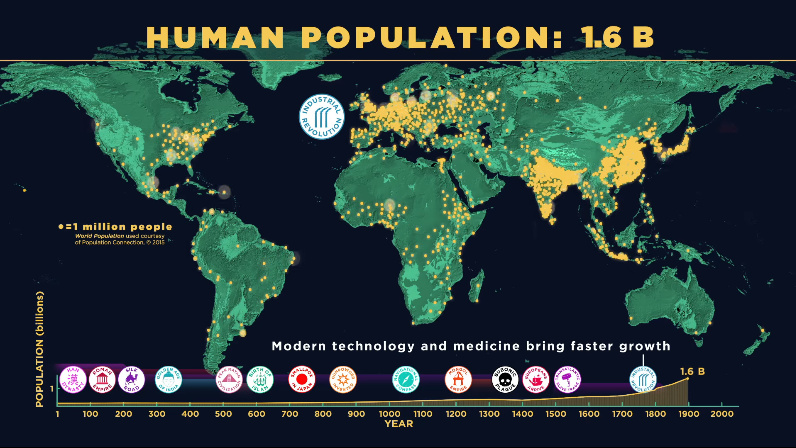
This animation captures 200,000 years of human population growth - see everything from the invention of farming to the impact of the Black Death.
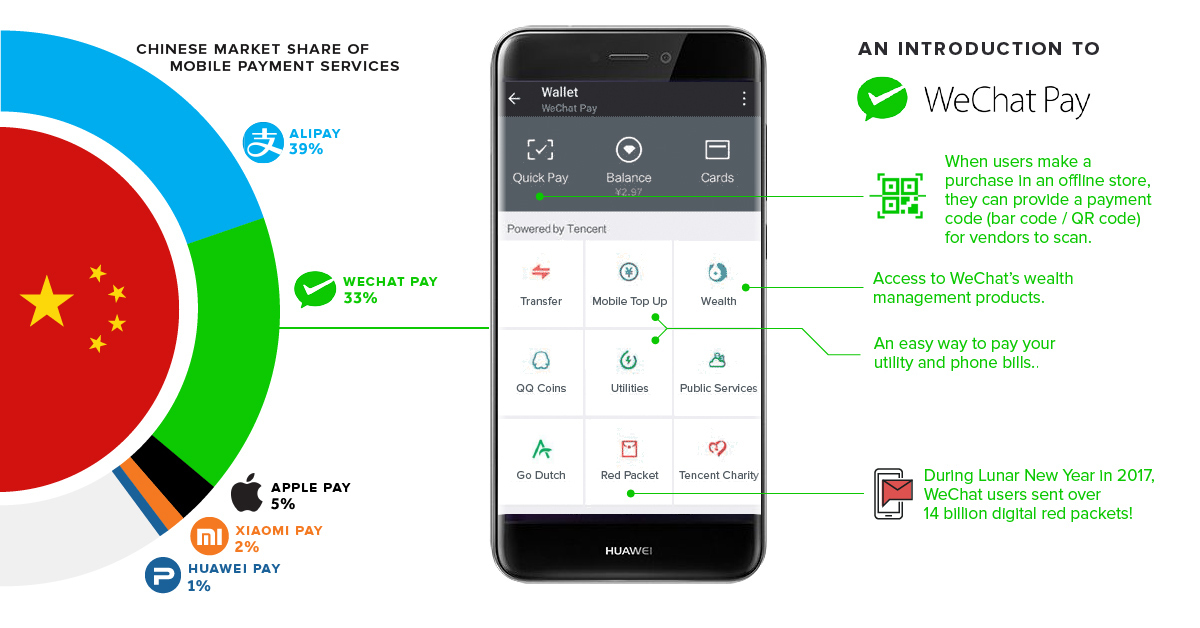
Chinese consumers buy 11x more via digital wallets than U.S. consumers - so if you want to understand the future of mobile payments, see WeChat and...
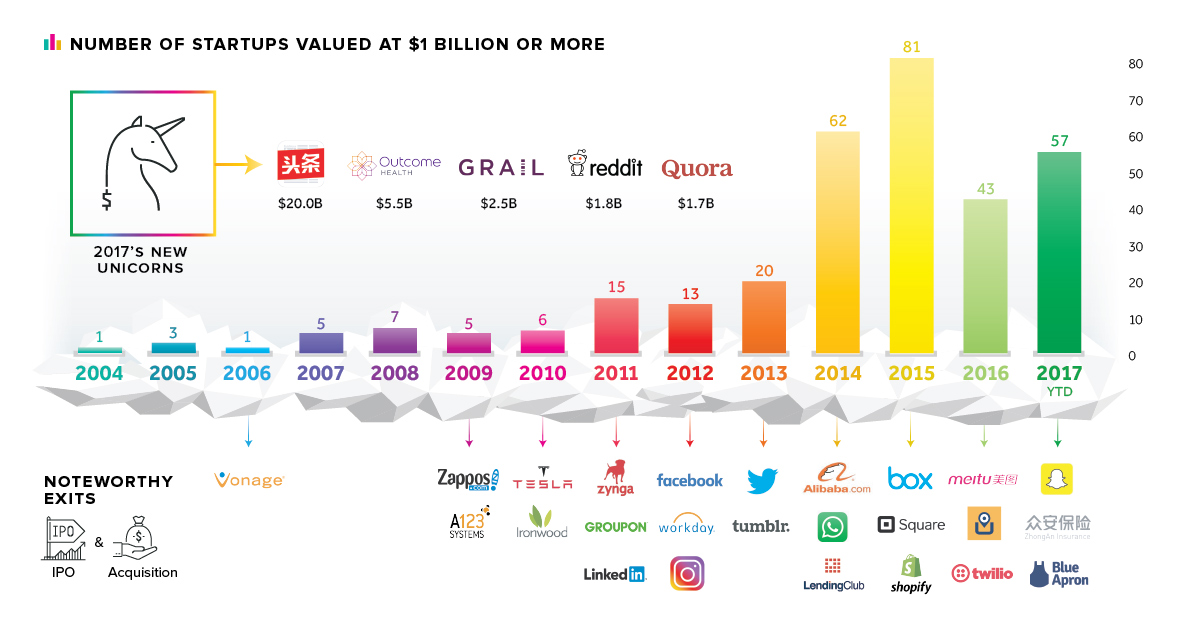
Total new unicorns in 2017 is down from its frothy peak - but this year brings several interesting new entrants, like China's Toutiao, valued at a...
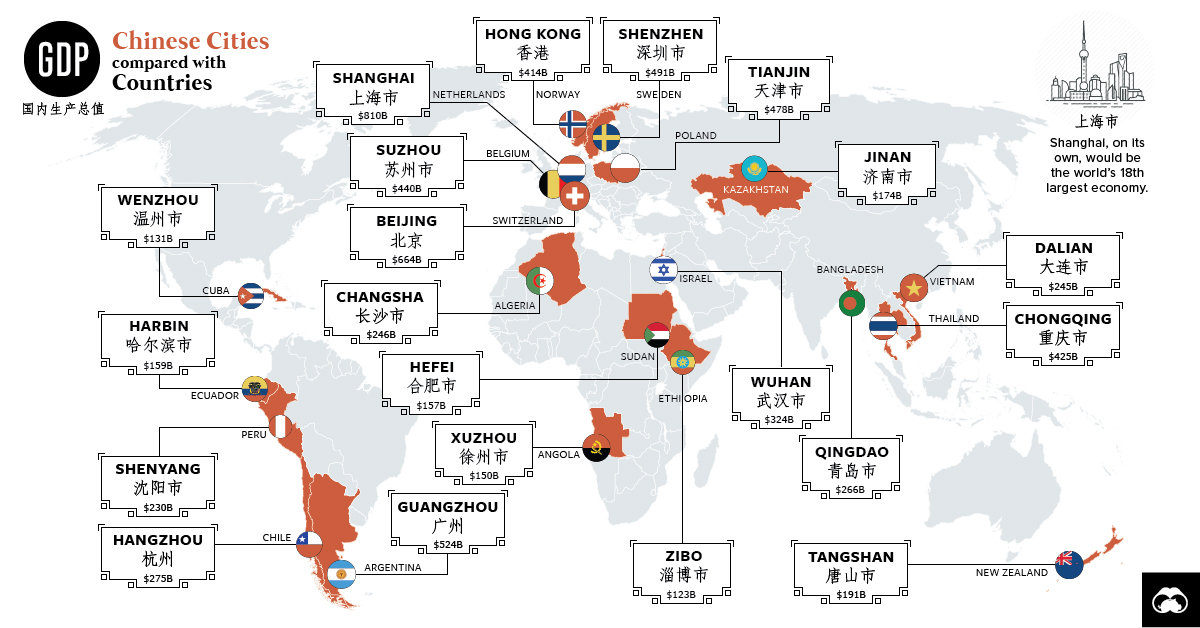
You've probably heard of Chinese cities like Beijing, Hong Kong, and Shanghai - but those actually only scratch the surface of China's economic picture.
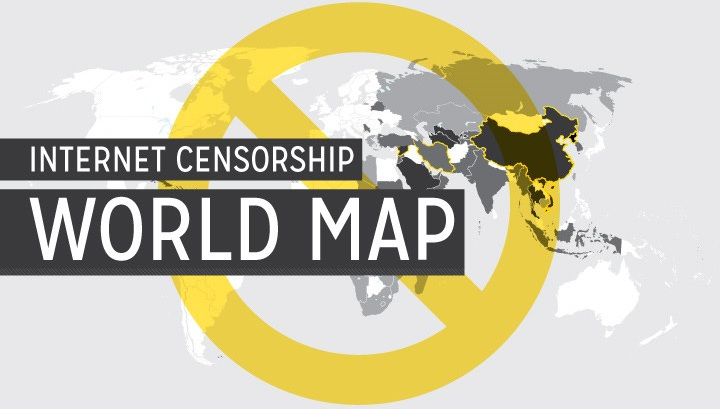
Much of the world’s population surfs an internet that is at least partially censored, and this map shows to which degree that is true for every...


