Markets
The Top Importers and Exporters of the World’s 18 Most Traded Goods
View a high resolution version of this graphic
The Top Importers and Exporters of the World’s 18 Most Traded Goods
View the high resolution version of today’s graphic by clicking here.
Every day, massive quantities of goods get traded on the global market.
These goods can be entirely customized and unique, but more often they are things like commodities or bulk goods that get moved around on huge container ships from country to country. Included in this latter category would be common exports like crude oil, automobiles, iron ore, pharmaceuticals, and smartphones.
Which goods get traded the most, and what countries play the most important roles in these deals?
The Most Traded Goods
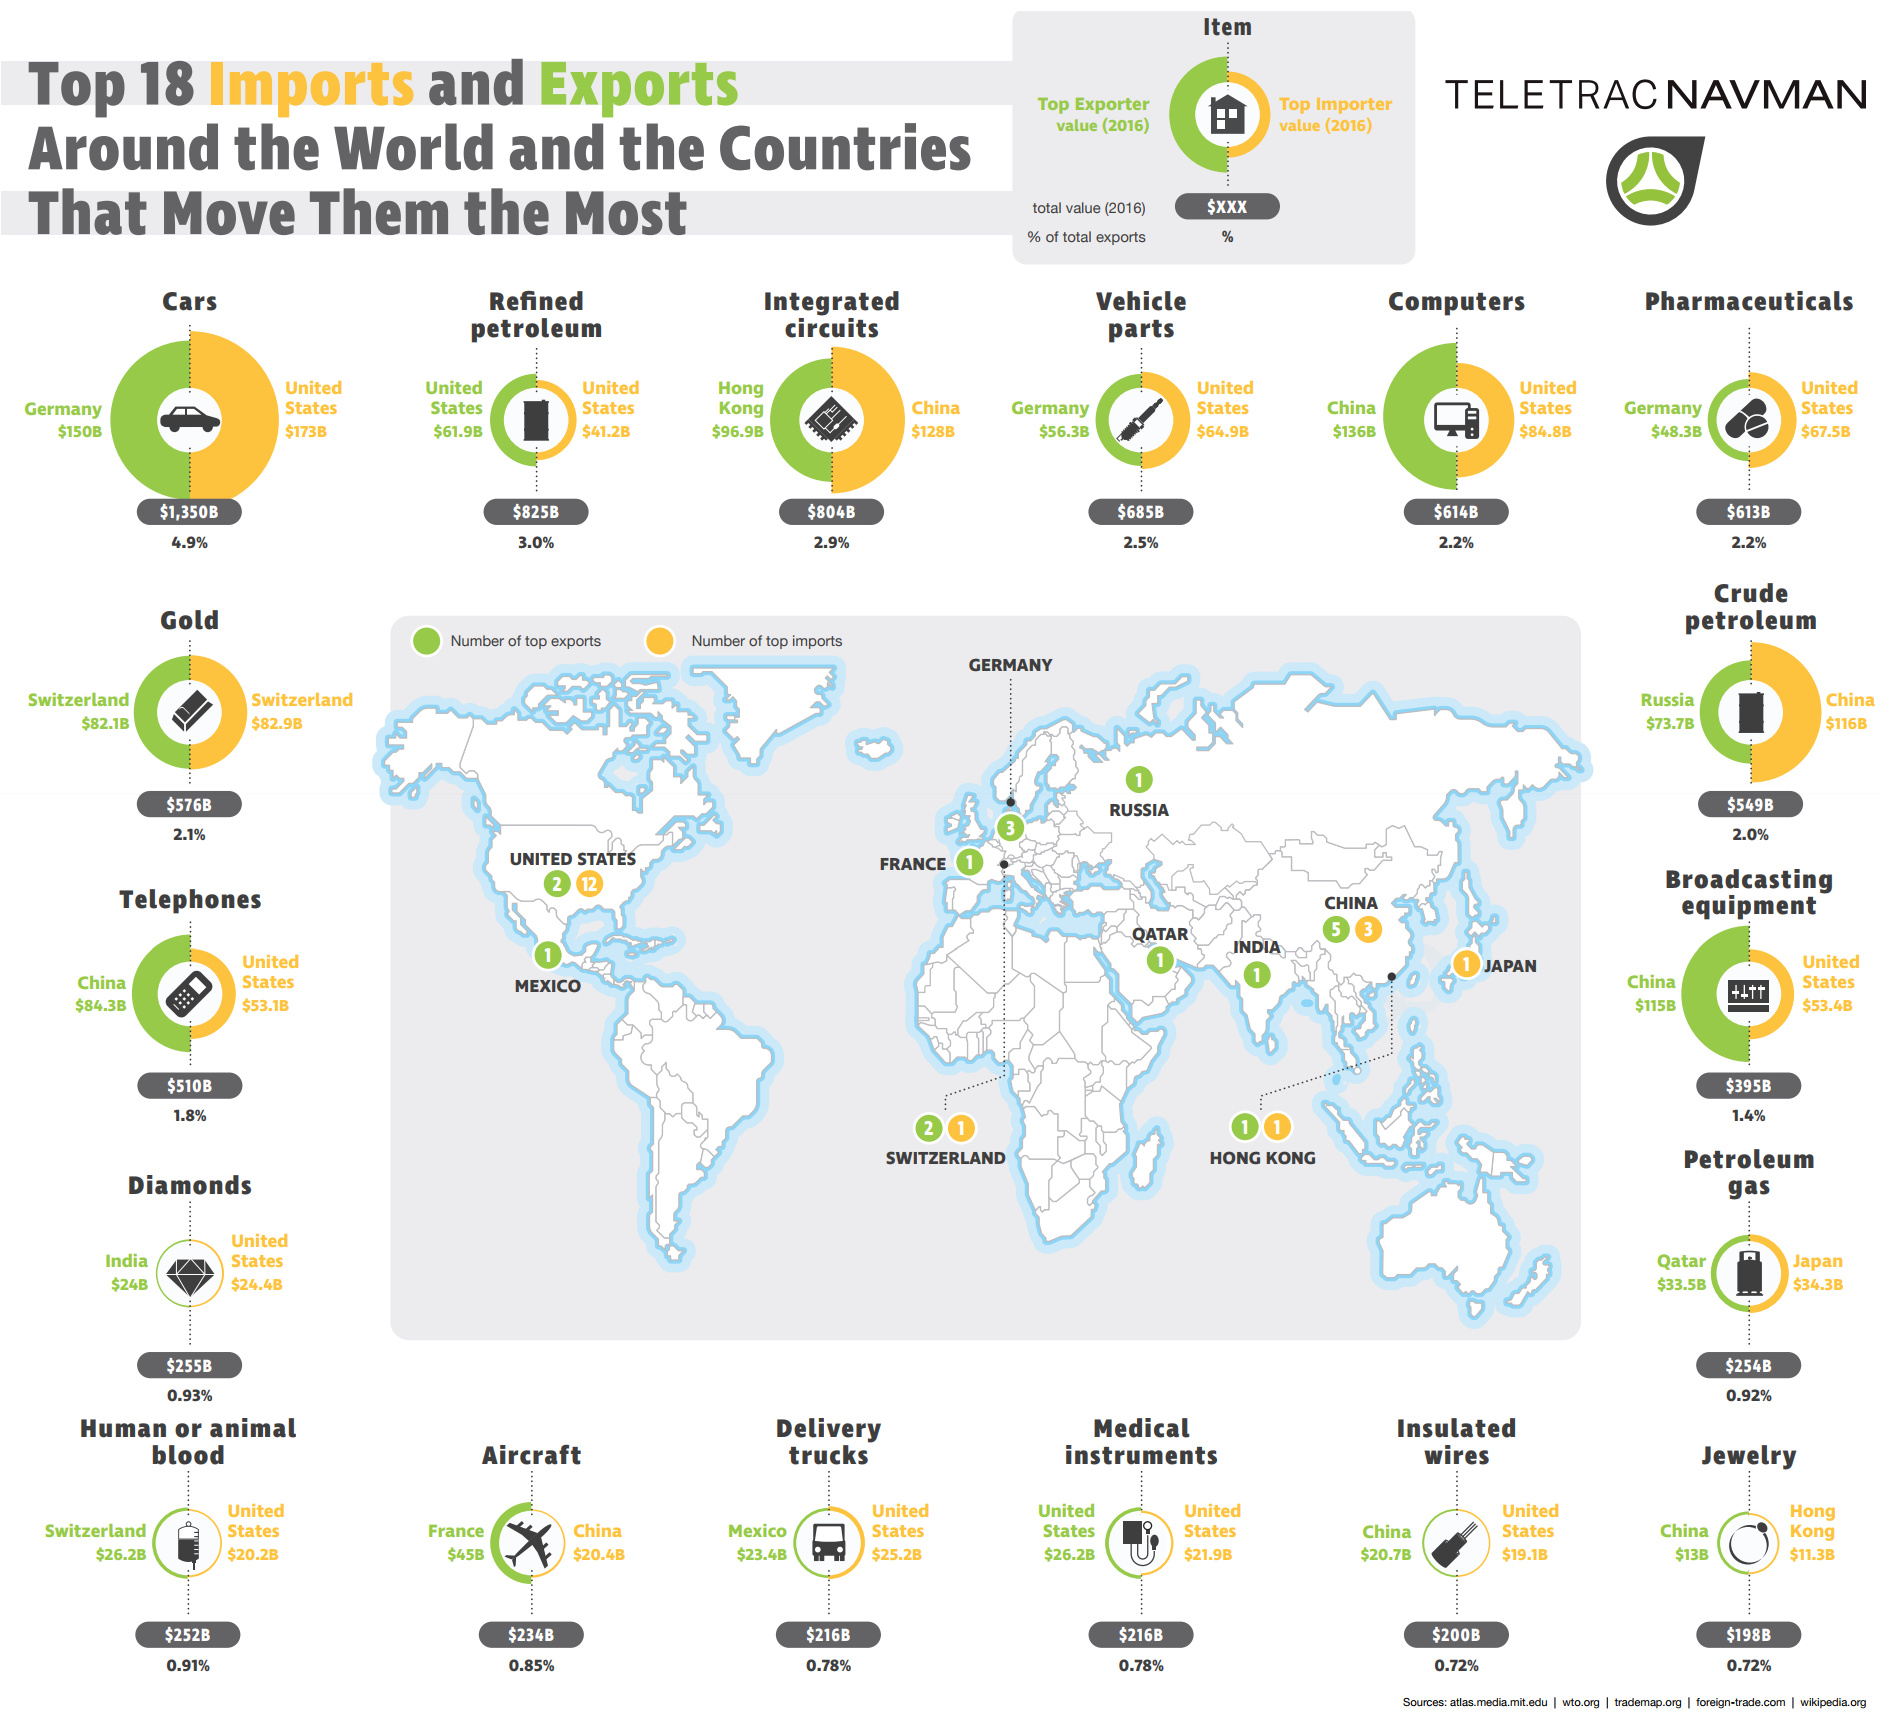
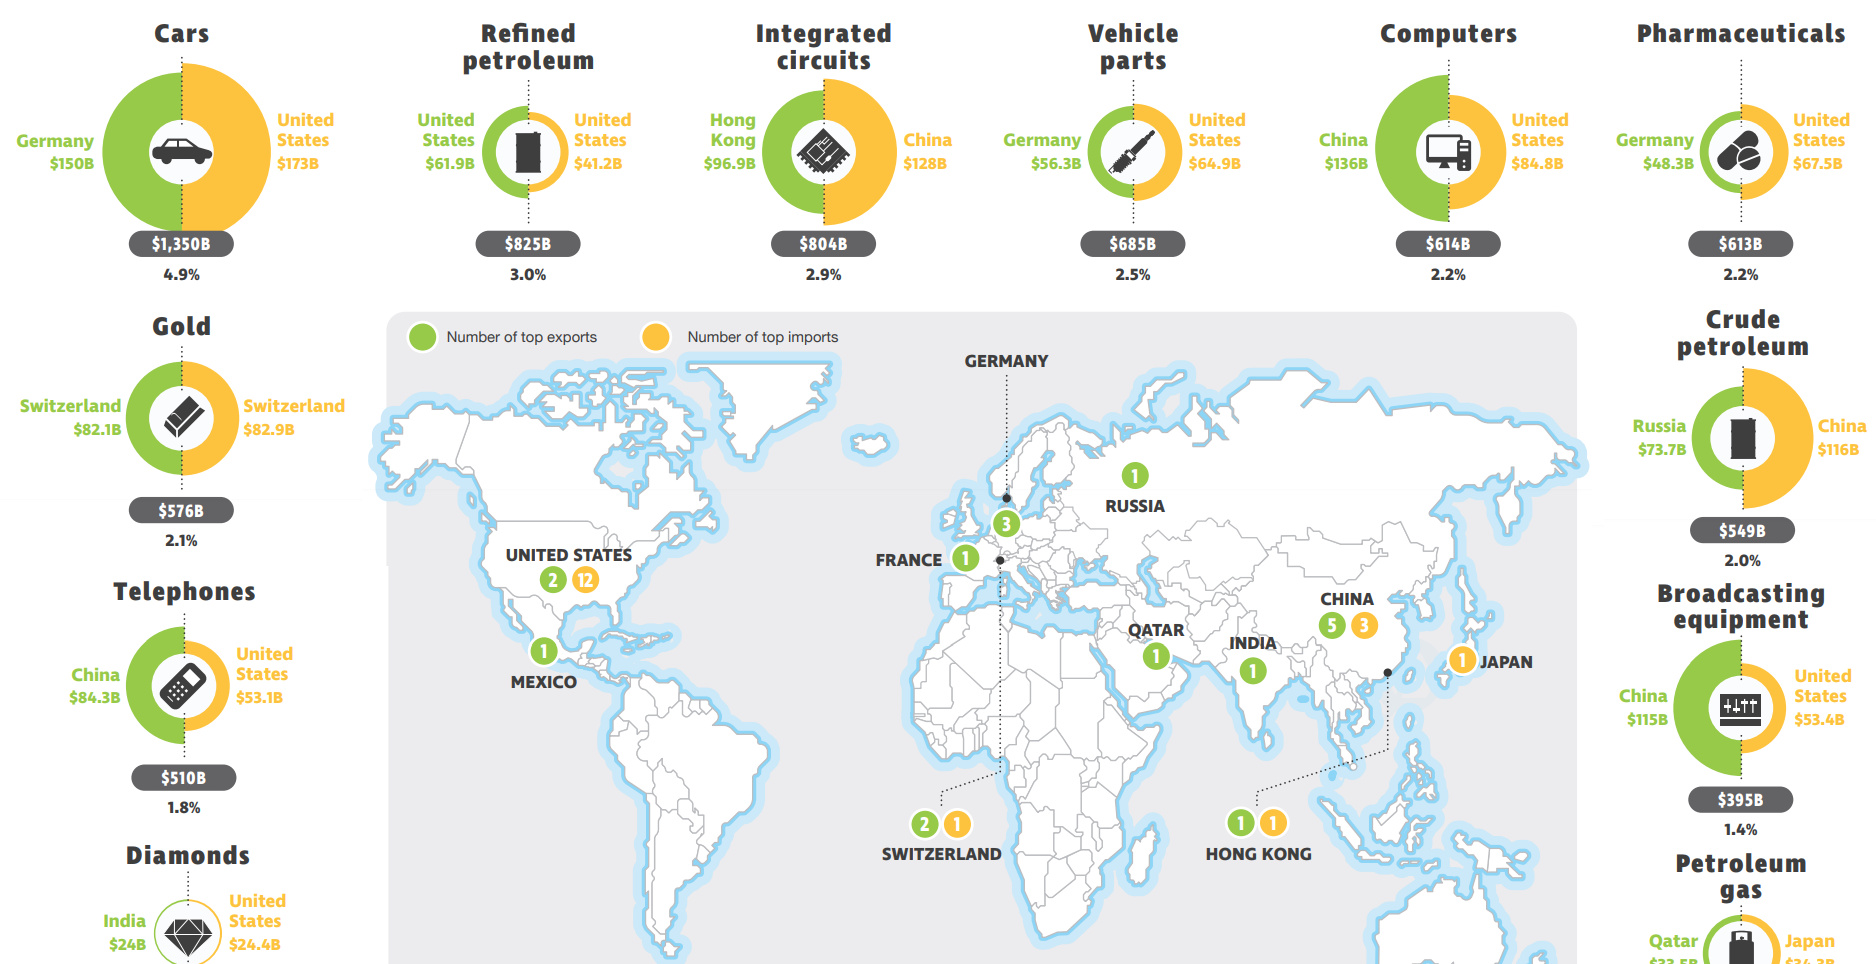
Today’s infographic comes to us from Teletrac Navman and it covers the world’s 18 most traded goods, as well as the top importer and exporter for each good.
Here are the good categories, along with the total dollar value and percentage of total exports that each category represents on the global market.
| Rank | Category of Good | Total Value (2016) | % of Total Global Exports |
|---|---|---|---|
| #1 | Cars | $1,350 billion | 4.9% |
| #2 | Refined Petroleum | $825 billion | 3.0% |
| #3 | Integrated Circuits | $804 billion | 2.9% |
| #4 | Vehicle Parts | $685 billion | 2.5% |
| #5 | Computers | $614 billion | 2.2% |
| #6 | Pharmaceuticals | $613 billion | 2.2% |
| #7 | Gold | $576 billion | 2.1% |
| #8 | Crude Petroleum | $549 billion | 2.0% |
| #9 | Telephones | $510 billion | 1.8% |
| #10 | Broadcasting Equipment | $395 billion | 1.4% |
| #11 | Diamonds | $255 billion | 0.9% |
| #12 | Petroleum Gas | $254 billion | 0.9% |
| #13 | Human or Animal Blood | $252 billion | 0.9% |
| #14 | Aircraft | $234 billion | 0.9% |
| #15 | Delivery Trucks | $216 billion | 0.8% |
| #16 | Medical Instruments | $216 billion | 0.8% |
| #17 | Insulated Wires | $200 billion | 0.7% |
| #18 | Jewelry | $198 billion | 0.7% |
Finished automobiles are the top good traded worldwide with $1.35 trillion being traded each year between countries. Auto parts are not far behind in the #4 spot with $685 billion of trade.
Oil also stands out as a key commodity: refined petroleum ranks #2 with $825 billion of trade, while crude petroleum and petroleum gas are at #8 and #12, for $549 billion and $254 billion traded, respectively.
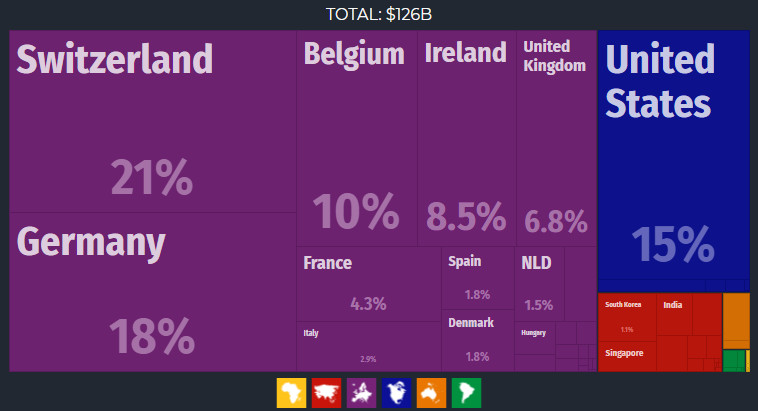
Finally, an odd standout is the category of human and animal blood – which apparently sees $252 billion in aggregate international trade each year.
In case you were wondering, here are the top exporters of human and animal blood:
Key Importers and Exporters
The United States is the biggest importer for 12 of the 18 trade categories, including the largest ones: automobiles and refined petroleum.
Interestingly, the U.S. is also the largest exporter of two of the goods that it is a top importer of: refined petroleum and medical equipment. This is because both are highly specialized categories – the U.S. may import one grade of refined oil at a low cost, while simultaneously exporting a higher or more specialized grade of oil at a premium.
Germany is a top exporter of autos, vehicle parts, and pharmaceuticals, while Switzerland is the number one importer and exporter of gold.
Lastly, China is the biggest exporter for five of the 18 trade categories: computers, broadcasting equipment, telephones, insulated wires, and jewelry, while being the largest importer of crude oil, integrated circuits, and aircraft.


Markets
The European Stock Market: Attractive Valuations Offer Opportunities
On average, the European stock market has valuations that are nearly 50% lower than U.S. valuations. But how can you access the market?


European Stock Market: Attractive Valuations Offer Opportunities
Europe is known for some established brands, from L’Oréal to Louis Vuitton. However, the European stock market offers additional opportunities that may be lesser known.
The above infographic, sponsored by STOXX, outlines why investors may want to consider European stocks.
Attractive Valuations
Compared to most North American and Asian markets, European stocks offer lower or comparable valuations.
| Index | Price-to-Earnings Ratio | Price-to-Book Ratio |
|---|---|---|
| EURO STOXX 50 | 14.9 | 2.2 |
| STOXX Europe 600 | 14.4 | 2 |
| U.S. | 25.9 | 4.7 |
| Canada | 16.1 | 1.8 |
| Japan | 15.4 | 1.6 |
| Asia Pacific ex. China | 17.1 | 1.8 |
Data as of February 29, 2024. See graphic for full index names. Ratios based on trailing 12 month financials. The price to earnings ratio excludes companies with negative earnings.
On average, European valuations are nearly 50% lower than U.S. valuations, potentially offering an affordable entry point for investors.
Research also shows that lower price ratios have historically led to higher long-term returns.
Market Movements Not Closely Connected
Over the last decade, the European stock market had low-to-moderate correlation with North American and Asian equities.
The below chart shows correlations from February 2014 to February 2024. A value closer to zero indicates low correlation, while a value of one would indicate that two regions are moving in perfect unison.
| EURO STOXX 50 | STOXX EUROPE 600 | U.S. | Canada | Japan | Asia Pacific ex. China |
|
|---|---|---|---|---|---|---|
| EURO STOXX 50 | 1.00 | 0.97 | 0.55 | 0.67 | 0.24 | 0.43 |
| STOXX EUROPE 600 | 1.00 | 0.56 | 0.71 | 0.28 | 0.48 | |
| U.S. | 1.00 | 0.73 | 0.12 | 0.25 | ||
| Canada | 1.00 | 0.22 | 0.40 | |||
| Japan | 1.00 | 0.88 | ||||
| Asia Pacific ex. China | 1.00 |
Data is based on daily USD returns.
European equities had relatively independent market movements from North American and Asian markets. One contributing factor could be the differing sector weights in each market. For instance, technology makes up a quarter of the U.S. market, but health care and industrials dominate the broader European market.
Ultimately, European equities can enhance portfolio diversification and have the potential to mitigate risk for investors.
Tracking the Market
For investors interested in European equities, STOXX offers a variety of flagship indices:
| Index | Description | Market Cap |
|---|---|---|
| STOXX Europe 600 | Pan-regional, broad market | €10.5T |
| STOXX Developed Europe | Pan-regional, broad-market | €9.9T |
| STOXX Europe 600 ESG-X | Pan-regional, broad market, sustainability focus | €9.7T |
| STOXX Europe 50 | Pan-regional, blue-chip | €5.1T |
| EURO STOXX 50 | Eurozone, blue-chip | €3.5T |
Data is as of February 29, 2024. Market cap is free float, which represents the shares that are readily available for public trading on stock exchanges.
The EURO STOXX 50 tracks the Eurozone’s biggest and most traded companies. It also underlies one of the world’s largest ranges of ETFs and mutual funds. As of November 2023, there were €27.3 billion in ETFs and €23.5B in mutual fund assets under management tracking the index.
“For the past 25 years, the EURO STOXX 50 has served as an accurate, reliable and tradable representation of the Eurozone equity market.”
— Axel Lomholt, General Manager at STOXX
Partnering with STOXX to Track the European Stock Market
Are you interested in European equities? STOXX can be a valuable partner:
- Comprehensive, liquid and investable ecosystem
- European heritage, global reach
- Highly sophisticated customization capabilities
- Open architecture approach to using data
- Close partnerships with clients
- Part of ISS STOXX and Deutsche Börse Group
With a full suite of indices, STOXX can help you benchmark against the European stock market.
Learn how STOXX’s European indices offer liquid and effective market access.

-

 Economy3 days ago
Economic Growth Forecasts for G7 and BRICS Countries in 2024
The IMF has released its economic growth forecasts for 2024. How do the G7 and BRICS countries compare?
-

 Markets2 weeks ago
U.S. Debt Interest Payments Reach $1 Trillion
U.S. debt interest payments have surged past the $1 trillion dollar mark, amid high interest rates and an ever-expanding debt burden.
-

 United States2 weeks ago
Ranked: The Largest U.S. Corporations by Number of Employees
We visualized the top U.S. companies by employees, revealing the massive scale of retailers like Walmart, Target, and Home Depot.
-

 Markets2 weeks ago
The Top 10 States by Real GDP Growth in 2023
This graphic shows the states with the highest real GDP growth rate in 2023, largely propelled by the oil and gas boom.
-

 Markets3 weeks ago
Ranked: The World’s Top Flight Routes, by Revenue
In this graphic, we show the highest earning flight routes globally as air travel continued to rebound in 2023.
-

 Markets3 weeks ago
Ranked: The Most Valuable Housing Markets in America
The U.S. residential real estate market is worth a staggering $47.5 trillion. Here are the most valuable housing markets in the country.


-

 Debt1 week ago
How Debt-to-GDP Ratios Have Changed Since 2000
-

 Countries2 weeks ago
Population Projections: The World’s 6 Largest Countries in 2075
-
Markets2 weeks ago
The Top 10 States by Real GDP Growth in 2023
-

 Demographics2 weeks ago
The Smallest Gender Wage Gaps in OECD Countries
-

 United States2 weeks ago
Where U.S. Inflation Hit the Hardest in March 2024
-

 Green2 weeks ago
Top Countries By Forest Growth Since 2001
-
United States2 weeks ago
Ranked: The Largest U.S. Corporations by Number of Employees
-

 Maps2 weeks ago
The Largest Earthquakes in the New York Area (1970-2024)