Misc
The Data Behind Surging NBA Team Valuations

At the beginning of this decade, the NBA was not on firm footing. More than half of the league’s teams were losing money, and negotiations on a new collective bargaining agreement were looming.
Today, however, the NBA has undeniable momentum, buoyed by hefty broadcast agreements and superstars like LeBron James and Steph Curry. With interest in the NFL flagging in the U.S., professional basketball appears to be seizing the opportunity to win over sports fans and grow the popularity of the league.
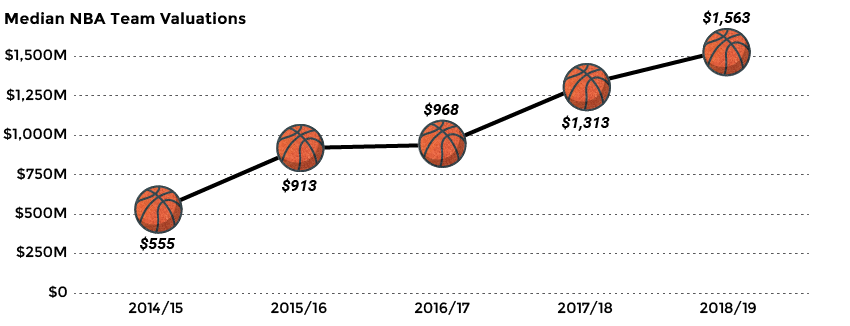
This momentum has pushed team valuations to new heights, with the median team now being worth a solid $1.56 billion.
What are the exact valuations of individual franchises in the league, and how are these values derived? Let’s dig into Forbes’ annual NBA Valuations Ranking to learn more.
Breaking down team value
Forbes has broken down the value of an NBA team valuations into four components:
Sport: The revenue shared equally among all teams in the league
Market: City and market size
Arena: Revenues from sources such as attendance and premium seating
Brand: The actual value of the team’s brand
Every single team in the NBA is now valued at over $1 billion, and all but one team (the Cavaliers) were profitable last year.
For teams like the Knicks and Lakers, it’s easy to see how their huge market size contributes to their sky-high valuations. The former is currently the second-most-valuable sports franchise in America, tied with the New York Yankees.
While the biggest teams are worth more than double the NBA median value, the rising tide appears to be lifting all boats. The median team value has risen steadily and is up nearly 200% since 2014.
Gold Rush
The biggest story in basketball over recent years has been the ascension of the Golden State Warriors.
Making the NBA finals four seasons in a row – and winning three of those match-ups – has had a massive impact on the team’s value, which has shot up 367% over the last five years. As the team moves to the brand new Chase Center next season, Golden State may even have a shot at surpassing the Knicks or Lakers in overall valuation.
Here are the top five gainers over the past five years:

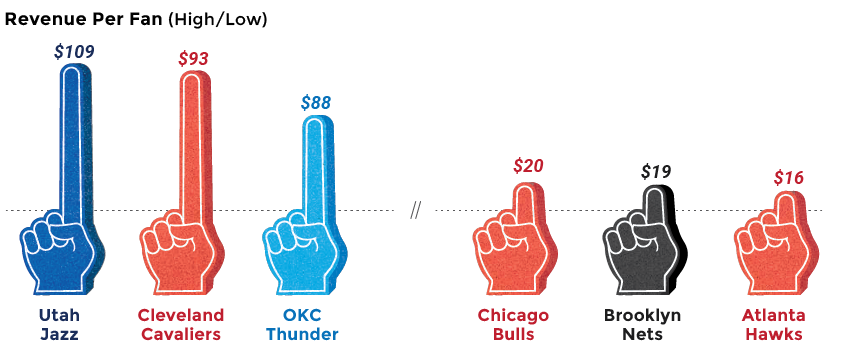
Fan Power
The teams with the highest revenue-per-fan are typically in smaller markets like Salt Lake City and Oklahoma City, though both cities are unique in that an NBA franchise is their only professional sports team.
The struggling Chicago Bulls comes in near the bottom by revenue-per-fan, despite being the fourth most valuable team in the league.
Shifting Gravity
In recent years, LeBron James has been one of the most electrifying personalities in professional sports, however, his influence on the NBA is now proving to be a double-edged sword. Since LeBron moved time zones from Cleveland to Los Angeles, NBA viewership is down – a dip that is particularly pronounced during the earlier Eastern Conference time slot.
Despite the slight dip in viewership, NBA teams are more profitable than they’ve ever been, and as the NBA turns its sights eastward to China, today’s valuations may seem modest in a few years time.


VC+
VC+: Get Our Key Takeaways From the IMF’s World Economic Outlook
A sneak preview of the exclusive VC+ Special Dispatch—your shortcut to understanding IMF’s World Economic Outlook report.

Have you read IMF’s latest World Economic Outlook yet? At a daunting 202 pages, we don’t blame you if it’s still on your to-do list.
But don’t worry, you don’t need to read the whole April release, because we’ve already done the hard work for you.
To save you time and effort, the Visual Capitalist team has compiled a visual analysis of everything you need to know from the report—and our VC+ Special Dispatch is available exclusively to VC+ members. All you need to do is log into the VC+ Archive.
If you’re not already subscribed to VC+, make sure you sign up now to access the full analysis of the IMF report, and more (we release similar deep dives every week).
For now, here’s what VC+ members get to see.
Your Shortcut to Understanding IMF’s World Economic Outlook
With long and short-term growth prospects declining for many countries around the world, this Special Dispatch offers a visual analysis of the key figures and takeaways from the IMF’s report including:
- The global decline in economic growth forecasts
- Real GDP growth and inflation forecasts for major nations in 2024
- When interest rate cuts will happen and interest rate forecasts
- How debt-to-GDP ratios have changed since 2000
- And much more!

Get the Full Breakdown in the Next VC+ Special Dispatch
VC+ members can access the full Special Dispatch by logging into the VC+ Archive, where you can also check out previous releases.
Make sure you join VC+ now to see exclusive charts and the full analysis of key takeaways from IMF’s World Economic Outlook.
Don’t miss out. Become a VC+ member today.
What You Get When You Become a VC+ Member
VC+ is Visual Capitalist’s premium subscription. As a member, you’ll get the following:
- Special Dispatches: Deep dive visual briefings on crucial reports and global trends
- Markets This Month: A snappy summary of the state of the markets and what to look out for
- The Trendline: Weekly curation of the best visualizations from across the globe
- Global Forecast Series: Our flagship annual report that covers everything you need to know related to the economy, markets, geopolitics, and the latest tech trends
- VC+ Archive: Hundreds of previously released VC+ briefings and reports that you’ve been missing out on, all in one dedicated hub
You can get all of the above, and more, by joining VC+ today.

-

 Debt1 week ago
How Debt-to-GDP Ratios Have Changed Since 2000
-

 Markets2 weeks ago
Ranked: The World’s Top Flight Routes, by Revenue
-

 Countries2 weeks ago
Population Projections: The World’s 6 Largest Countries in 2075
-

 Markets2 weeks ago
The Top 10 States by Real GDP Growth in 2023
-

 Demographics2 weeks ago
The Smallest Gender Wage Gaps in OECD Countries
-

 United States2 weeks ago
Where U.S. Inflation Hit the Hardest in March 2024
-

 Green2 weeks ago
Top Countries By Forest Growth Since 2001
-

 United States2 weeks ago
Ranked: The Largest U.S. Corporations by Number of Employees