Money
The Wealthiest and Poorest County in Every State
View a high resolution version of this graphic.
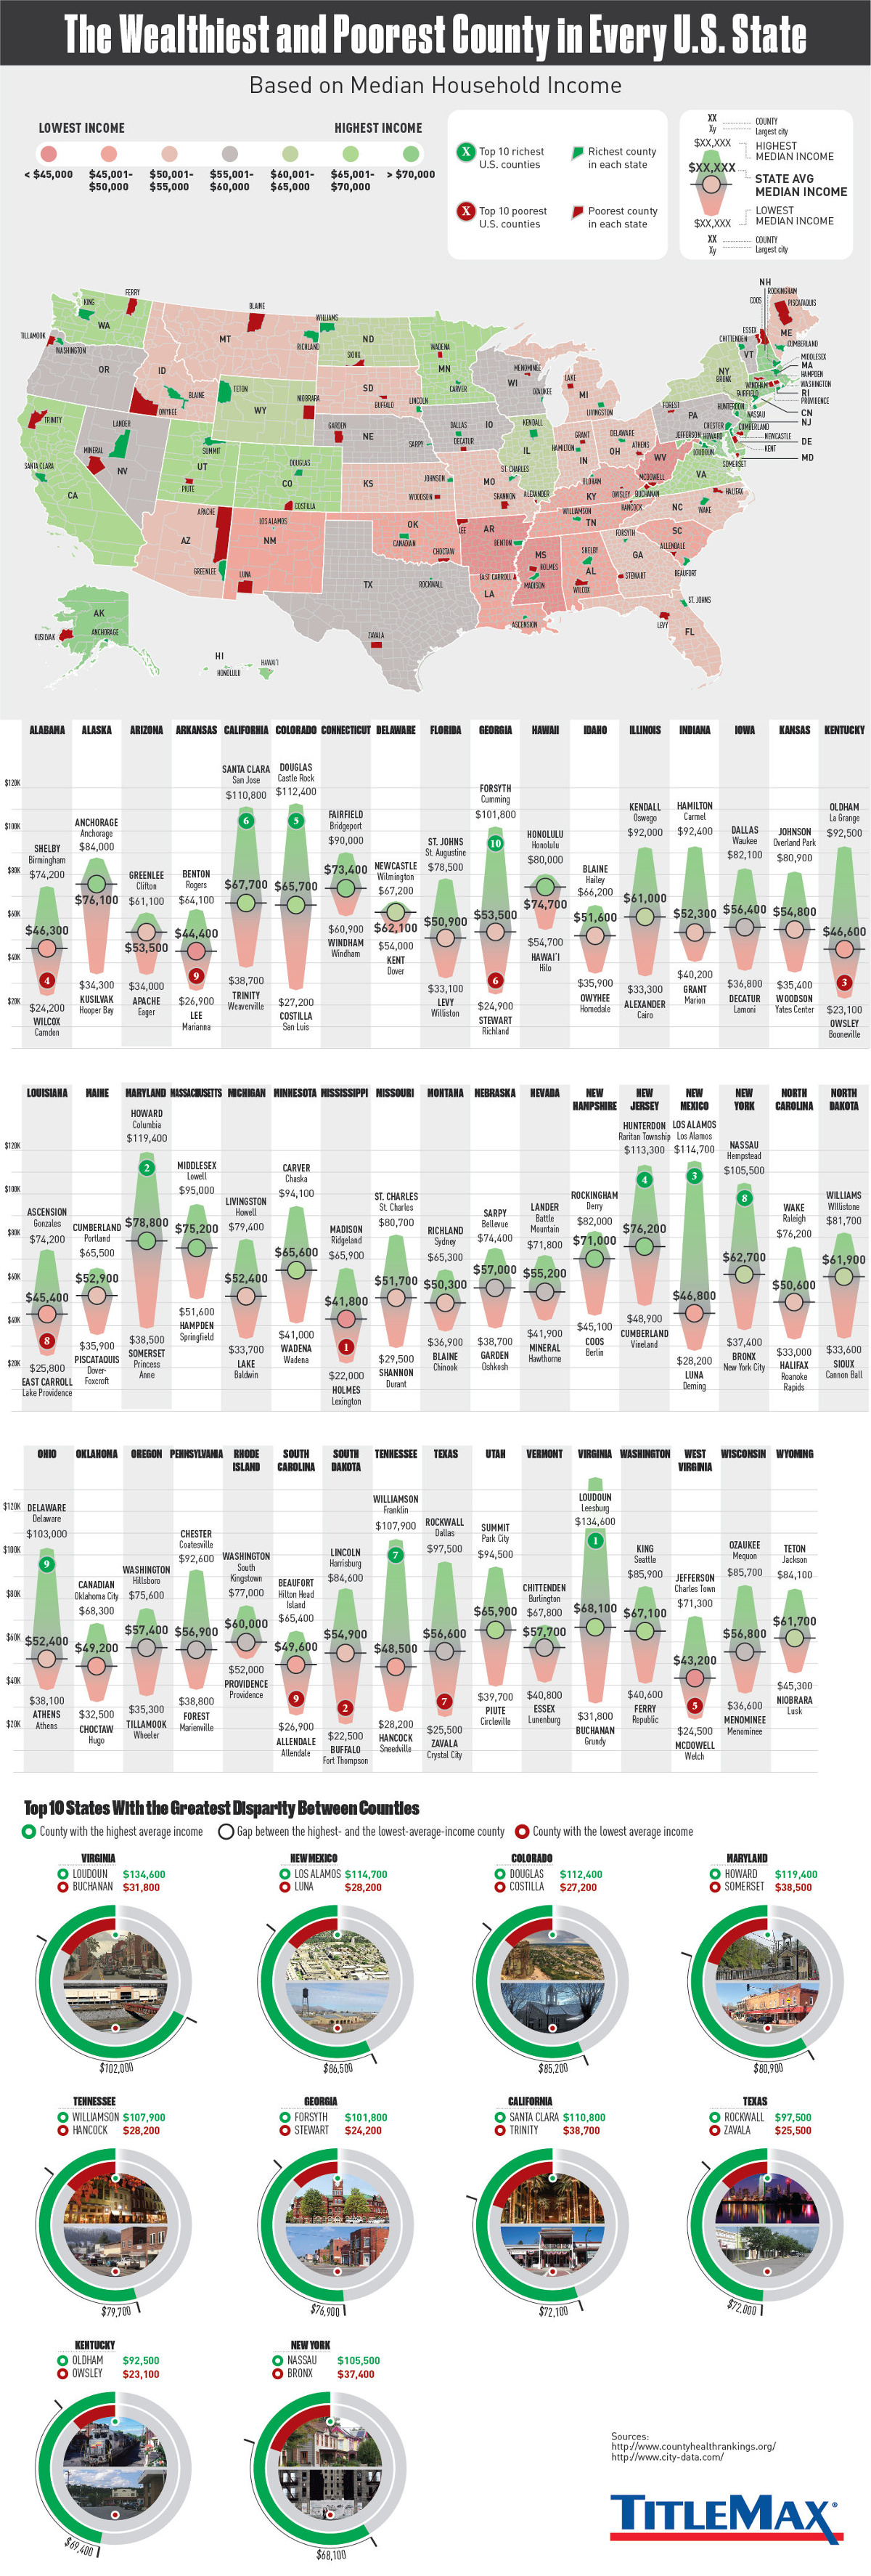
The Wealthiest and Poorest County in Every U.S. State
View the high resolution version of today’s graphic by clicking here.
The average U.S. state is made up of 62 counties.
With so many counties spread throughout each state in the nation, it’s not surprising that we can find counties that exemplify almost any part of the American experience.
In this case, we’re comparing county-level data to look at the differences in economic opportunity within each state. More specifically, we are looking at the range of median household income, which is one proxy for the difference in economic status between counties.
Disparity by State
Today’s infographic comes to us from TitleMax, and it looks at the wealthiest and poorest counties in each individual U.S. state based on the measure of median household income.
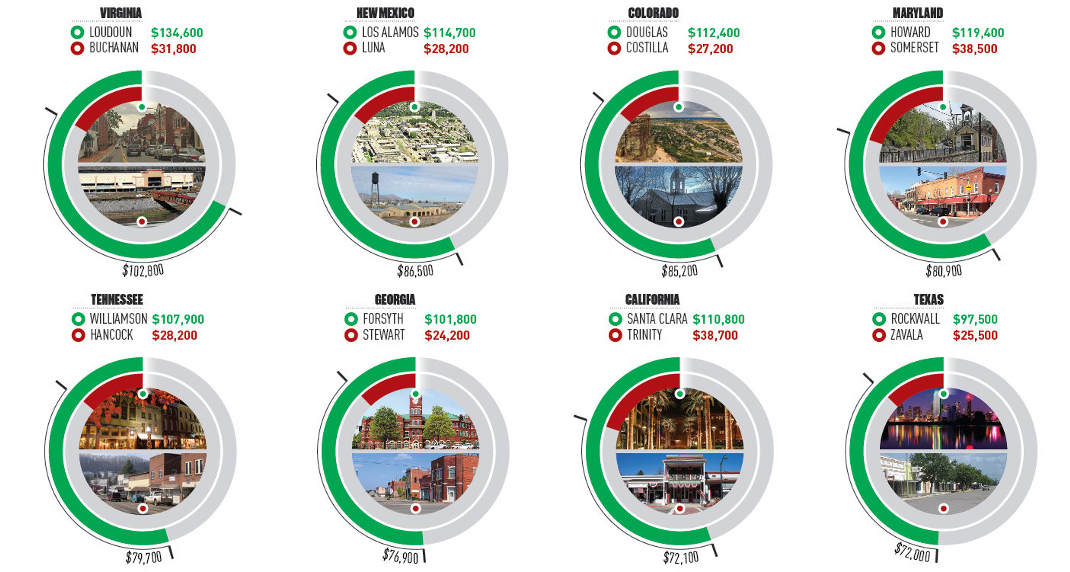
Here are the five states with the biggest disparity between rich and poor counties:
1. Virginia: $102,800
Loudoun is about an hour’s drive to D.C., and it also happens to be the richest county in the U.S. in terms of median income. Further west in the state, bordering Kentucky and West Virginia, lies Buchanan County, which has a median household income of just $31,800.
| County Name | Median Income | |
|---|---|---|
| Richest | Loudoun | $134,600 |
| Poorest | Buchanan | $31,800 |
| Differential | $102,800 |
2. New Mexico: $86,500
In Los Alamos, known as the birthplace of the atomic bomb, median household income has exploded to $114,700 – meanwhile, along the Mexico border lies Luna, the poorest county in the state.
| County Name | Median Income | |
|---|---|---|
| Richest | Los Alamos | $114,700 |
| Poorest | Luna | $28,200 |
| Differential | $86,500 |
3. Colorado: $85,200
Just like the Colorado has a difference in elevation, it also holds a large difference in median income. Folks in Douglas County, which lies between Denver and Colorado Springs, take home $112,400 in income on average, while folks in Costilla bring in about $27,200 per year.
| County Name | Median Income | |
|---|---|---|
| Richest | Douglas | $112,400 |
| Poorest | Costilla | $27,200 |
| Differential | $85,200 |
4. Maryland: $80,900
Howard County, which lies between Baltimore and Washington D.C., has the highest median household income in the state. Meanwhile, it’s Somerset County at the south of the Delmarva Peninsula that has the lowest.
| County Name | Median Income | |
|---|---|---|
| Richest | Howard | $119,400 |
| Poorest | Somerset | $38,500 |
| Differential | $80,900 |
5. Tennessee: $79,700
Just to the south of the Music City sits Williamson County – a wealthy part of the state with $107,900 in median income. Hancock County is the poorest, and it’s tucked away in the northeast corner of the state.
| County Name | Median Income | |
|---|---|---|
| Richest | Williamson | $107,900 |
| Poorest | Hancock | $28,200 |
| Differential | $79,700 |
A Note on Cost of Living
While median household income can help point to disparities between counties, it is just one indicator.
It’s worth noting that the cost of living can often be cheaper in counties with lower median incomes, and this can partially offset the difference in some instances. For example, while Trinity County is the poorest county in California by median income, it’s also far away from San Francisco, Los Angeles, or Sacramento, and has a much cheaper cost of living and a different way of life.
In some ways it is comparing apples to oranges. Trinity County is completely rural, holds zero incorporated cities, and holds just 3,600 people in its largest community (Weaverville) – a far cry from the urban sprawl of L.A. or the booming Bay Area.


Money
Charted: Which City Has the Most Billionaires in 2024?
Just two countries account for half of the top 20 cities with the most billionaires. And the majority of the other half are found in Asia.


Charted: Which Country Has the Most Billionaires in 2024?
This was originally posted on our Voronoi app. Download the app for free on iOS or Android and discover incredible data-driven charts from a variety of trusted sources.
Some cities seem to attract the rich. Take New York City for example, which has 340,000 high-net-worth residents with investable assets of more than $1 million.
But there’s a vast difference between being a millionaire and a billionaire. So where do the richest of them all live?
Using data from the Hurun Global Rich List 2024, we rank the top 20 cities with the highest number of billionaires in 2024.
A caveat to these rich lists: sources often vary on figures and exact rankings. For example, in last year’s reports, Forbes had New York as the city with the most billionaires, while the Hurun Global Rich List placed Beijing at the top spot.
Ranked: Top 20 Cities with the Most Billionaires in 2024
The Chinese economy’s doldrums over the course of the past year have affected its ultra-wealthy residents in key cities.
Beijing, the city with the most billionaires in 2023, has not only ceded its spot to New York, but has dropped to #4, overtaken by London and Mumbai.
| Rank | City | Billionaires | Rank Change YoY |
|---|---|---|---|
| 1 | 🇺🇸 New York | 119 | +1 |
| 2 | 🇬🇧 London | 97 | +3 |
| 3 | 🇮🇳 Mumbai | 92 | +4 |
| 4 | 🇨🇳 Beijing | 91 | -3 |
| 5 | 🇨🇳 Shanghai | 87 | -2 |
| 6 | 🇨🇳 Shenzhen | 84 | -2 |
| 7 | 🇭🇰 Hong Kong | 65 | -1 |
| 8 | 🇷🇺 Moscow | 59 | No Change |
| 9 | 🇮🇳 New Delhi | 57 | +6 |
| 10 | 🇺🇸 San Francisco | 52 | No Change |
| 11 | 🇹🇭 Bangkok | 49 | +2 |
| 12 | 🇹🇼 Taipei | 45 | +2 |
| 13 | 🇫🇷 Paris | 44 | -2 |
| 14 | 🇨🇳 Hangzhou | 43 | -5 |
| 15 | 🇸🇬 Singapore | 42 | New to Top 20 |
| 16 | 🇨🇳 Guangzhou | 39 | -4 |
| 17T | 🇮🇩 Jakarta | 37 | +1 |
| 17T | 🇧🇷 Sao Paulo | 37 | No Change |
| 19T | 🇺🇸 Los Angeles | 31 | No Change |
| 19T | 🇰🇷 Seoul | 31 | -3 |
In fact all Chinese cities on the top 20 list have lost billionaires between 2023–24. Consequently, they’ve all lost ranking spots as well, with Hangzhou seeing the biggest slide (-5) in the top 20.
Where China lost, all other Asian cities—except Seoul—in the top 20 have gained ranks. Indian cities lead the way, with New Delhi (+6) and Mumbai (+3) having climbed the most.
At a country level, China and the U.S combine to make up half of the cities in the top 20. They are also home to about half of the world’s 3,200 billionaire population.
In other news of note: Hurun officially counts Taylor Swift as a billionaire, estimating her net worth at $1.2 billion.

-

 Debt1 week ago
How Debt-to-GDP Ratios Have Changed Since 2000
-

 Markets2 weeks ago
Ranked: The World’s Top Flight Routes, by Revenue
-

 Demographics2 weeks ago
Population Projections: The World’s 6 Largest Countries in 2075
-

 Markets2 weeks ago
The Top 10 States by Real GDP Growth in 2023
-

 Demographics2 weeks ago
The Smallest Gender Wage Gaps in OECD Countries
-

 Economy2 weeks ago
Where U.S. Inflation Hit the Hardest in March 2024
-

 Green2 weeks ago
Top Countries By Forest Growth Since 2001
-

 United States2 weeks ago
Ranked: The Largest U.S. Corporations by Number of Employees