Politics
Visualizing the State of Democracy, by Country
View the full-sized interactive version of this graphic
Visualizing the State of Democracy, by Country
View the full-sized interactive version of this infographic by clicking here
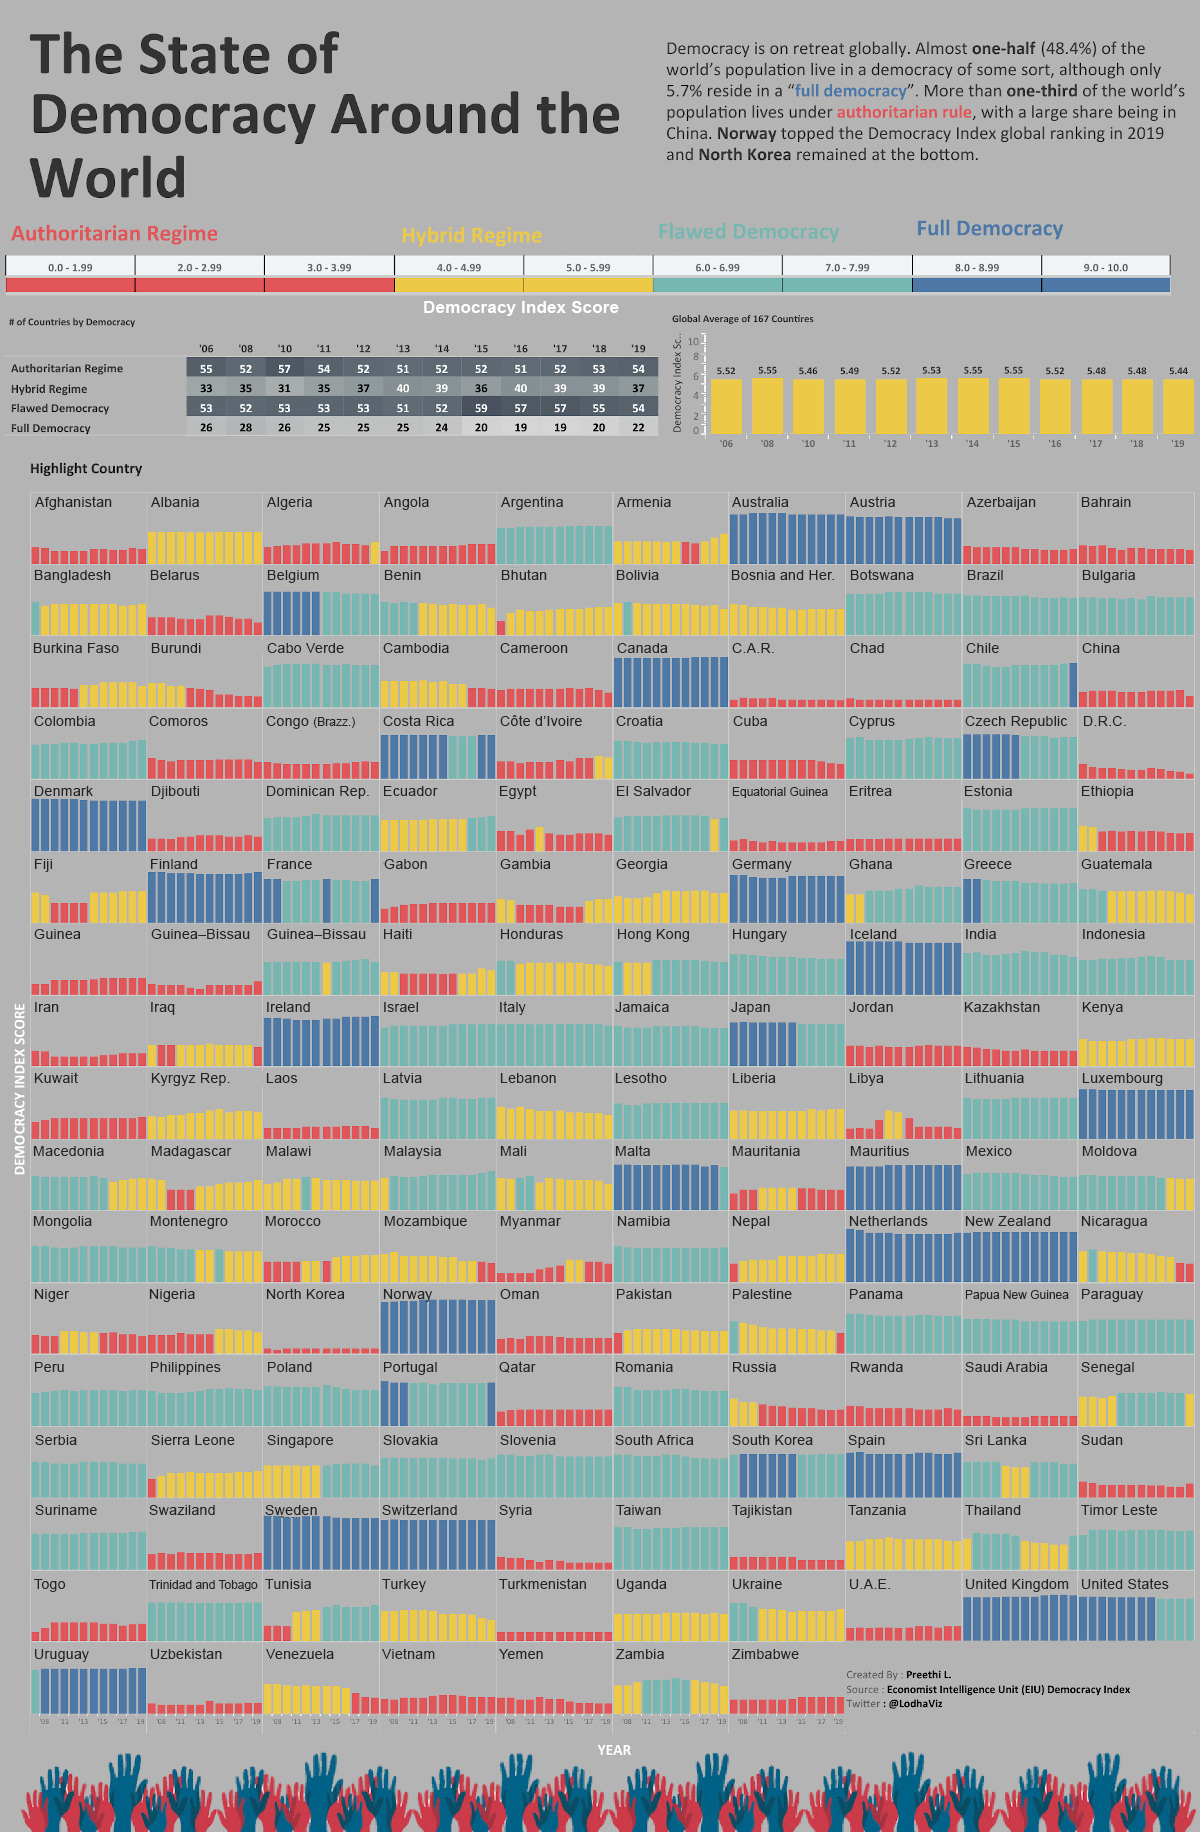
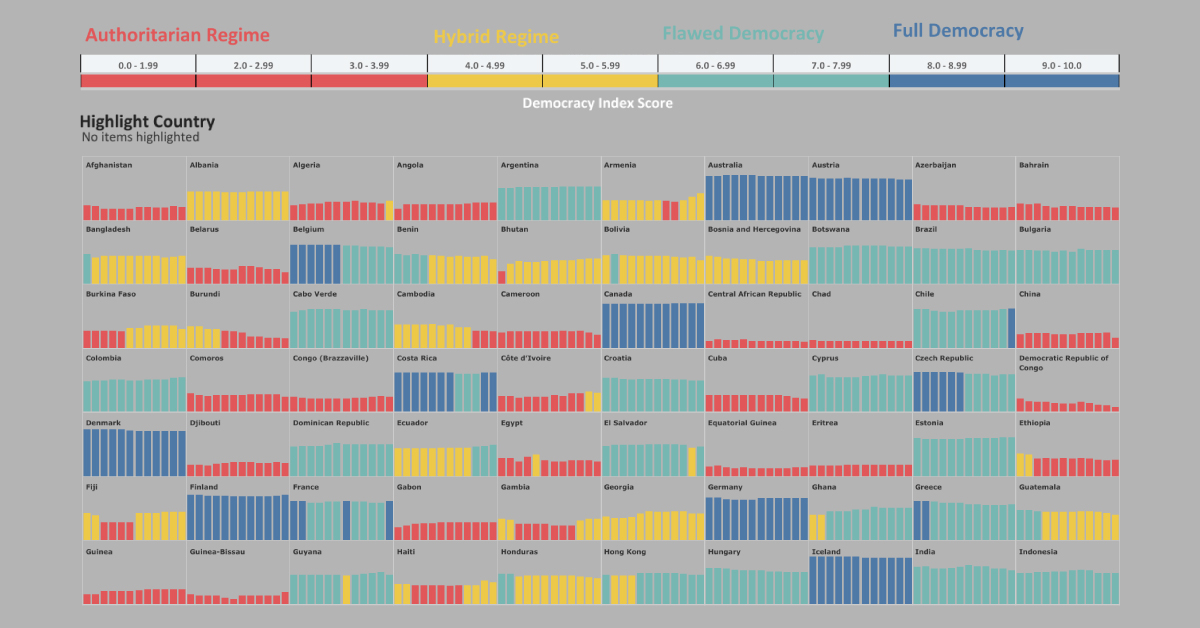
From Norway to North Korea, governing systems differ around the world. But has the world become more or less free in the past decade?
This visualization from Preethi Lodha demonstrates how democracy levels of 167 countries have changed since 2006. The original data comes from the Democracy Index, which is compiled annually by the Economist Intelligence Unit.
Four Levels of Democracy
First, it’s important to understand the classifications made by the Democracy Index.
Based on answers to 60 questions across a nation’s electoral process, civil liberties, government functions, political participation and political culture, countries are assigned a range of scores in the Democracy Index.
Based on these scores, a nation automatically falls into one of the following four types of governance. Here’s which category fits the bill, depending on the range of scores:
| Governance Type | Description | Example | Democracy Index Score |
|---|---|---|---|
| Authoritarian Regime | Nations which exhibit frequent infringements of civil liberties, unfair elections, and rampant censorship. | 🇨🇳 China 🇰🇵 North Korea 🇦🇪 UAE | 0.0-3.99 |
| Hybrid Regime | Nations with regular electoral fraud, corruption, and low political participation, and suppressed opposition. | 🇰🇪 Kenya 🇵🇰 Pakistan 🇹🇷 Turkey | 4.0-5.99 |
| Flawed Democracy | Nations with fair elections, underdeveloped political participation and culture, with minor issues in civil liberty and government functions. | 🇧🇷 Brazil 🇮🇳 India 🇺🇸 U.S. | 6.0-7.99 |
| Full Democracy | Nations where political freedoms are respected with limited problems, governmental checks and balances, and diverse media exist. | 🇦🇺 Australia 🇨🇦 Canada 🇳🇴 Norway | 8.0-10.0 |
One thing that stands out is that many hybrid regimes and flawed democracies are also considered high potential emerging markets, but are held back by their political instability.
Notable Improvements
In recent times, public demonstrations have been a major cause behind increases in Democracy Index scores and changes in governance classifications.
Algeria moved from authoritarian to hybrid regime in 2019, the only country in the Arab region to do so in the index. This came after sustained protests against the previous president, Abdelaziz Bouteflika—who had served for 20 years.
Chile experienced similar turmoil, for the better. After a spike in the scale of middle class unrest over inequality and unfair policies in late 2019, the political participation moved it up from a flawed to full democracy.
Sliding Countries
The U.S. has one of the oldest democracies in the world. However, it was downgraded from a full to a flawed democracy as of the 2016 index, a status that had been “teetering” since before then, according to the report that year.
Venezuela dropped into an authoritarian regime in 2017, and it doesn’t seem to be improving anytime soon. The state was found to use the COVID-19 pandemic as an excuse to crack down on any dissent against the government.
Global Change in Democracy Levels
All in all, the average global democracy score worldwide emerged at 5.48 in 2019, although it’s clear that certain countries pull this value towards the opposite extremes.
North Korea, an authoritarian regime with a 1.08 score, has remained consistently one of the lowest ranked countries in the index. Meanwhile, its alphabetical successor Norway steadily keeps up its high score streak, with 9.87 being the best example of a full democracy in 2019.
Here’s how many countries made up each system of governance over the years, and the global Democracy Index score for that year.
| Year | Authoritarian | Hybrid | Flawed Democracy | Full Democracy | Score |
|---|---|---|---|---|---|
| 2006 | 55 | 33 | 53 | 26 | 5.52 |
| 2008 | 52 | 35 | 52 | 28 | 5.55 |
| 2010 | 57 | 31 | 53 | 26 | 5.46 |
| 2011 | 54 | 35 | 53 | 25 | 5.49 |
| 2012 | 52 | 37 | 53 | 25 | 5.52 |
| 2013 | 51 | 40 | 51 | 25 | 5.53 |
| 2014 | 52 | 39 | 52 | 24 | 5.55 |
| 2015 | 52 | 36 | 59 | 20 | 5.55 |
| 2016 | 51 | 40 | 57 | 19 | 5.52 |
| 2017 | 52 | 39 | 57 | 19 | 5.48 |
| 2018 | 53 | 39 | 55 | 20 | 5.48 |
| 2019 | 54 | 37 | 54 | 22 | 5.48 |
Authoritarian regimes peaked in 2010 with 57 countries, whereas the full democracy category peaked in 2008 with 28 countries.
Since 2006, the average global score has slid from 5.52 to 5.48, and the total of countries categorized under full democracy decreased from 26 to 22.
Does this signal an increasingly divided world? And will the global pandemic—which is already delaying elections—have a further pronounced effect on backsliding these democracy scores?


United States
Charted: What Southeast Asia Thinks About China & the U.S.
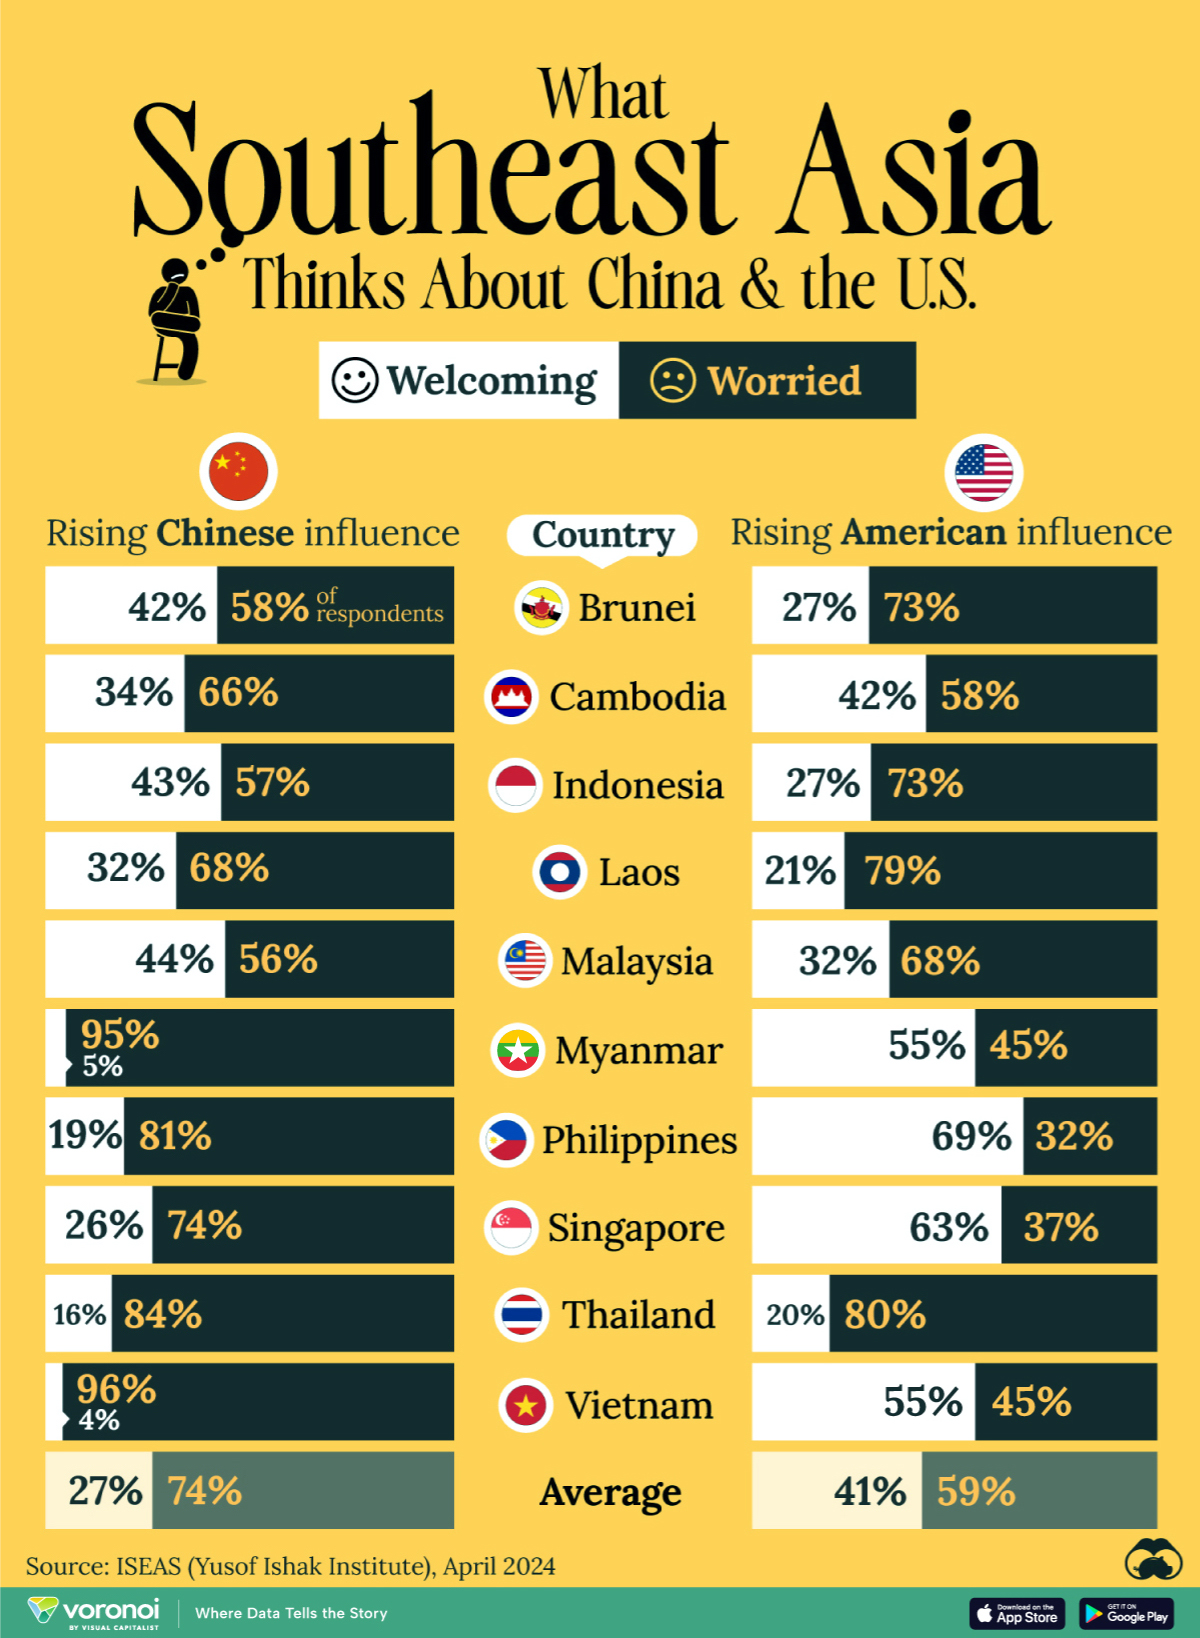
A significant share of respondents from an ASEAN-focused survey are not happy about rising American and Chinese influence in the region.
What Southeast Asia Thinks About China & the U.S.
This was originally posted on our Voronoi app. Download the app for free on iOS or Android and discover incredible data-driven charts from a variety of trusted sources.
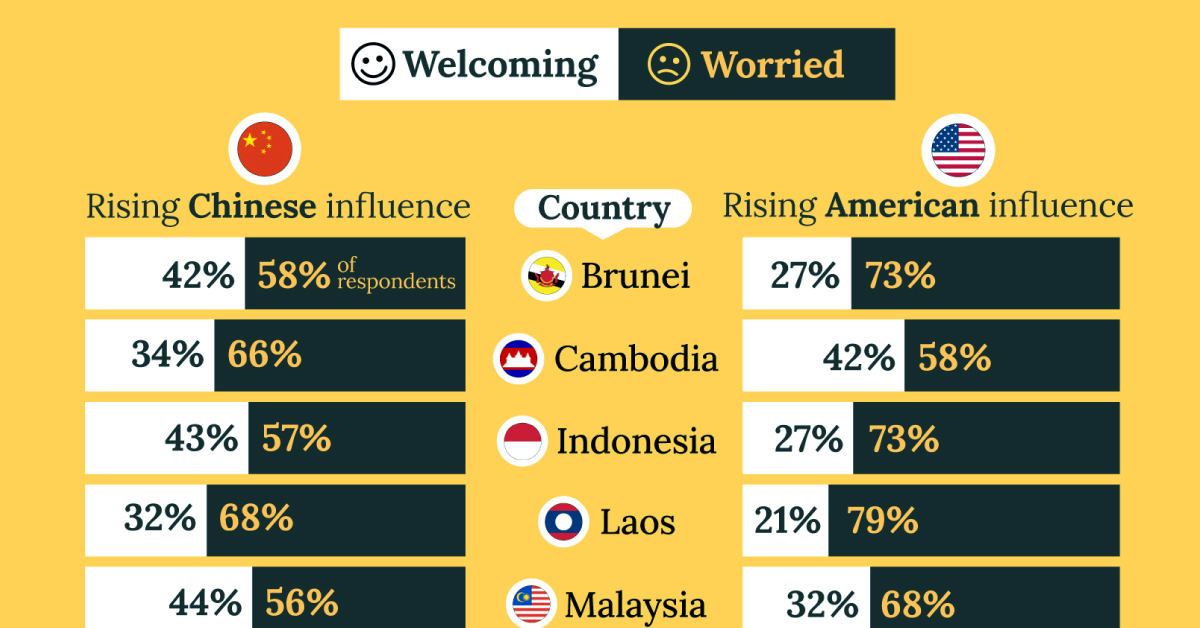
This chart visualizes the results of a 2024 survey conducted by the ASEAN Studies Centre at the ISEAS-Yusof Ishak Institute. Nearly 2,000 respondents were asked if they were worried or welcoming of rising Chinese and American geopolitical influence in their country.
The countries surveyed all belong to the Association of Southeast Asian Nations (ASEAN), a political and economic union of 10 states in Southeast Asia.
Feelings Towards China
On average, a significant share of respondents from all 10 countries are worried about rising influence from both the U.S. and China.
However, overall skepticism is higher for China, at 74% (versus 59% for U.S.).
| Country | Worried About Growing 🇨🇳 Influence | Welcome Growing 🇨🇳 Influence |
|---|---|---|
| 🇧🇳 Brunei | 58% | 42% |
| 🇰🇭 Cambodia | 66% | 34% |
| 🇮🇩 Indonesia | 57% | 43% |
| 🇱🇦 Laos | 68% | 32% |
| 🇲🇾 Malaysia | 56% | 44% |
| 🇲🇲 Myanmar | 95% | 5% |
| 🇵🇭 Philippines | 81% | 19% |
| 🇸🇬 Singapore | 74% | 26% |
| 🇹🇭 Thailand | 84% | 16% |
| 🇻🇳 Vietnam | 96% | 4% |
| Average | 74% | 27% |
The recently-cooled but still active territorial concerns over the South China Sea may play a significant role in these responses, especially in countries which are also claimants over the sea.
For example, in Vietnam over 95% of respondents said they were worried about China’s growing influence.
Feelings Towards America
Conversely, rising American influence is welcomed in two countries with competing claims in the South China Sea, the Philippines (69%) and Vietnam (55%).
| Country | Worried About Growing 🇺🇸 Influence | Welcome Growing 🇺🇸 Influence |
|---|---|---|
| 🇧🇳 Brunei | 73% | 27% |
| 🇰🇭 Cambodia | 58% | 42% |
| 🇮🇩 Indonesia | 73% | 27% |
| 🇱🇦 Laos | 79% | 21% |
| 🇲🇾 Malaysia | 68% | 32% |
| 🇲🇲 Myanmar | 45% | 55% |
| 🇵🇭 Philippines | 32% | 69% |
| 🇸🇬 Singapore | 37% | 63% |
| 🇹🇭 Thailand | 80% | 20% |
| 🇻🇳 Vietnam | 45% | 55% |
| Average | 59% | 41% |
Despite this, on a regional average, more respondents worry about growing American influence (59%) than they welcome it (41%).
Interestingly, it seems almost every ASEAN nation has a clear preference for one superpower over the other.
The only exception is Thailand, where those surveyed were not a fan of either option, with 84% worried about China, and 80% worried about the U.S.

-

 Markets6 days ago
The Best U.S. Companies to Work for According to LinkedIn
-

 VC+2 weeks ago
VC+: Get Our Key Takeaways From the IMF’s World Economic Outlook
-

 Demographics2 weeks ago
The Countries That Have Become Sadder Since 2010
-

 Money2 weeks ago
Charted: Who Has Savings in This Economy?
-

 Technology2 weeks ago
Visualizing AI Patents by Country
-

 Economy2 weeks ago
Economic Growth Forecasts for G7 and BRICS Countries in 2024
-

 Wealth1 week ago
Charted: Which City Has the Most Billionaires in 2024?
-

 Technology1 week ago
All of the Grants Given by the U.S. CHIPS Act