Visualizing Global Inflation Forecasts (2024-2026)
The World’s Fastest Growing Emerging Markets (2024-2029 Forecast)
The Most Valuable Companies in Major EU Economies
Visualized: Interest Rate Forecasts for Advanced Economies
The Best U.S. Companies to Work for According to LinkedIn
All of the Grants Given by the U.S. CHIPS Act
Visualizing AI Patents by Country
How Tech Logos Have Evolved Over Time
Ranked: Semiconductor Companies by Industry Revenue Share
The Stock Performance of U.S. Chipmakers So Far in 2024
Ranked: The Top 20 Countries in Debt to China
Charted: Which Country Has the Most Billionaires in 2024?
Charted: Which City Has the Most Billionaires in 2024?
Charted: Who Has Savings in This Economy?
How Debt-to-GDP Ratios Have Changed Since 2000
The Cost of an EpiPen in Major Markets
Charted: Global Tobacco Use by Country and Sex
Visualized: What Lives in Your Gut Microbiome?
Charted: Average Years Left to Live by Age
Charted: The Average Cost of Insulin By Country
Mapped: The Age of Energy Projects in Interconnection Queues, by State
Ranked: The Top 10 EV Battery Manufacturers in 2023
The World’s Biggest Nuclear Energy Producers
The World’s Biggest Oil Producers in 2023
How Much Does the U.S. Depend on Russian Uranium?
The Largest Earthquakes in the New York Area (1970-2024)
Mapped: Average Wages Across Europe
Mapped: Asia’s Population Patterns by Density
A Map of Global Happiness By Country in 2024
Mapped: Population Growth by Region (1900-2050F)
Visualizing Global Gold Production in 2023
Gold vs. S&P 500: Which Has Grown More Over Five Years?
Charted: The Value Gap Between the Gold Price and Gold Miners
Charted: Global Uranium Reserves, by Country
The Carbon Footprint of Major Travel Methods
Ranking the Top 15 Countries by Carbon Tax Revenue
Ranked: The Countries With the Most Air Pollution in 2023
Top Countries By Forest Growth Since 2001
Ranked: Top Countries by Total Forest Loss Since 2001
...2006 $62 9% 2007 $68 10% 2008 $74 8% 2009 $77 4% 2010 $78 2% 2011 $79 1% 2012 $83 5% 2013 $85 3% 2014 $91...
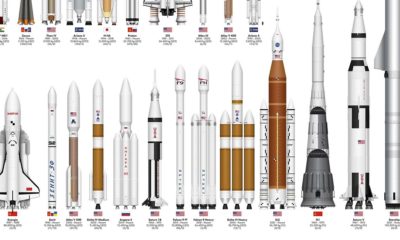
...(LEO) 20/0 U.S. Delta IV Heavy 2004–Present 28,790 kg (LEO) 12/1 U.S. Falcon 1 2006–2009 180 kg (LEO) 2/3 China Long March 4C 2006–Present 4,200 kg...
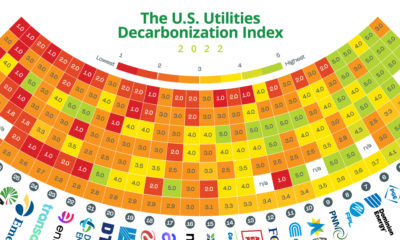
Published 2 years ago on September 20, 2022 By Graphics & Design Miranda Smith Introducing the NPUC Annual Utility Decarbonization Report 2022 Created in partnership by...
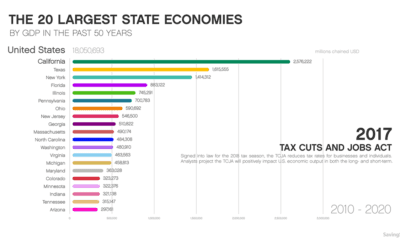
Animation: The 20 Largest State Economies by GDP When it comes to understanding the size and scope of the $18 trillion U.S. economy, it’s sometimes easier...
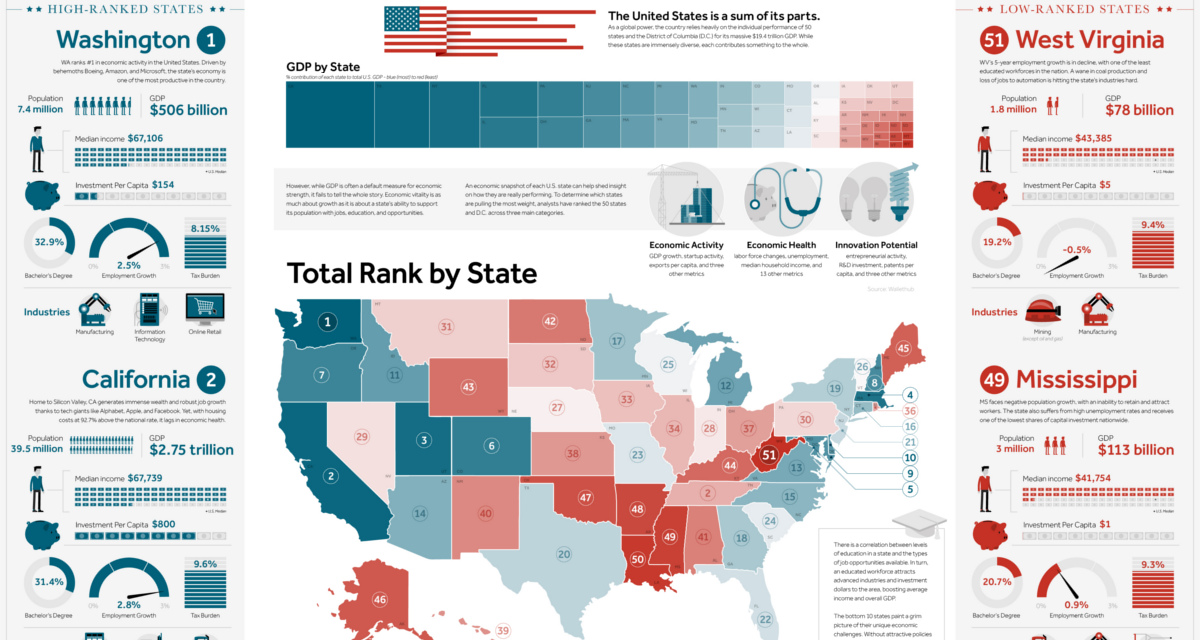
Ranked: The Best and Worst State Economies View the high resolution version of today’s graphic by clicking here. On a global scale, the U.S. economy is...
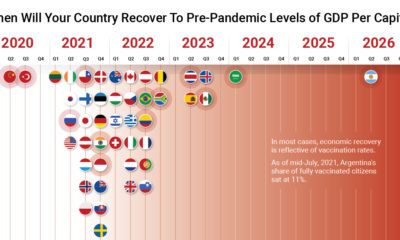
What started as a novel virus in China quickly became a sweeping disease that shut down the world and put a 1.5 year halt on the...
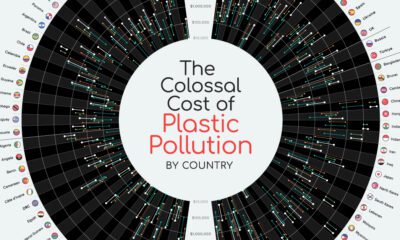
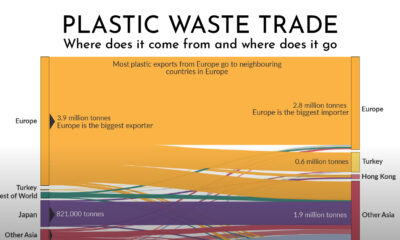
Charting the Movement of Global Plastic Waste Every year, nations worldwide produce around 350 million metric tons of plastic waste. This is equivalent to over 10...
...corroborate the reported information themselves. How categories are weighted: Graduation & Retention Rates = 22% Undergraduate Academic Reputation = 20% Faculty Resources = 20% Financial Resources...
Published 10 months ago on June 30, 2023 By Marcus Lu Graphics & Design Zack Aboulazm The following content is sponsored by Greenbutts View the full-size...
...0.0% 2017 3.5% 2016 2.7% 2015 0.6% 2014 6.0% 2013 -2.0% 2012 4.2% 2011 7.8% 2010 6.5% 2009 5.9% 2008 5.2% 2007 7.0% 2006 4.3% 2005...


 Creator Program