Mapped: The Colossal Cost of Plastic Pollution, By Country


View the full-size version of this graphic
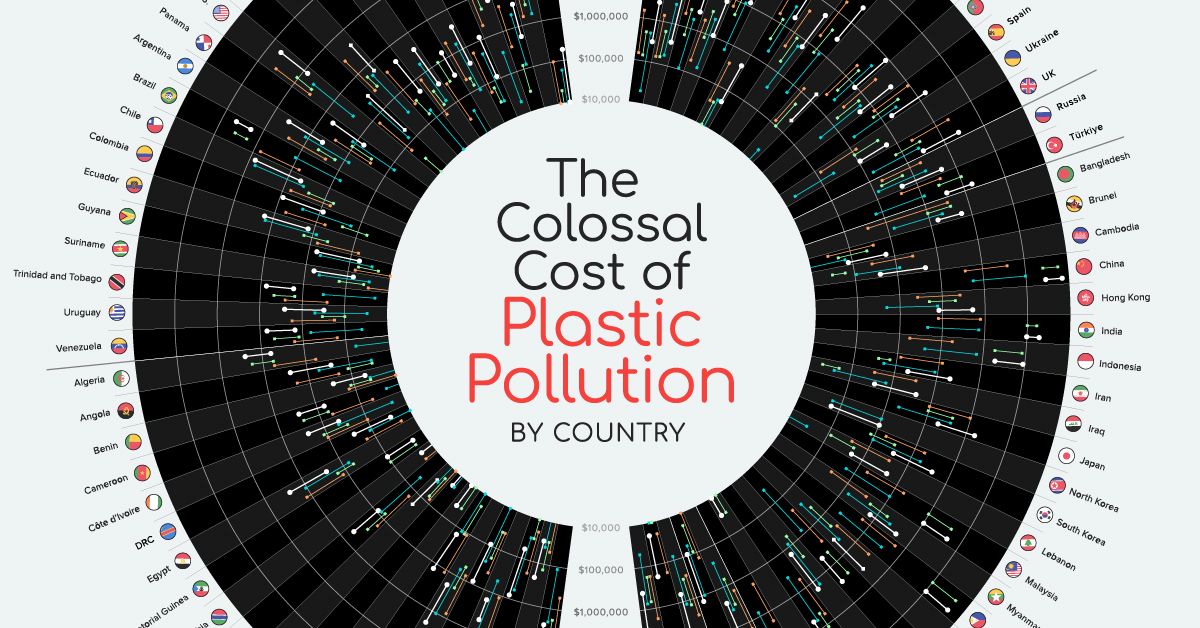
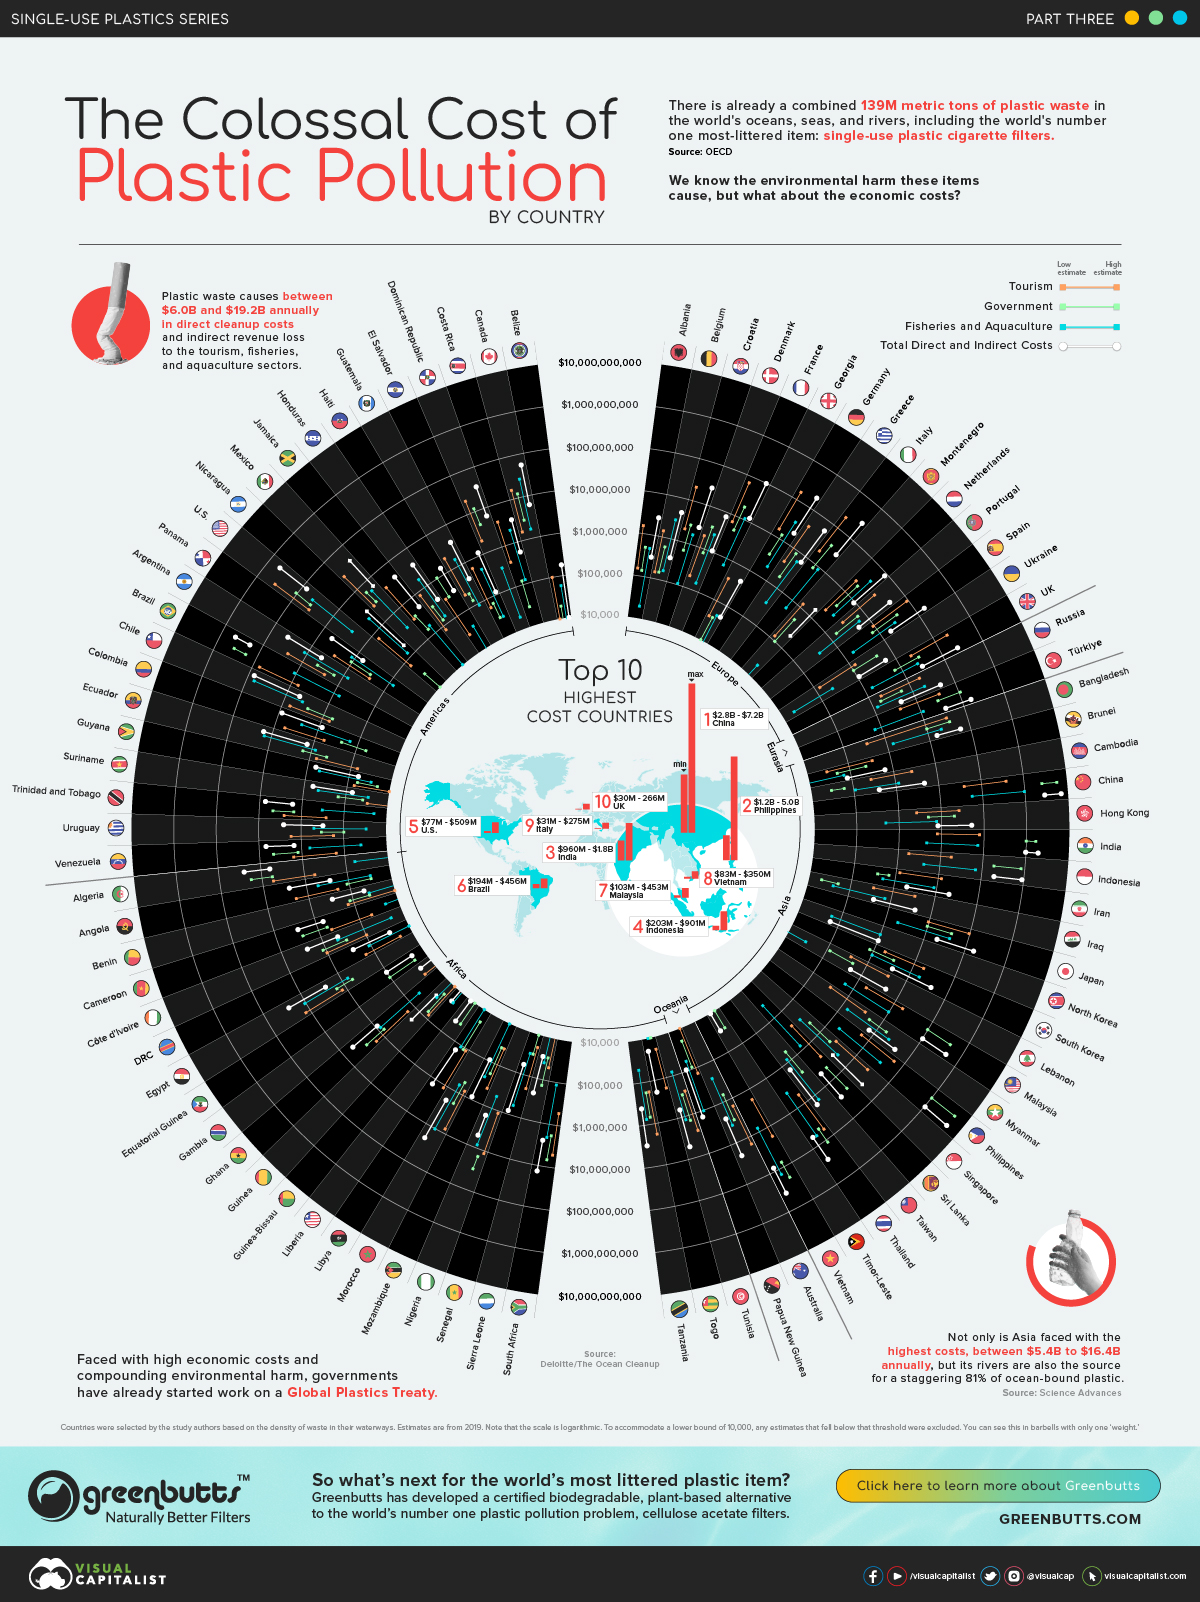
The Cost of Plastic Pollution, By Country
There is now a combined 139 million tons of plastic pollution in the world’s oceans, seas, and rivers, including the world’s number one most littered item: single-use cigarette filters.
And while we know plastic waste has a massive environmental impact, what are the associated economic costs?
Using estimates developed by Deloitte for The Ocean Cleanup, this data visualization maps the cost of plastic pollution for the third and final piece in the Single-use Plastic Series for our sponsor Greenbutts.
The Price Tag of Plastic Pollution
Deloitte’s 2019 Price Tag of Plastic Pollution study uses a novel assessment model to estimate the economic costs of marine litter, which typically flows from rivers and into the ocean.
The resulting estimates for 87 countries cover direct government costs, and the revenue lost to tourism, and fisheries and aquaculture.
If you take the UK, for example, the direct costs borne by the government were between $7.1 and $31.7 million, but the report estimated the total costs to be between $29.6 and $266.2 million.
Deloitte and the Ocean Cleanup selected countries to include on the basis of the waste density of the subject’s waterways.
Paying the Piper
Every year, plastic pollution costs coastal countries between $6.0 and $19.2 billion.
| Country or territory | Sector | Lower estimate | Upper estimate |
|---|---|---|---|
| Angola | Fisheries & Aquaculture | $30,000 | $530,000 |
| Angola | Government | $30,000 | $110,000 |
| Angola | Tourism | $200,000 | $1,950,000 |
| Albania | Tourism | $150,000 | $1,480,000 |
| Albania | Fisheries & Aquaculture | $20,000 | $450,000 |
| Albania | Government | $130,000 | $490,000 |
| Argentina | Fisheries & Aquaculture | $750,000 | $12,580,000 |
| Argentina | Government | $1,500,000 | $4,420,000 |
| Argentina | Tourism | $2,400,000 | $23,970,000 |
| Australia | Fisheries & Aquaculture | $230,000 | $3,830,000 |
| Australia | Government | $680,000 | $3,030,000 |
| Australia | Tourism | $1,450,000 | $14,530,000 |
| Belgium | Fisheries & Aquaculture | $170,000 | $2,820,000 |
| Belgium | Government | $140,000 | $590,000 |
| Belgium | Tourism | $130,000 | $1,290,000 |
| Benin | Fisheries & Aquaculture | $0 | $40,000 |
| Benin | Government | $40,000 | $120,000 |
| Benin | Tourism | $10,000 | $130,000 |
| Bangladesh | Tourism | $330,000 | $3,310,000 |
| Bangladesh | Fisheries & Aquaculture | $1,300,000 | $21,620,000 |
| Bangladesh | Government | $13,350,000 | $37,970,000 |
| Belize | Fisheries & Aquaculture | $0 | $60,000 |
| Belize | Tourism | $10,000 | $100,000 |
| Belize | Government | $0 | $20,000 |
| Brazil | Fisheries & Aquaculture | $720,000 | $11,990,000 |
| Brazil | Government | $186,340,000 | $373,940,000 |
| Brazil | Tourism | $6,970,000 | $69,690,000 |
| Brunei | Fisheries & Aquaculture | $0 | $70,000 |
| Brunei | Government | $50,000 | $230,000 |
| Brunei | Tourism | $30,000 | $340,000 |
| Canada | Fisheries & Aquaculture | $1,620,000 | $27,100,000 |
| Canada | Government | $2,880,000 | $12,990,000 |
| Canada | Tourism | $1,600,000 | $16,020,000 |
| Chile | Fisheries & Aquaculture | $3,910,000 | $65,230,000 |
| Chile | Government | $600,000 | $2,620,000 |
| Chile | Tourism | $660,000 | $6,610,000 |
| China | Fisheries & Aquaculture | $57,250,000 | $954,200,000 |
| China | Government | $2,674,690,000 | $5,853,540,000 |
| China | Tourism | $39,730,000 | $397,350,000 |
| Côte d'Ivoire | Fisheries & Aquaculture | $20,000 | $440,000 |
| Côte d'Ivoire | Government | $290,000 | $1,240,000 |
| Côte d'Ivoire | Tourism | $100,000 | $990,000 |
| Cameroon | Tourism | $50,000 | $480,000 |
| Cameroon | Fisheries & Aquaculture | $0 | $20,000 |
| Cameroon | Government | $610,000 | $2,470,000 |
| Democratic Republic of the Congo (DRC) | Fisheries & Aquaculture | $10,000 | $110,000 |
| Democratic Republic of the Congo (DRC) | Government | $0 | $0 |
| Democratic Republic of the Congo (DRC) | Tourism | $20,000 | $160,000 |
| Colombia | Fisheries & Aquaculture | $150,000 | $2,570,000 |
| Colombia | Tourism | $620,000 | $6,160,000 |
| Colombia | Government | $60,000 | $230,000 |
| Costa Rica | Fisheries & Aquaculture | $120,000 | $2,020,000 |
| Costa Rica | Government | $30,000 | $120,000 |
| Costa Rica | Tourism | $390,000 | $3,870,000 |
| Germany | Fisheries & Aquaculture | $2,010,000 | $33,500,000 |
| Germany | Government | $3,650,000 | $12,670,000 |
| Germany | Tourism | $15,010,000 | $150,120,000 |
| Denmark | Fisheries & Aquaculture | $140,000 | $2,420,000 |
| Denmark | Government | $810,000 | $3,630,000 |
| Denmark | Tourism | $200,000 | $1,980,000 |
| Dominican Republic | Fisheries & Aquaculture | $20,000 | $330,000 |
| Dominican Republic | Government | $4,630,000 | $12,030,000 |
| Dominican Republic | Tourism | $2,070,000 | $20,710,000 |
| Algeria | Tourism | $560,000 | $5,640,000 |
| Algeria | Fisheries & Aquaculture | $0 | $60,000 |
| Algeria | Government | $5,720,000 | $18,580,000 |
| Ecuador | Fisheries & Aquaculture | $850,000 | $14,120,000 |
| Ecuador | Government | $420,000 | $1,500,000 |
| Ecuador | Tourism | $70,000 | $710,000 |
| Egypt | Fisheries & Aquaculture | $710,000 | $11,750,000 |
| Egypt | Government | $550,000 | $1,550,000 |
| Egypt | Tourism | $1,210,000 | $12,070,000 |
| Spain | Fisheries & Aquaculture | $1,680,000 | $27,970,000 |
| Spain | Government | $7,660,000 | $37,320,000 |
| Spain | Tourism | $9,040,000 | $90,430,000 |
| France | Fisheries & Aquaculture | $650,000 | $10,750,000 |
| France | Government | $4,700,000 | $19,760,000 |
| France | Tourism | $6,940,000 | $69,400,000 |
| UK | Fisheries & Aquaculture | $1,470,000 | $24,540,000 |
| UK | Government | $7,140,000 | $31,680,000 |
| UK | Tourism | $21,000,000 | $209,980,000 |
| Georgia | Fisheries & Aquaculture | $0 | $50,000 |
| Georgia | Government | $10,000 | $40,000 |
| Georgia | Tourism | $40,000 | $370,000 |
| Ghana | Fisheries & Aquaculture | $50,000 | $830,000 |
| Ghana | Government | $670,000 | $2,740,000 |
| Ghana | Tourism | $160,000 | $1,650,000 |
| Guinea | Fisheries & Aquaculture | $0 | $30,000 |
| Guinea | Government | $20,000 | $70,000 |
| Guinea | Tourism | $10,000 | $80,000 |
| Gambia | Tourism | $0 | $20,000 |
| Gambia | Fisheries & Aquaculture | $0 | $0 |
| Gambia | Government | $0 | $0 |
| Guinea-Bissau | Fisheries & Aquaculture | $0 | $20,000 |
| Guinea-Bissau | Government | $0 | $0 |
| Guinea-Bissau | Tourism | $0 | $0 |
| Equatorial Guinea | Tourism | $0 | $0 |
| Equatorial Guinea | Fisheries & Aquaculture | $0 | $0 |
| Equatorial Guinea | Government | $20,000 | $100,000 |
| Greece | Tourism | $4,290,000 | $42,920,000 |
| Greece | Fisheries & Aquaculture | $360,000 | $5,910,000 |
| Greece | Government | $1,880,000 | $8,490,000 |
| Guatemala | Tourism | $210,000 | $2,080,000 |
| Guatemala | Fisheries & Aquaculture | $90,000 | $1,470,000 |
| Guatemala | Government | $120,000 | $200,000 |
| Guyana | Fisheries & Aquaculture | $30,000 | $500,000 |
| Guyana | Government | $20,000 | $60,000 |
| Guyana | Tourism | $10,000 | $70,000 |
| Hong Kong | Fisheries & Aquaculture | $450,000 | $7,550,000 |
| Hong Kong | Government | $5,100,000 | $20,150,000 |
| Hong Kong | Tourism | $2,470,000 | $24,680,000 |
| Honduras | Fisheries & Aquaculture | $160,000 | $2,760,000 |
| Honduras | Government | $130,000 | $330,000 |
| Honduras | Tourism | $80,000 | $770,000 |
| Croatia | Tourism | $2,100,000 | $21,000,000 |
| Croatia | Fisheries & Aquaculture | $110,000 | $1,780,000 |
| Croatia | Government | $640,000 | $2,820,000 |
| Haiti | Tourism | $30,000 | $290,000 |
| Haiti | Fisheries & Aquaculture | $0 | $40,000 |
| Haiti | Government | $300,000 | $1,100,000 |
| Indonesia | Fisheries & Aquaculture | $4,250,000 | $70,830,000 |
| Indonesia | Government | $196,530,000 | $813,230,000 |
| Indonesia | Tourism | $1,720,000 | $17,170,000 |
| India | Tourism | $7,420,000 | $74,210,000 |
| India | Fisheries & Aquaculture | $4,370,000 | $72,860,000 |
| India | Government | $948,160,000 | $1,655,590,000 |
| Iran | Fisheries & Aquaculture | $510,000 | $8,490,000 |
| Iran | Tourism | $1,170,000 | $11,740,000 |
| Iran | Government | $360,000 | $710,000 |
| Iraq | Fisheries & Aquaculture | $40,000 | $700,000 |
| Iraq | Tourism | $330,000 | $3,310,000 |
| Iraq | Government | $20,000 | $50,000 |
| Italy | Fisheries & Aquaculture | $540,000 | $8,920,000 |
| Italy | Tourism | $22,920,000 | $229,190,000 |
| Italy | Government | $7,570,000 | $37,180,000 |
| Jamaica | Fisheries & Aquaculture | $10,000 | $170,000 |
| Jamaica | Tourism | $370,000 | $3,730,000 |
| Jamaica | Government | $140,000 | $400,000 |
| Japan | Fisheries & Aquaculture | $2,070,000 | $34,390,000 |
| Japan | Tourism | $9,230,000 | $92,290,000 |
| Japan | Government | $9,480,000 | $38,170,000 |
| Cambodia | Tourism | $270,000 | $2,740,000 |
| Cambodia | Fisheries & Aquaculture | $110,000 | $1,750,000 |
| Cambodia | Government | $30,000 | $60,000 |
| South Korea | Fisheries & Aquaculture | $1,020,000 | $17,030,000 |
| South Korea | Tourism | $1,820,000 | $18,240,000 |
| South Korea | Government | $780,000 | $3,250,000 |
| Lebanon | Fisheries & Aquaculture | $0 | $30,000 |
| Lebanon | Tourism | $380,000 | $3,850,000 |
| Lebanon | Government | $120,000 | $470,000 |
| Liberia | Fisheries & Aquaculture | $0 | $0 |
| Liberia | Tourism | $0 | $0 |
| Liberia | Government | $10,000 | $40,000 |
| Libya | Fisheries & Aquaculture | $10,000 | $110,000 |
| Libya | Tourism | $110,000 | $1,140,000 |
| Libya | Government | $20,000 | $110,000 |
| Sri Lanka | Fisheries & Aquaculture | $40,000 | $790,000 |
| Sri Lanka | Government | $4,890,000 | $22,400,000 |
| Sri Lanka | Tourism | $240,000 | $2,370,000 |
| Morocco | Fisheries & Aquaculture | $640,000 | $10,650,000 |
| Morocco | Government | $510,000 | $1,840,000 |
| Morocco | Tourism | $770,000 | $7,660,000 |
| Mexico | Tourism | $2,790,000 | $27,910,000 |
| Mexico | Fisheries & Aquaculture | $330,000 | $5,430,000 |
| Mexico | Government | $3,120,000 | $6,310,000 |
| Myanmar | Fisheries & Aquaculture | $1,330,000 | $22,180,000 |
| Myanmar | Government | $5,330,000 | $16,490,000 |
| Myanmar | Tourism | $320,000 | $3,160,000 |
| Montenegro | Tourism | $120,000 | $1,210,000 |
| Montenegro | Fisheries & Aquaculture | $0 | $20,000 |
| Montenegro | Government | $100,000 | $460,000 |
| Mozambique | Tourism | $40,000 | $410,000 |
| Mozambique | Fisheries & Aquaculture | $10,000 | $230,000 |
| Mozambique | Government | $40,000 | $180,000 |
| Malaysia | Tourism | $1,850,000 | $18,530,000 |
| Malaysia | Fisheries & Aquaculture | $590,000 | $9,850,000 |
| Malaysia | Government | $100,550,000 | $424,360,000 |
| Nigeria | Fisheries & Aquaculture | $500,000 | $8,430,000 |
| Nigeria | Government | $14,500,000 | $31,450,000 |
| Nigeria | Tourism | $1,170,000 | $11,660,000 |
| Nicaragua | Tourism | $70,000 | $710,000 |
| Nicaragua | Fisheries & Aquaculture | $130,000 | $2,110,000 |
| Nicaragua | Government | $10,000 | $30,000 |
| Netherlands | Tourism | $2,380,000 | $23,840,000 |
| Netherlands | Fisheries & Aquaculture | $2,440,000 | $40,750,000 |
| Netherlands | Government | $4,240,000 | $19,830,000 |
| Panama | Tourism | $280,000 | $2,780,000 |
| Panama | Fisheries & Aquaculture | $80,000 | $1,230,000 |
| Panama | Government | $300,000 | $1,190,000 |
| Philippines | Fisheries & Aquaculture | $1,950,000 | $32,600,000 |
| Philippines | Tourism | $6,020,000 | $60,160,000 |
| Philippines | Government | $1,176,380,000 | $4,859,270,000 |
| Papua New Guinea | Tourism | $10,000 | $130,000 |
| Papua New Guinea | Fisheries & Aquaculture | $60,000 | $1,030,000 |
| Papua New Guinea | Government | $20,000 | $90,000 |
| North Korea | Tourism | $0 | $0 |
| North Korea | Fisheries & Aquaculture | $60,000 | $1,060,000 |
| North Korea | Government | $0 | $0 |
| Portugal | Tourism | $2,940,000 | $29,390,000 |
| Portugal | Fisheries & Aquaculture | $370,000 | $6,180,000 |
| Portugal | Government | $1,520,000 | $6,730,000 |
| Russia | Tourism | $1,820,000 | $18,190,000 |
| Russia | Fisheries & Aquaculture | $1,250,000 | $20,690,000 |
| Russia | Government | $1,520,000 | $6,100,000 |
| Senegal | Tourism | $20,000 | $190,000 |
| Senegal | Fisheries & Aquaculture | $30,000 | $580,000 |
| Senegal | Government | $10,000 | $30,000 |
| Singapore | Tourism | $2,760,000 | $27,610,000 |
| Singapore | Fisheries & Aquaculture | $280,000 | $4,780,000 |
| Singapore | Government | $470,000 | $2,080,000 |
| Sierra Leone | Tourism | $0 | $50,000 |
| Sierra Leone | Fisheries & Aquaculture | $0 | $40,000 |
| Sierra Leone | Government | $30,000 | $130,000 |
| El Salvador | Tourism | $60,000 | $640,000 |
| El Salvador | Fisheries & Aquaculture | $30,000 | $490,000 |
| El Salvador | Government | $30,000 | $70,000 |
| Suriname | Fisheries & Aquaculture | $30,000 | $440,000 |
| Suriname | Tourism | $0 | $30,000 |
| Suriname | Government | $40,000 | $140,000 |
| Togo | Fisheries & Aquaculture | $0 | $10,000 |
| Togo | Government | $0 | $10,000 |
| Togo | Tourism | $20,000 | $170,000 |
| Thailand | Fisheries & Aquaculture | $3,770,000 | $62,850,000 |
| Thailand | Government | $49,670,000 | $122,410,000 |
| Thailand | Tourism | $5,730,000 | $57,270,000 |
| Timor-Leste | Fisheries & Aquaculture | $0 | $0 |
| Timor-Leste | Government | $10,000 | $30,000 |
| Timor-Leste | Tourism | $0 | $0 |
| Trinidad and Tobago | Fisheries & Aquaculture | $20,000 | $320,000 |
| Trinidad and Tobago | Government | $1,480,000 | $4,450,000 |
| Trinidad and Tobago | Tourism | $250,000 | $2,470,000 |
| Tunisia | Fisheries & Aquaculture | $80,000 | $1,260,000 |
| Tunisia | Government | $310,000 | $1,330,000 |
| Tunisia | Tourism | $260,000 | $2,640,000 |
| Türkiye | Fisheries & Aquaculture | $690,000 | $11,440,000 |
| Türkiye | Government | $30,060,000 | $116,200,000 |
| Türkiye | Tourism | $3,530,000 | $35,280,000 |
| Taiwan | Tourism | $0 | $0 |
| Taiwan | Fisheries & Aquaculture | $810,000 | $13,360,000 |
| Taiwan | Government | $610,000 | $2,410,000 |
| Tanzania | Tourism | $170,000 | $1,720,000 |
| Tanzania | Fisheries & Aquaculture | $50,000 | $740,000 |
| Tanzania | Government | $180,000 | $670,000 |
| Ukraine | Fisheries & Aquaculture | $20,000 | $220,000 |
| Ukraine | Tourism | $120,000 | $1,200,000 |
| Ukraine | Government | $1,070,000 | $4,360,000 |
| Uruguay | Fisheries & Aquaculture | $30,000 | $510,000 |
| Uruguay | Government | $100,000 | $320,000 |
| Uruguay | Tourism | $170,000 | $1,740,000 |
| U.S. | Fisheries & Aquaculture | $2,620,000 | $43,750,000 |
| U.S. | Tourism | $35,280,000 | $352,800,000 |
| U.S. | Government | $39,020,000 | $112,170,000 |
| Venezuela | Fisheries & Aquaculture | $40,000 | $630,000 |
| Venezuela | Government | $1,290,000 | $4,580,000 |
| Venezuela | Tourism | $150,000 | $1,520,000 |
| Vietnam | Fisheries & Aquaculture | $8,000,000 | $133,340,000 |
| Vietnam | Government | $74,090,000 | $198,040,000 |
| Vietnam | Tourism | $1,860,000 | $18,590,000 |
| South Africa | Tourism | $530,000 | $5,270,000 |
| South Africa | Fisheries & Aquaculture | $120,000 | $2,000,000 |
| South Africa | Government | $1,810,000 | $6,600,000 |
The direct costs of cleaning coastlines, waterways, marinas, and ports make up the lion’s share, between $5.6 and $15.0 billion in government expenditures.
But clean-up costs aren’t the only impact. Polluted beaches and stranded debris also have an impact on tourism, estimated to be between $237.8 million and $2.4 billion.
And while the harm to marine ecosystems can’t be overstated, the cost to fisheries and aquaculture, and the communities that depend on them, is real. It adds up to between $114.4 million and $1.9 billion annually.
Streams of Plastic, Rivers of Pollution
But where does all this plastic come from?
According to the most recent estimates, as many as 1,656 rivers contribute 80% of the plastic pollution that makes it into the ocean. This 2021 study updates earlier estimates that pinned much of the blame on only a handful of rivers.
| River | Country | Share of global plastic pollution emitted to ocean |
|---|---|---|
| Pasig | Philippines | 6.43% |
| Tullahan | Philippines | 1.33% |
| Ulhas | India | 1.33% |
| Klang | Malaysia | 1.33% |
| Meycauayan | Philippines | 1.23% |
| Pampanga | Philippines | 0.95% |
| Libmanan | Philippines | 0.72% |
| Ganges | India | 0.63% |
| Rio Grande de Mindanao | Philippines | 0.54% |
| Agno | Philippines | 0.47% |
| Agusan | Philippines | 0.47% |
| Paranaque | Philippines | 0.45% |
| Iloilo | Philippines | 0.43% |
| Soai Rap | Vietnam | 0.42% |
| Chao Phraya | Thailand | 0.41% |
| Lagos Harbour | Nigeria | 0.41% |
| Hugli | India | 0.40% |
| Huangpu | China | 0.37% |
| Pazundaung Creek | Myanmar | 0.37% |
| Bharathappuzha | India | 0.36% |
| Ebrie Lagoon Komoe | Ivory Coast | 0.34% |
| Sarawak | Malaysia | 0.34% |
| Msimbazi River | Dar Es Salaam | 0.33% |
| Imus | Philippines | 0.32% |
| Chenzhen River | China | 0.30% |
| Wouri River | Cameroon | 0.29% |
| Langat | Malaysia | 0.29% |
| Cilliwung | Indonesia | 0.29% |
| Zapote | Philippines | 0.28% |
| Malad Creek | India | 0.28% |
| Kelani | Sri Lanka | 0.28% |
| Cagayan de Oro | Philippines | 0.27% |
| Davao River | Philippines | 0.27% |
| Karnaphuli | Bangladesh | 0.27% |
| Rio Pavuna | Brazil | 0.27% |
| Panvel Creek | India | 0.26% |
| Yangon River | Myanmar | 0.26% |
| Malaking Tubiq | Philippines | 0.26% |
| Zhujiang/Canton | China | 0.26% |
| Tambo, Pasay (storm drain) | Philippines | 0.26% |
| Kelantan | Malaysia | 0.26% |
| Jalaur River | Philippines | 0.23% |
| Douala Estuary | Cameroon | 0.23% |
| Chilyar | India | 0.23% |
| Periyar River | India | 0.23% |
| Cagayan River | Philippines | 0.23% |
| Sungai Kuantan | Malaysia | 0.22% |
| Mithi River | India | 0.22% |
| Rio Ozama | Dominican Republic | 0.22% |
| Hamulauon | Philippines | 0.22% |
The top 10 rivers are all in Asia. And this makes sense when you think about it. Asia is home to most of the world’s population and to many developing countries with poor waste management systems. Many parts of Asia, especially in the Southeast, also have heavy precipitation, which is a contributing factor. Proximity to a city is also important, as is the distance to the coast. In fact, the top three emitting rivers go through major coastal cities Manila, Kuala Lumpur, and Mumbai.
As a result, not only is Asia the biggest source of plastic pollution, a staggering 81% according to study authors, but it also has the highest direct and indirect costs from plastic pollution, between $5.4 and $16.4 billion per year.
So What’s to be Done?
The OECD estimated that global plastic pollution could nearly triple to 1.0 billion metric tons by 2060. And while they estimate that the share of plastic that escapes waste management systems will fall from 22% (2019) to 17% (2060), that’s still a lot of plastic to deal with.
Not surprisingly, the tide is turning against single-use plastics and many governments have already banned the worst offenders. Bangladesh was the first country to ban plastic bags in 2002, while the U.S. banned microbeads in personal care products in 2015, followed by the UK (2018), Canada (2018), and then China (2020-2022).
At the international level, 170 countries recently agreed to have a first draft of a global plastics treaty ready by November 2023.
Momentum is Growing Against Plastic Cigarette Filters
Single-use plastic cigarette filters, which routinely top the Ocean Conservancy’s annual International Coastal Cleanup, are also coming under scrutiny.
The EU’s Single-Use Plastic Directive stopped short of banning plastic filters outright, but it did mark them for reduction measures. Germany, on the other hand, will soon require plastic manufacturers to pay into a central clean-up fund. It is expected to bring in €450 million during the first year alone and impacts producers of drink containers, food wrappers, and yes, cigarette filters.
So, with the tide turning against cigarette filters, what’s next for the world’s number one plastic pollution problem?
Learn more about Greenbutts, creator of a certified biodegradable, plant-based alternative to plastic cigarette filters.

-

 Green10 hours ago
The Carbon Footprint of Major Travel Methods
Going on a cruise ship and flying domestically are the most carbon-intensive travel methods.
-

 Green2 weeks ago
Ranking the Top 15 Countries by Carbon Tax Revenue
This graphic highlights France and Canada as the global leaders when it comes to generating carbon tax revenue.
-

 Green2 weeks ago
Ranked: The Countries With the Most Air Pollution in 2023
South Asian nations are the global hotspot for pollution. In this graphic, we rank the world’s most polluted countries according to IQAir.
-

 Green2 weeks ago
Top Countries By Forest Growth Since 2001
One country is taking reforestation very seriously, registering more than 400,000 square km of forest growth in two decades.
-

 Green3 weeks ago
Ranked: Top Countries by Total Forest Loss Since 2001
The country with the most forest loss since 2001 lost as much forest cover as the next four countries combined.
-

 Agriculture2 months ago
The World’s Top Cocoa Producing Countries
Here are the largest cocoa producing countries globally—from Côte d’Ivoire to Brazil—as cocoa prices hit record highs.