Economic Growth Forecasts for G7 and BRICS Countries in 2024
U.S. Debt Interest Payments Reach $1 Trillion
Ranked: The Largest U.S. Corporations by Number of Employees
The Top 10 States by Real GDP Growth in 2023
Ranked: The World’s Top Flight Routes, by Revenue
All of the Grants Given by the U.S. CHIPS Act
Visualizing AI Patents by Country
How Tech Logos Have Evolved Over Time
Ranked: Semiconductor Companies by Industry Revenue Share
The Stock Performance of U.S. Chipmakers So Far in 2024
Charted: Which Country Has the Most Billionaires in 2024?
Charted: Which City Has the Most Billionaires in 2024?
Charted: Who Has Savings in This Economy?
How Debt-to-GDP Ratios Have Changed Since 2000
The Smallest Gender Wage Gaps in OECD Countries
The Cost of an EpiPen in Major Markets
Charted: Global Tobacco Use by Country and Sex
Visualized: What Lives in Your Gut Microbiome?
Charted: Average Years Left to Live by Age
Charted: The Average Cost of Insulin By Country
Ranked: The Top 10 EV Battery Manufacturers in 2023
The World’s Biggest Nuclear Energy Producers
The World’s Biggest Oil Producers in 2023
How Much Does the U.S. Depend on Russian Uranium?
Charted: Global Uranium Reserves, by Country
The Largest Earthquakes in the New York Area (1970-2024)
Mapped: Average Wages Across Europe
Mapped: Asia’s Population Patterns by Density
A Map of Global Happiness By Country in 2024
Mapped: Population Growth by Region (1900-2050F)
Gold vs. S&P 500: Which Has Grown More Over Five Years?
Charted: The Value Gap Between the Gold Price and Gold Miners
The Periodic Table of Commodity Returns (2014-2023)
The Carbon Footprint of Major Travel Methods
Ranking the Top 15 Countries by Carbon Tax Revenue
Ranked: The Countries With the Most Air Pollution in 2023
Top Countries By Forest Growth Since 2001
Ranked: Top Countries by Total Forest Loss Since 2001
...11 GW 21 GW 32 GW United Kingdom 60% renewables by 2030 4 GW 3 GW 7 GW 4 GW 1 GW 5 GW European Union...
...a net-zero future. Investing in Copper for a Prosperous Future Investors looking for copper exposure may want to consider an ETF that tracks an index that...
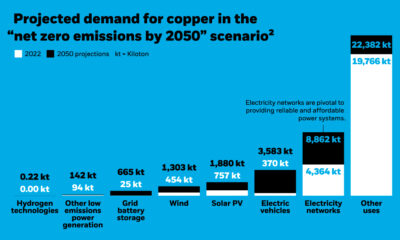
...Global forecasts expect $700 billion per year of renewable energy investment through 2050. However, under a net-zero model, an annual figure of $1.4 trillion would be...
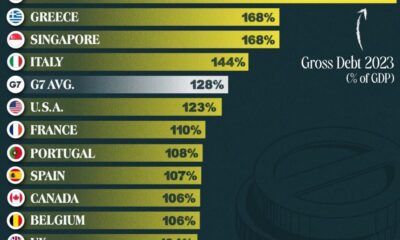
...However, a high gross debt-to-GDP ratio (over 100%) is not always a cause for concern. Net ratios that take intergovernmental holdings into account can indicate exposure...
...Mukesh Ambani, is India’s richest person with a net worth of $95.6 billion. The company was founded by his late father Dhirubhai Ambani, a yarn trader,...
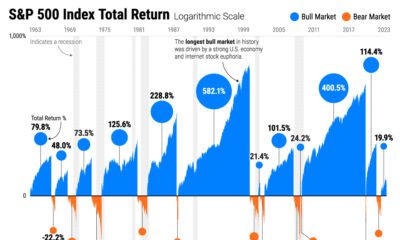
...the loss. The good news is that the S&P 500 has seen +11.5% average historical returns since 1928. Overall, the majority of stock market cycles take...
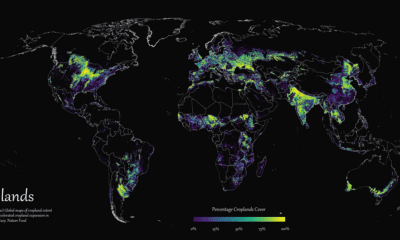
...lost in natural disasters, or repurposed for housing, irrigation, and other infrastructural needs. Despite this, the creation of new croplands increased overall cropland cover by around...
...to a specific net worth. Instead, when looking at the data, we see that Americans prioritize the freedom of incremental goals. Most of those surveyed agreed...
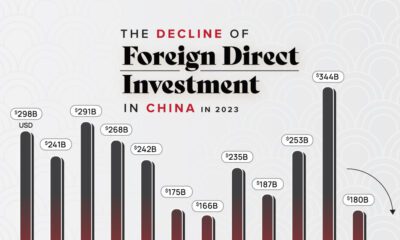
...the Chinese Economy The Peterson Institute’s comparison of gross and net FDI flows found a nearly $100 billion shortfall—which means foreign firms are selling their Chinese...
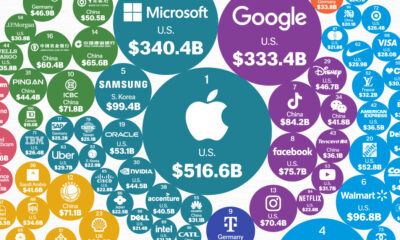
...U.S. $70.4B +48.5% 14 China Construction Bank 🇨🇳 China $65.6B +4.7% 15 Starbucks 🇺🇸 U.S. $60.7B +13.5% 16 Agricultural Bank Of China 🇨🇳 China $60.4B +4.7%...


 Creator Program