Markets
Mapped: The Top 30 Most Valuable Real Estate Cities in the U.S.


The Most Valuable Real Estate Cities in America
According to real estate tycoon Harold Samuel, there are three things that matter when it comes to real estate value—location, location, and location.
America’s property market is no exception to this rule. Depending on the city and its—you guessed it—location, there are vast discrepancies in real estate value across the country.
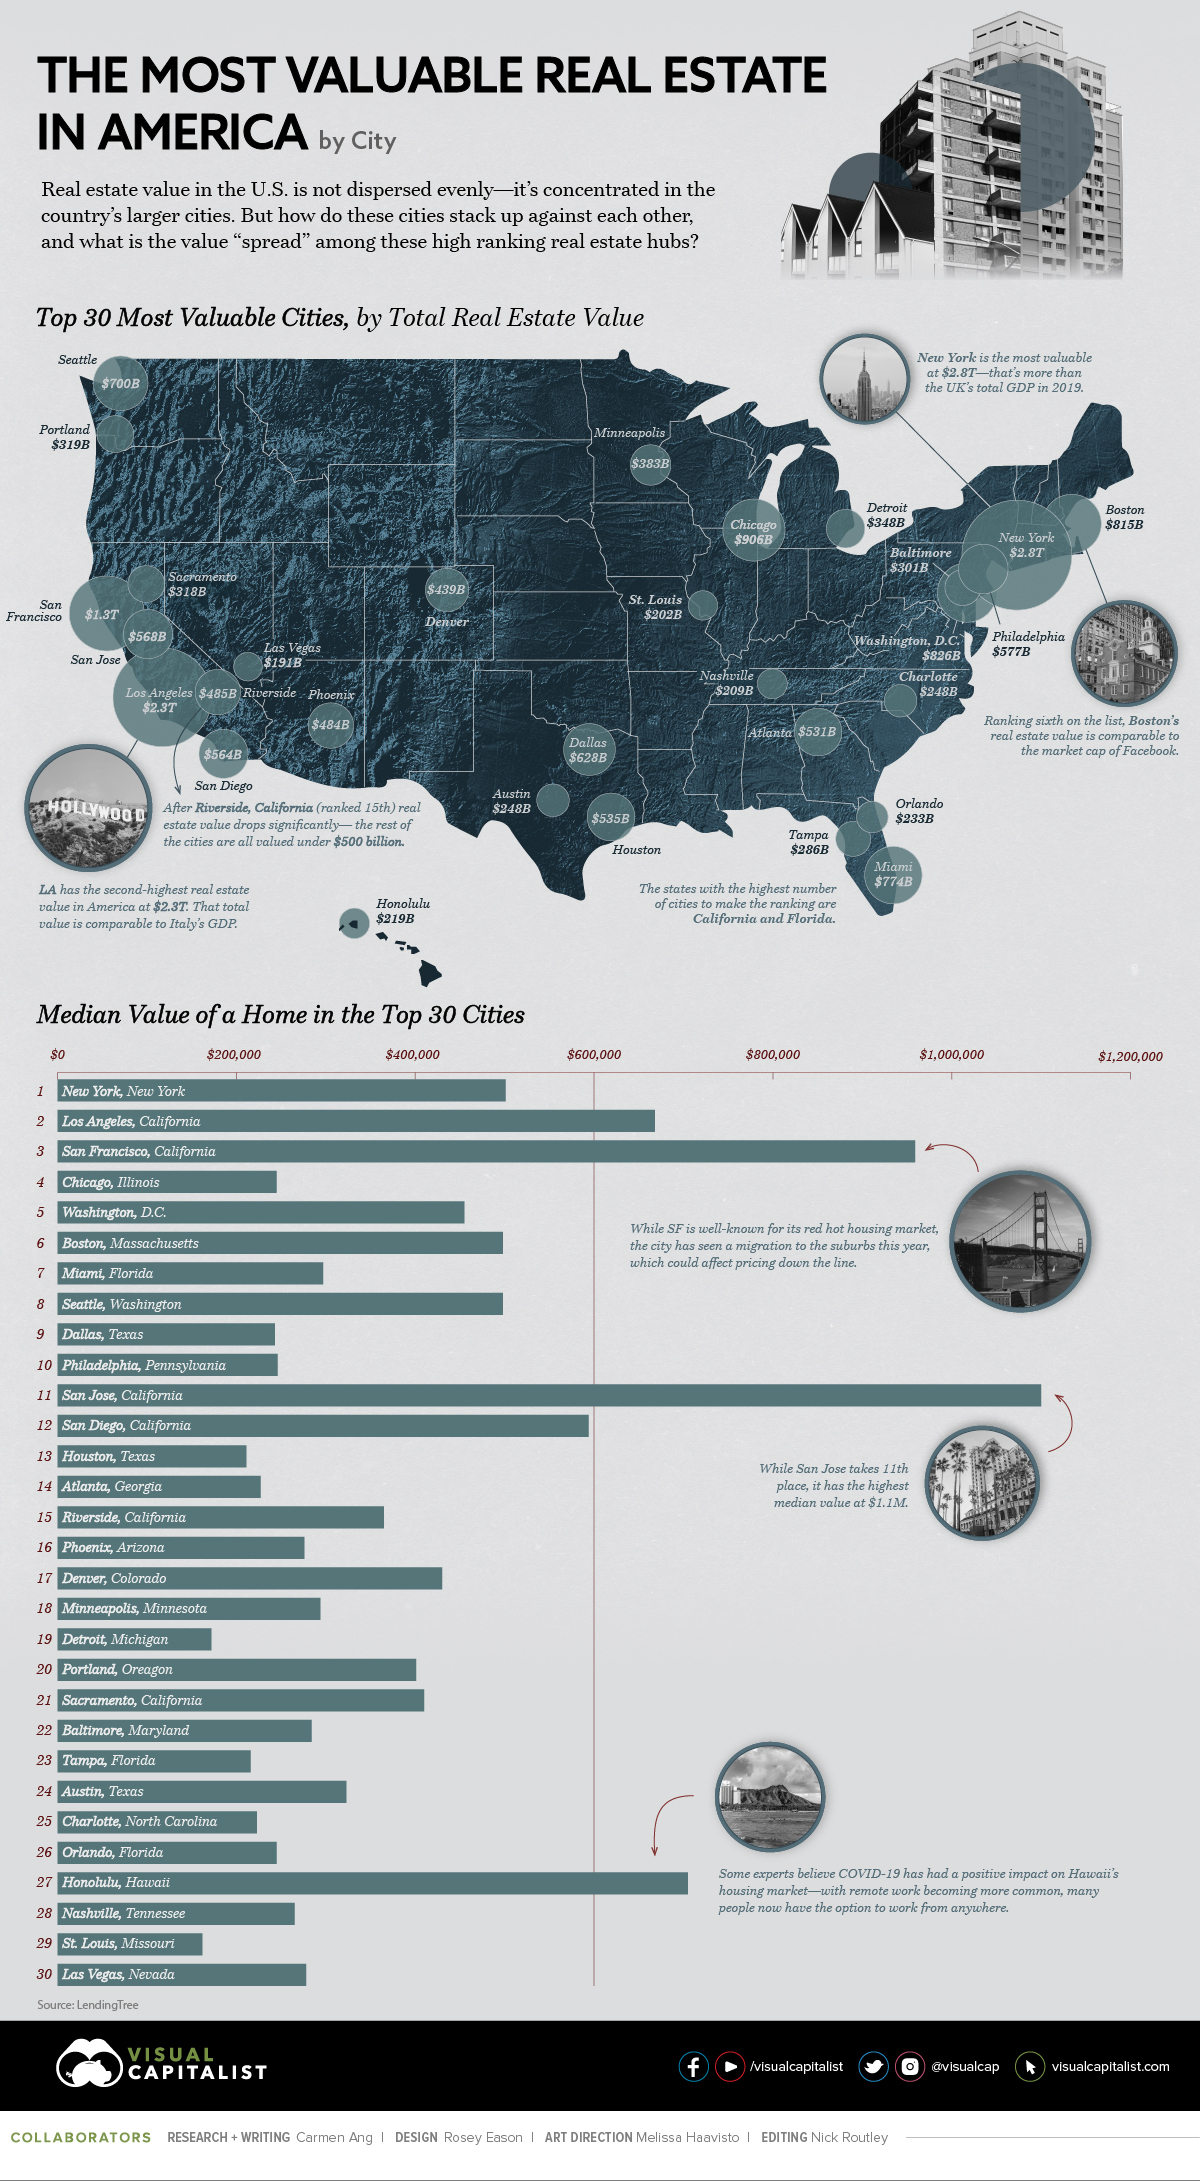
Using the latest data from LendingTree, this graphic ranks the top 30 most valuable real estate cities in America. We’ll also evaluate the top cities based on median value of homes, and how COVID-19 has impacted the market.
The Most Valuable Real Estate Cities
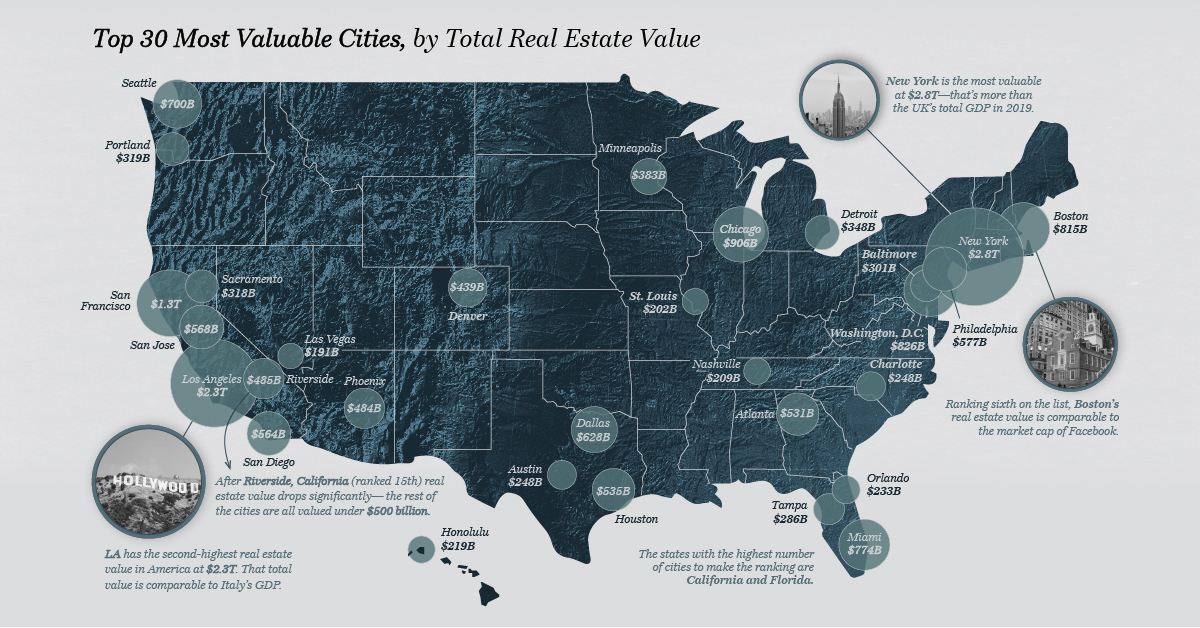
Out of the $32.6 trillion of total real estate value included in LendingTree’s database, the top 30 cities account for almost 57%:
| Rank | City | State | Total Value (in billions) |
|---|---|---|---|
| 1 | New York | New York | $2,838 |
| 2 | Los Angeles | California | $2,289 |
| 3 | San Francisco | California | $1,320 |
| 4 | Chicago | Illinois | $906 |
| 5 | Washington, D.C. | -- | $826 |
| 6 | Boston | Massachusetts | $815 |
| 7 | Miami | Florida | $774 |
| 8 | Seattle | Washington | $700 |
| 9 | Dallas | Texas | $628 |
| 10 | Philadelphia | Pennsylvania | $577 |
| 11 | San Jose, Calif. | California | $568 |
| 12 | San Diego | California | $564 |
| 13 | Houston | Texas | $535 |
| 14 | Atlanta | Georgia | $531 |
| 15 | Riverside, Calif. | California | $485 |
| 16 | Phoenix | Arizona | $484 |
| 17 | Denver | Colorado | $439 |
| 18 | Minneapolis | Minnesota | $383 |
| 19 | Detroit | Michigan | $348 |
| 20 | Portland, Ore. | Oregon | $319 |
| 21 | Sacramento, Calif. | California | $318 |
| 22 | Baltimore | Maryland | $301 |
| 23 | Tampa, Fla. | Florida | $286 |
| 24 | Austin, Texas | Texas | $248 |
| 25 | Charlotte, N.C | North Carolina | $248 |
| 26 | Orlando, Fla. | Florida | $233 |
| 27 | Honolulu | Hawaii | $219 |
| 28 | Nashville, Tenn. | Tennessee | $209 |
| 29 | St. Louis | Missouri | $202 |
| 30 | Las Vegas | Nevada | $191 |
New York has the highest real estate value in the country at $2.8 trillion—that’s around the size of the UK’s GDP in 2019. Close behind is Los Angeles at $2.3 trillion, while San Francisco ranks third at $1.3 trillion.
This may not come as a surprise, considering the popularity of these areas. New York and Los Angeles have the two highest city populations in the U.S., and San Francisco is the second most densely populated city in America (after New York). Historically, these areas have been notorious for their red-hot real estate markets, limited housing supply, and high costs of living.
However, while these cities take the top three spots when it comes to total real estate value, the ranking looks a bit different when comparing the median value of each city.
Most Valuable Cities, by Median Home Value
When it comes to median home value, San Jose claims the top spot at $1.1 million, while San Francisco places second at $959K:
| Rank | City | State | Median Value of a Home |
|---|---|---|---|
| 1 | San Jose | California | $1,100,000 |
| 2 | San Francisco | California | $959,000 |
| 3 | Honolulu | Hawaii | $705,000 |
| 4 | Los Angeles | California | $668,000 |
| 5 | San Diego | California | $594,000 |
| 6 | Oxnard | California | $586,000 |
| 7 | New York | New York | $501,000 |
| 8 | Boston | Massachusetts | $498,000 |
| 9 | Seattle | Washington | $498,000 |
| 10 | Washington, D.C. | -- | $455,000 |
| 11 | Denver | Colorado | $430,000 |
| 12 | Sacramento | California | $410,000 |
| 13 | Bridgeport | Connecticut | $410,000 |
| 14 | Portland | Oregon | $401,000 |
| 15 | Riverside | California | $365,000 |
| 16 | Naples | Florida | $329,000 |
| 17 | Austin | Texas | $323,000 |
| 18 | Salt Lake City | Utah | $312,000 |
| 19 | Providence | Rhode Island | $300,000 |
| 20 | Miami | Florida | $297,000 |
| 21 | Minneapolis | Minnesota | $294,000 |
| 22 | Baltimore | Maryland | $284,000 |
| 23 | Las Vegas | Nevada | $278,000 |
| 24 | Phoenix | Arizona | $276,000 |
| 25 | Raleigh | North Carolina | $271,000 |
| 26 | Nashville | Tennessee | $265,000 |
| 27 | Philadelphia | Pennsylvania | $246,000 |
| 28 | Chicago | Illinois | $245,000 |
| 29 | Orlando | Florida | $245,000 |
| 30 | North Port | Florida | $244,000 |
The Bay Area leads the pack in terms of median value, but San Francisco and San Jose aren’t the only Californian cities to make the list. In fact, half of the top 10 cities are in the Golden State.
Suburban Shuffle
It’s important to note that these numbers are from January 2020, before the global pandemic triggered numerous societal and economic changes, including an accelerated migration to the suburbs from key urban centers like New York and San Francisco.
This mass exodus has negatively impacted sales activity. In fall 2020, or example, home sales in New York dropped by 50% compared to last year.
In contrast, places like Honolulu have seen significant growth in home sales—in September 2020, single-family home sales rose by 12.7% compared to last year. Some experts believe COVID has been a key factor driving this growth, as more people are able to work from anywhere, thanks to remote work.


Markets
The European Stock Market: Attractive Valuations Offer Opportunities
On average, the European stock market has valuations that are nearly 50% lower than U.S. valuations. But how can you access the market?


European Stock Market: Attractive Valuations Offer Opportunities
Europe is known for some established brands, from L’Oréal to Louis Vuitton. However, the European stock market offers additional opportunities that may be lesser known.
The above infographic, sponsored by STOXX, outlines why investors may want to consider European stocks.
Attractive Valuations
Compared to most North American and Asian markets, European stocks offer lower or comparable valuations.
| Index | Price-to-Earnings Ratio | Price-to-Book Ratio |
|---|---|---|
| EURO STOXX 50 | 14.9 | 2.2 |
| STOXX Europe 600 | 14.4 | 2 |
| U.S. | 25.9 | 4.7 |
| Canada | 16.1 | 1.8 |
| Japan | 15.4 | 1.6 |
| Asia Pacific ex. China | 17.1 | 1.8 |
Data as of February 29, 2024. See graphic for full index names. Ratios based on trailing 12 month financials. The price to earnings ratio excludes companies with negative earnings.
On average, European valuations are nearly 50% lower than U.S. valuations, potentially offering an affordable entry point for investors.
Research also shows that lower price ratios have historically led to higher long-term returns.
Market Movements Not Closely Connected
Over the last decade, the European stock market had low-to-moderate correlation with North American and Asian equities.
The below chart shows correlations from February 2014 to February 2024. A value closer to zero indicates low correlation, while a value of one would indicate that two regions are moving in perfect unison.
| EURO STOXX 50 | STOXX EUROPE 600 | U.S. | Canada | Japan | Asia Pacific ex. China |
|
|---|---|---|---|---|---|---|
| EURO STOXX 50 | 1.00 | 0.97 | 0.55 | 0.67 | 0.24 | 0.43 |
| STOXX EUROPE 600 | 1.00 | 0.56 | 0.71 | 0.28 | 0.48 | |
| U.S. | 1.00 | 0.73 | 0.12 | 0.25 | ||
| Canada | 1.00 | 0.22 | 0.40 | |||
| Japan | 1.00 | 0.88 | ||||
| Asia Pacific ex. China | 1.00 |
Data is based on daily USD returns.
European equities had relatively independent market movements from North American and Asian markets. One contributing factor could be the differing sector weights in each market. For instance, technology makes up a quarter of the U.S. market, but health care and industrials dominate the broader European market.
Ultimately, European equities can enhance portfolio diversification and have the potential to mitigate risk for investors.
Tracking the Market
For investors interested in European equities, STOXX offers a variety of flagship indices:
| Index | Description | Market Cap |
|---|---|---|
| STOXX Europe 600 | Pan-regional, broad market | €10.5T |
| STOXX Developed Europe | Pan-regional, broad-market | €9.9T |
| STOXX Europe 600 ESG-X | Pan-regional, broad market, sustainability focus | €9.7T |
| STOXX Europe 50 | Pan-regional, blue-chip | €5.1T |
| EURO STOXX 50 | Eurozone, blue-chip | €3.5T |
Data is as of February 29, 2024. Market cap is free float, which represents the shares that are readily available for public trading on stock exchanges.
The EURO STOXX 50 tracks the Eurozone’s biggest and most traded companies. It also underlies one of the world’s largest ranges of ETFs and mutual funds. As of November 2023, there were €27.3 billion in ETFs and €23.5B in mutual fund assets under management tracking the index.
“For the past 25 years, the EURO STOXX 50 has served as an accurate, reliable and tradable representation of the Eurozone equity market.”
— Axel Lomholt, General Manager at STOXX
Partnering with STOXX to Track the European Stock Market
Are you interested in European equities? STOXX can be a valuable partner:
- Comprehensive, liquid and investable ecosystem
- European heritage, global reach
- Highly sophisticated customization capabilities
- Open architecture approach to using data
- Close partnerships with clients
- Part of ISS STOXX and Deutsche Börse Group
With a full suite of indices, STOXX can help you benchmark against the European stock market.
Learn how STOXX’s European indices offer liquid and effective market access.

-

 Economy2 days ago
Economic Growth Forecasts for G7 and BRICS Countries in 2024
The IMF has released its economic growth forecasts for 2024. How do the G7 and BRICS countries compare?
-

 Markets1 week ago
U.S. Debt Interest Payments Reach $1 Trillion
U.S. debt interest payments have surged past the $1 trillion dollar mark, amid high interest rates and an ever-expanding debt burden.
-

 United States2 weeks ago
Ranked: The Largest U.S. Corporations by Number of Employees
We visualized the top U.S. companies by employees, revealing the massive scale of retailers like Walmart, Target, and Home Depot.
-

 Markets2 weeks ago
The Top 10 States by Real GDP Growth in 2023
This graphic shows the states with the highest real GDP growth rate in 2023, largely propelled by the oil and gas boom.
-

 Markets2 weeks ago
Ranked: The World’s Top Flight Routes, by Revenue
In this graphic, we show the highest earning flight routes globally as air travel continued to rebound in 2023.
-

 Markets2 weeks ago
Ranked: The Most Valuable Housing Markets in America
The U.S. residential real estate market is worth a staggering $47.5 trillion. Here are the most valuable housing markets in the country.

-

 Education1 week ago
How Hard Is It to Get Into an Ivy League School?
-

 Technology2 weeks ago
Ranked: Semiconductor Companies by Industry Revenue Share
-
Markets2 weeks ago
Ranked: The World’s Top Flight Routes, by Revenue
-

 Demographics2 weeks ago
Population Projections: The World’s 6 Largest Countries in 2075
-
Markets2 weeks ago
The Top 10 States by Real GDP Growth in 2023
-

 Demographics2 weeks ago
The Smallest Gender Wage Gaps in OECD Countries
-

 Economy2 weeks ago
Where U.S. Inflation Hit the Hardest in March 2024
-

 Green2 weeks ago
Top Countries By Forest Growth Since 2001