Money
Visualized: The Most (and Least) Expensive Cities to Live In


Visualizing The Most (and Least) Expensive Cities to Live In
There are many benefits to living in an iconic city like New York or Singapore, but the amenities and exclusivity can come at a high cost.
Cities become “expensive” due to a variety of factors such as high demand for housing, a concentration of high-paying businesses and industries, and a high standard of living. Additionally, factors such as taxes, transportation costs, and availability of goods and services can also contribute to the overall cost of living in global cities.
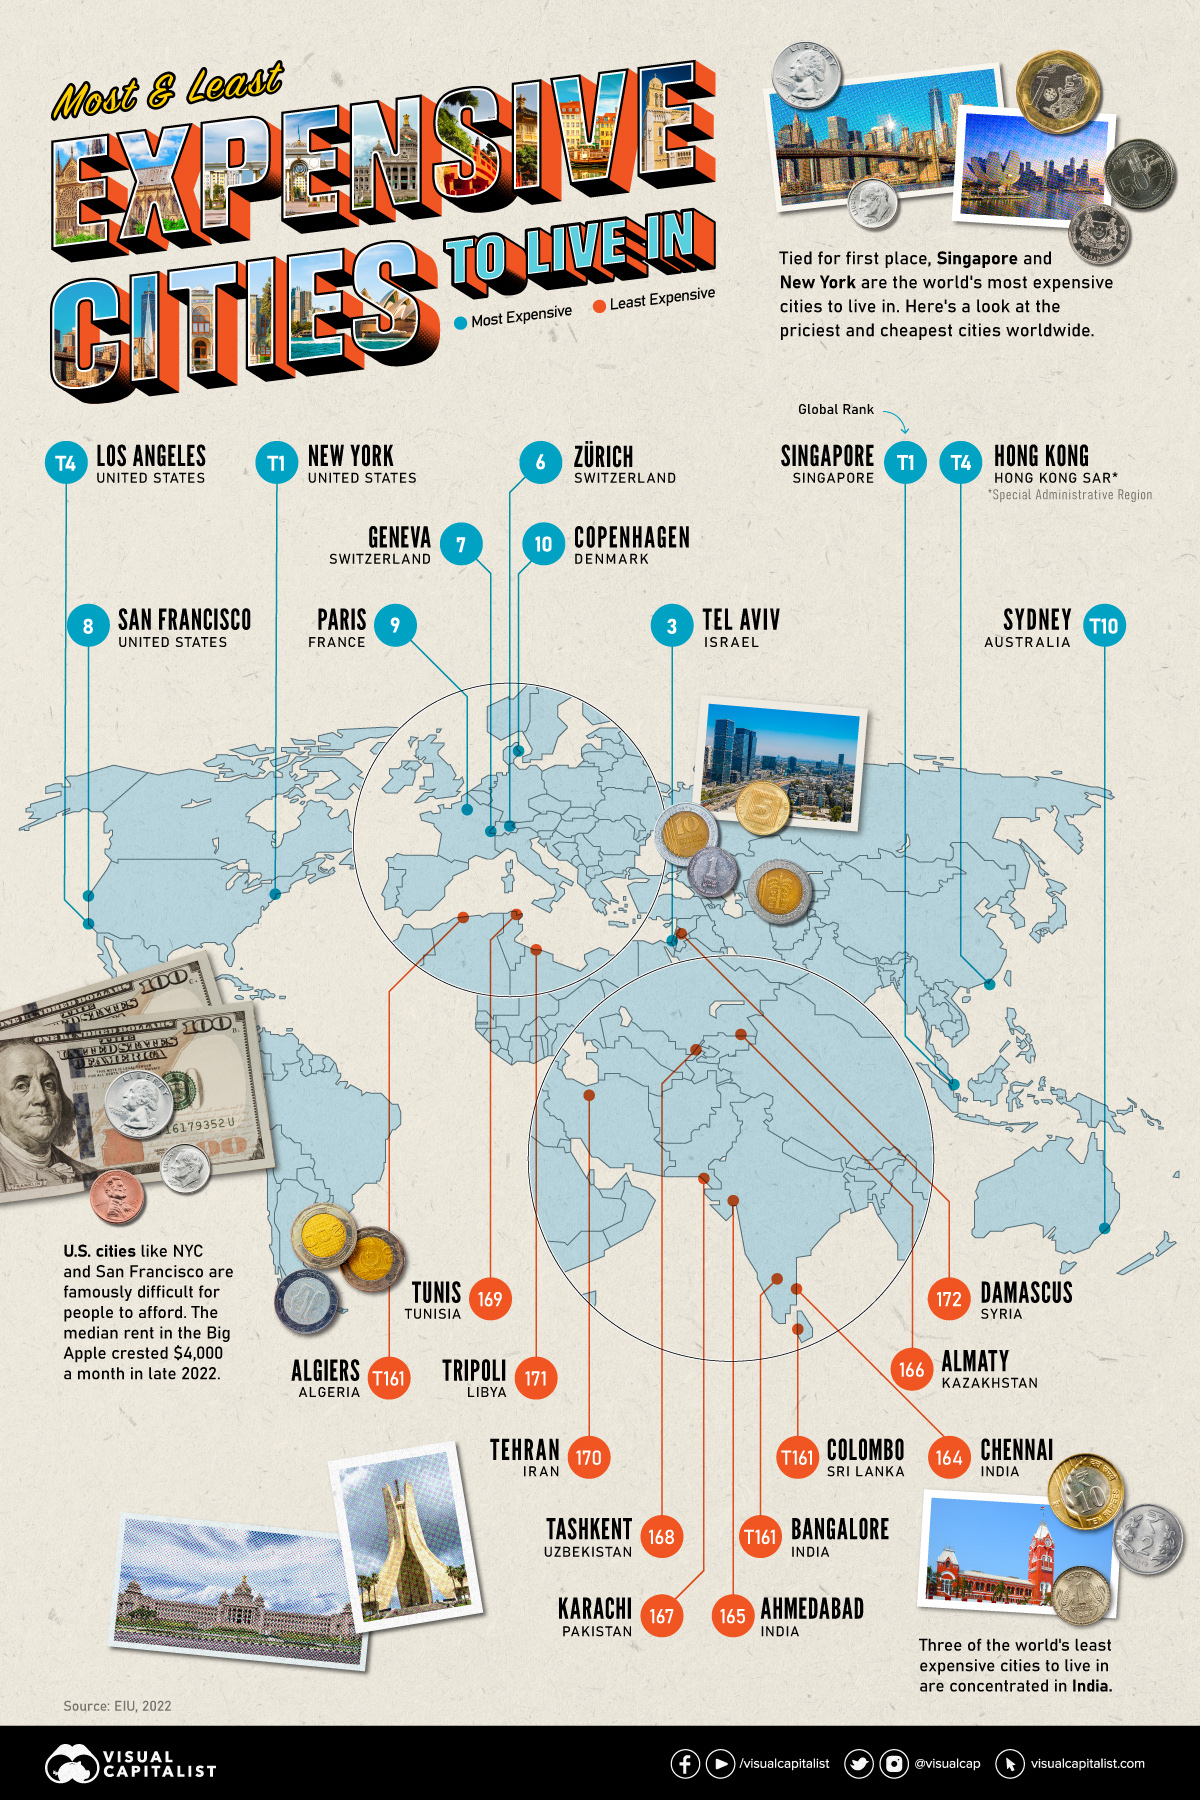
The infographic above uses data from EIU to rank the world most and least expensive cities to live in. To make the list, the EIU examines 400+ prices for over 200 products and services in 172 cities, surveying a variety of businesses to track price fluctuations over the last year.
Inflation + Strong Currency = Expensive Cities
If you live in a city where many residents find it challenging to put a roof over their heads, food on their plates, and make ends meet, you live in an expensive city.
But if this inflation is compounded with a strong national currency, you may live in one of the world’s most expensive cities.
| Rank | City | Country | Index Score |
|---|---|---|---|
| #1 | Singapore | 🇸🇬 Singapore | 100 |
| #1 | New York | 🇺🇸 U.S. | 100 |
| #3 | Tel Aviv | 🇮🇱 Israel | 99 |
| #4 | Hong Kong | 🇭🇰 Hong Kong | 98 |
| #4 | Los Angeles | 🇺🇸 U.S. | 98 |
| #6 | Zurich | 🇨🇭 Switzerland | 94 |
| #7 | Geneva | 🇨🇭 Switzerland | 91 |
| #8 | San Francisco | 🇺🇸 U.S. | 85 |
| #9 | Paris | 🇫🇷 France | 84 |
| #10 | Copenhagen | 🇩🇰 Denmark | 83 |
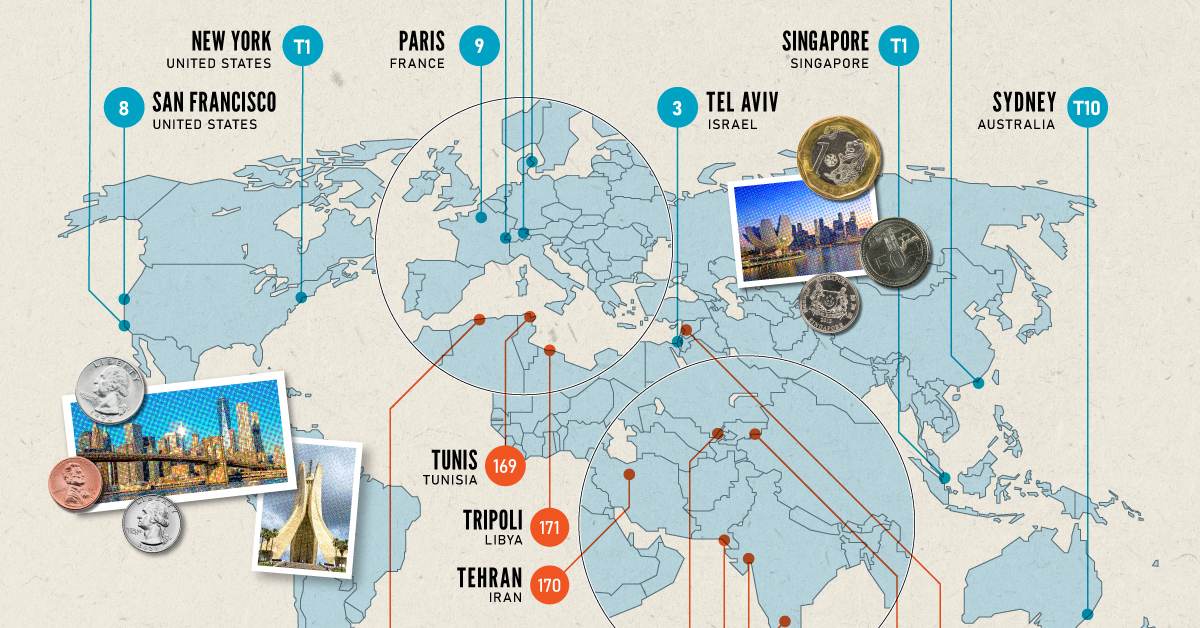
Singapore and New York City tied for the first rank amongst the world’s most expensive cities in 2022, pushing Israel’s Tel Aviv from the first place in 2021 to the third place in 2022. Both these cities had high inflation and a strong currency. Surprisingly, this is the Big Apple’s first time atop the ranking.
The city with one of the most expensive real estate markets worldwide, Hong Kong ranked fourth in this list, followed by Los Angeles, which moved up from its ninth rank in 2021.
Poor Economies = Cheaper Cities
Asia continues to dominate the list of the world’s least expensive cities, followed by parts of North Africa and the Middle East. Though affordability sounds good at face value, sitting at the bottom of the ranking isn’t necessarily a coveted position.
While the cost of living in some of the cities in these nations is low, it comes at the price of a weak currency, poor economy, and, in many cases, political and economic turmoil.
| Rank | City | Country | Index Score |
|---|---|---|---|
| #161 | Colombo | 🇱🇰 Sri Lanka | 38 |
| #161 | Bangalore | 🇮🇳 India | 38 |
| #161 | Algiers | 🇩🇿 Algeria | 38 |
| #164 | Chennai | 🇮🇳 India | 37 |
| #165 | Ahmedabad | 🇮🇳 India | 35 |
| #166 | Almaty | 🇰🇿 Kazakhstan | 34 |
| #167 | Karachi | 🇵🇰 Pakistan | 32 |
| #168 | Tashkent | 🇺🇿 Uzbekistan | 31 |
| #169 | Tunis | 🇹🇳 Tunisia | 30 |
| #170 | Tehran | 🇮🇷 Iran | 23 |
| #171 | Tripoli | 🇱🇾 Libya | 22 |
| #172 | Dasmascus | 🇸🇾 Syria | 11 |
The decade-long conflict in Syria weakened the Syrian pound, led to a spiraling inflation and fuel shortages, and further collapsed its economy. It’s no surprise that its capital city of Damascus has maintained its position as the world’s cheapest city.
Tripoli and Tehran, the capitals of Libya and Iran, respectively, follow next on this list, reflecting their weakened economies.
Meanwhile, seven cities in Asia with the common denominator of high-income inequality and low wages dominate the list of the world’s cheapest cities. These include three Indian cities, Tashkent in Uzbekistan, Almaty in Kazakhstan, Pakistan’s most populous city of Karachi, and Sri Lankan capital–Colombo.


Wealth
Charted: What Frustrates Americans About the Tax System
A survey during peak tax filing season reveals two big complaints that Americans have with the federal tax system.
What Frustrates Americans About the Tax System
This was originally posted on our Voronoi app. Download the app for free on Apple or Android and discover incredible data-driven charts from a variety of trusted sources.
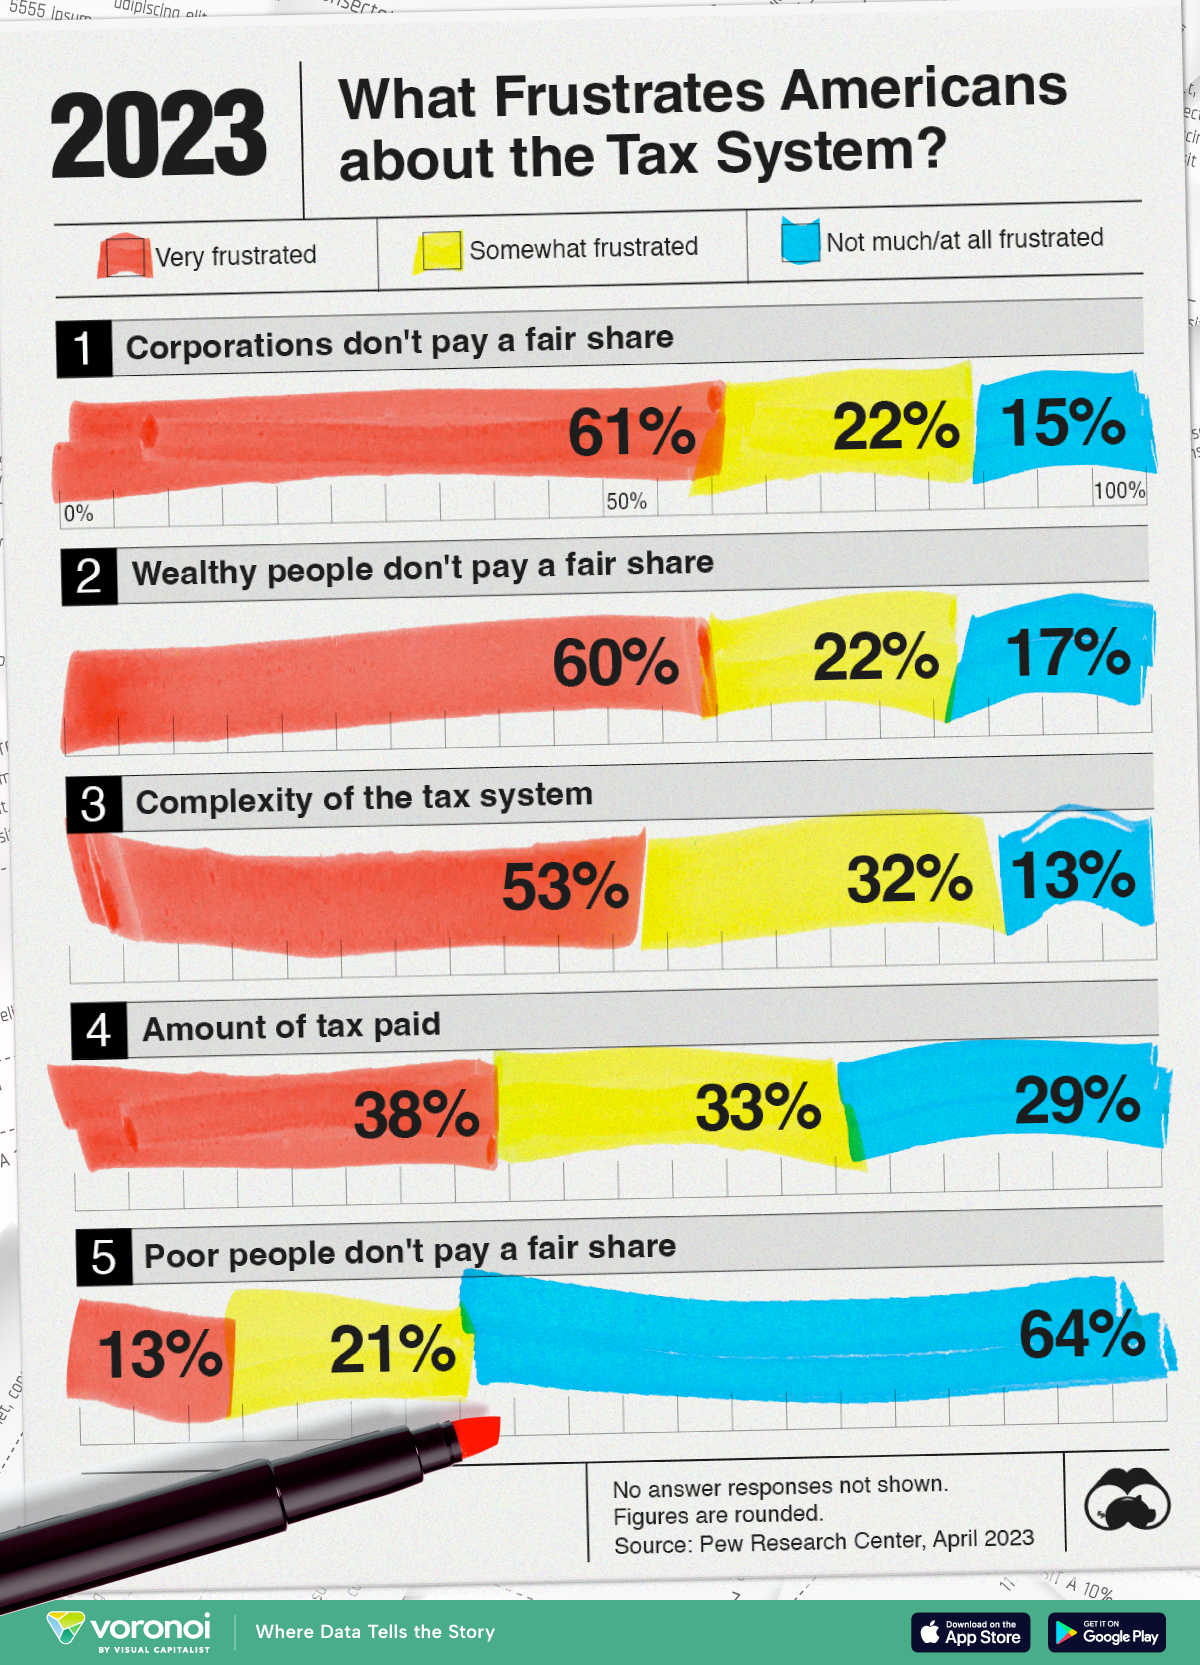
In this visualization, we show Pew Research’s findings on what bothers Americans the most about the tax system.
This data was collected after surveying more than 5,000 American adults between the period of March 27-April 2, 2023.
The survey was weighted to be representative of the U.S. adult population. Visit Pew Research’s methodology page for more details.
Americans Want More Taxes for Some
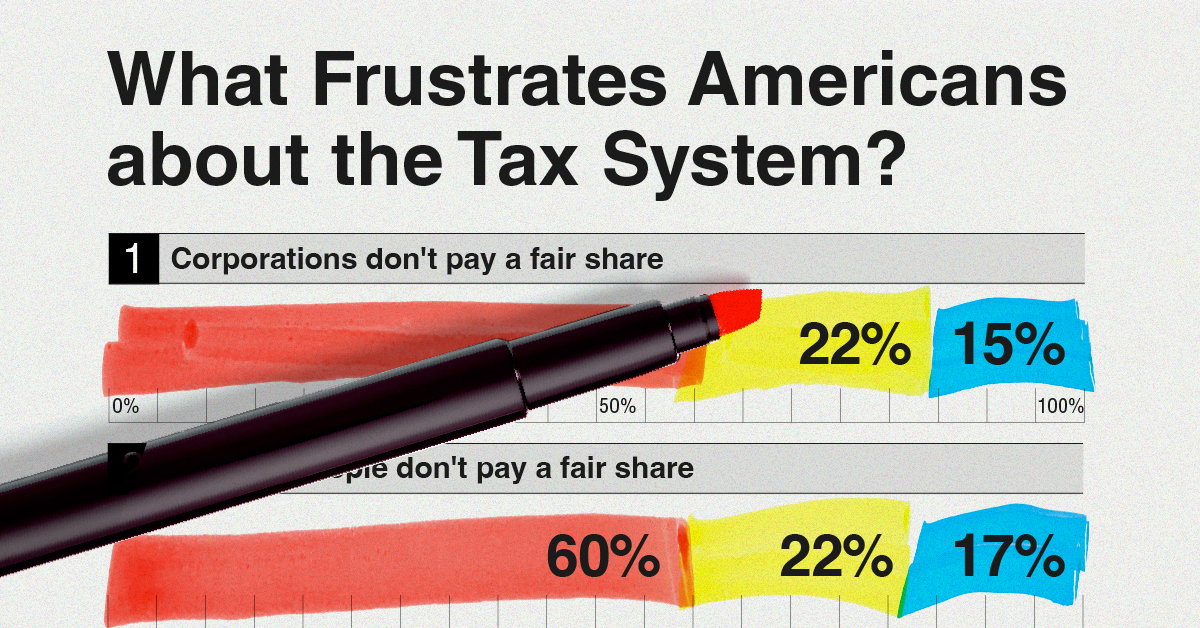
Six in every 10 Americans feel that both corporations and the wealthy don’t pay their fair share in federal taxes.
Their sentiments are not entirely unfounded.
| Very frustrated | Somewhat frustrated | Not much/ at all frustrated |
|
|---|---|---|---|
| 🏦 Corporations don't pay a fair share | 61% | 22% | 15% |
| 💼 Wealthy people don't pay a fair share | 60% | 22% | 17% |
| 🤔 Complexity of the tax system | 53% | 32% | 13% |
| 💸 Amount of tax paid | 38% | 33% | 29% |
| 🧑🤝🧑 Poor people don't pay a fair share | 13% | 21% | 64% |
Note: No answer responses are not shown, thus percentages may not sum to 100.
A 2021 ProPublica investigation found some of the wealthiest Americans—also the wealthiest people in the world—did not pay a single penny in federal income taxes in some years.
A significant part of why this is possible is how taxes are collected depending on the source. Since much of the top 1% grow their wealth in equity and property, they are not subject to taxes until they make an actual transaction.
As this Brookings Institution article explains: most Americans make money through their wages, and wages are subject to heavier taxation than capital income. Thus, the tax share of America’s highest-income households is often lower than America’s middle-income households.
Finally, Pew Research noted that their findings were essentially unchanged since 2021.

-

 Markets6 days ago
Visualized: Interest Rate Forecasts for Advanced Economies
-

 Markets2 weeks ago
Economic Growth Forecasts for G7 and BRICS Countries in 2024
-

 Wealth2 weeks ago
Charted: Which City Has the Most Billionaires in 2024?
-

 Technology2 weeks ago
All of the Grants Given by the U.S. CHIPS Act
-

 Green2 weeks ago
The Carbon Footprint of Major Travel Methods
-

 United States1 week ago
Visualizing the Most Common Pets in the U.S.
-

 Culture1 week ago
The World’s Top Media Franchises by All-Time Revenue
-

 voronoi1 week ago
Best Visualizations of April on the Voronoi App