Money
Ranked: Who Are the Richest People in Africa?
Ranked: Who Are the Richest People in Africa?
The African continent is home to 46 billionaires, the second-lowest total of any global region.
The number of wealthy individuals in Africa is growing, however. Total private wealth is expected to rise 30% over the next decade, led by growth in the billionaire and millionaire segments.
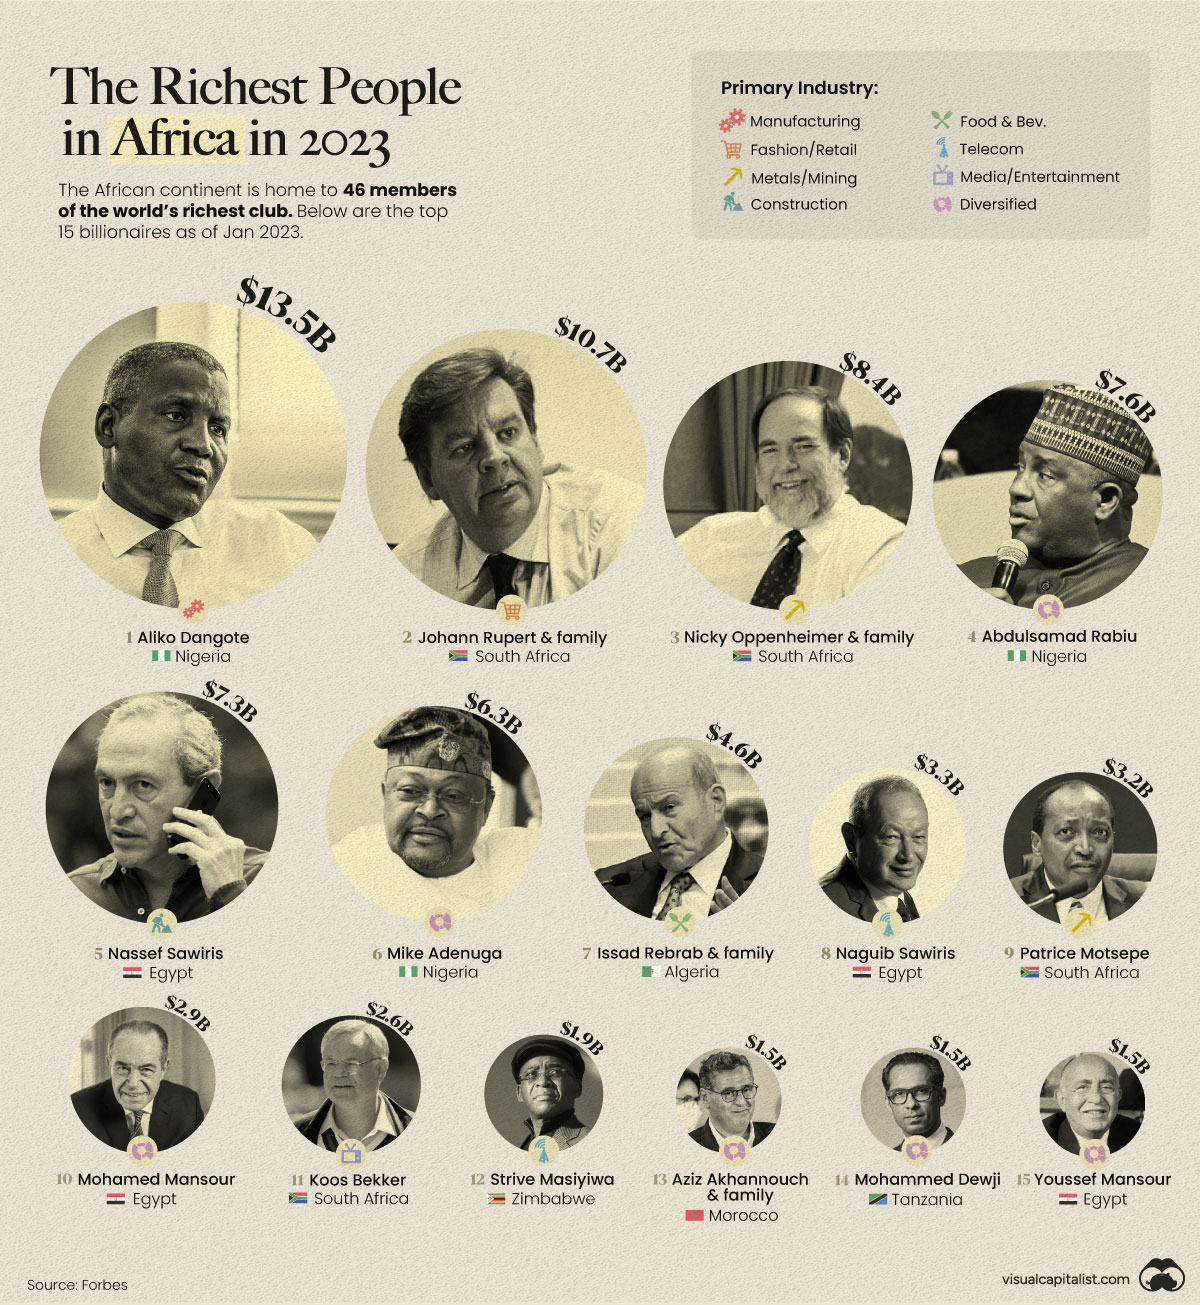
Visualized here are Africa’s richest, using data collected by Forbes, on billionaires who reside on the continent and have their primary business there.
Breaking Down Africa’s Billionaires
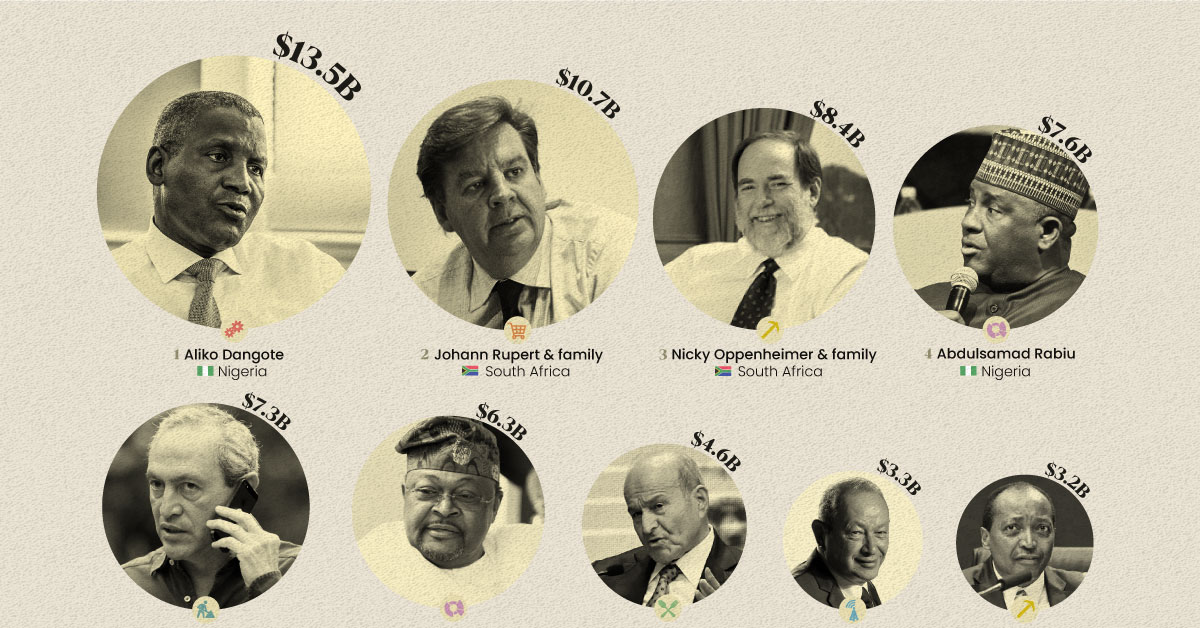
The richest man in Africa is also the richest Black man in the world. Once a small sugar trader, Aliko Dangote now has a net worth of $13.5 billion. He is the 86th richest person in the world, and single-handedly makes up 25% of the total wealth of African billionaires.
His company, the Dangote Group is now an African conglomerate with interests in a range of sectors, including sugar, cement, and real estate.
| Rank | Name | Net Worth (billions, USD) | Industry | Citizenship |
|---|---|---|---|---|
| 1 | Aliko Dangote | $13.5 | Manufacturing | 🇳🇬 Nigeria |
| 2 | Johann Rupert & family | $10.7 | Fashion & Retail | 🇿🇦 South Africa |
| 3 | Nicky Oppenheimer & family | $8.4 | Metals & mining | 🇿🇦 South Africa |
| 4 | Abdulsamad Rabiu | $7.6 | Diversified | 🇳🇬 Nigeria |
| 5 | Nassef Sawiris | $7.3 | Construction & Engineering | 🇪🇬 Egypt |
| 6 | Mike Adenuga | $6.3 | Diversified | 🇳🇬 Nigeria |
| 7 | Issad Rebrab & family | $4.6 | Food & Beverage | 🇩🇿 Algeria |
| 8 | Naguib Sawiris | $3.3 | Telecom | 🇪🇬 Egypt |
| 9 | Patrice Motsepe | $3.2 | Metals & mining | 🇿🇦 South Africa |
| 10 | Mohamed Mansour | $2.9 | Diversified | 🇪🇬 Egypt |
| 11 | Koos Bekker | $2.6 | Media & Entertainment | 🇿🇦 South Africa |
| 12 | Strive Masiyiwa | $1.9 | Telecom | 🇿🇼 Zimbabwe |
| 13 | Mohammed Dewji | $1.5 | Diversified | 🇹🇿 Tanzania |
| 13 | Aziz Akhannouch & family | $1.5 | Diversified | 🇲🇦 Morocco |
| 13 | Youssef Mansour | $1.5 | Diversified | 🇪🇬 Egypt |
The top three—Alike Dangote, Johann Rupert, and Nicky Oppenheimer—account for 40% of the total wealth of those ranked.
A Look Through the Rest of the Richest People in Africa
At number two on the list is Johann Rupert. The chairman of Swiss luxury goods company, Compagnie Financiere Richemont, started his career with a banking apprenticeship in New York, before returning to South Africa and eventually pivoting to retail.
Through the rest of those ranked, a range of diverse business activities have allowed these billionaires to garner their wealth.
Nicky Oppenheimer (3rd) and Patrice Motsepe (9th)—have made fortunes in the mining industry, a sector which contributes nearly 10% to sub-Saharan Africa’s GDP. Meanwhile, Naguib Sawiris (8th) and Strive Masiyiwa (12th) have built telecom empires.
Billionaire Wealth Mirrors Country Wealth
Only seven out of the 54 African countries are represented on Africa’s rich list, and even amongst them, three countries (Egypt, South Africa, and Nigeria) account for more than two-thirds of the top-ranked billionaires.
| Country | Rank in African Economy | Individuals on Top 15 Billionaire List |
|---|---|---|
| 🇳🇬 Nigeria | #1 | 3 |
| 🇿🇦 South Africa | #2 | 4 |
| 🇪🇬 Egypt | #3 | 4 |
The home countries for these billionaires reflects the nations’ contribution to the African economy as a whole. Nigeria, South Africa, and Egypt have the top three GDPs in Africa.
Algeria—where Issad Rebrab (7th) is from—is ranked fourth, and Morocco—where Aziz Akhannouch (13th) is based—is fifth.
What’s Next For Africa’s Richest?
Africa has routinely been touted to become a future economic powerhouse as its demographic dividend pays off in the next few decades. However, its biggest challenge will be developing its economic and social infrastructure to retain local talent to make their fortunes at home.
Where does this data come from?
Source: Forbes.
Data note: Forbes calculated net worths using stock prices and currency exchange rates from the close of business on Friday, January 13, 2023. For privately held businesses, they used estimates of revenues or profits and applied prevailing price-to-sale or price-to-earnings ratios for similar public companies. Some list members grew richer or poorer within weeks or days of their measurement date.


Money
Charted: Which City Has the Most Billionaires in 2024?
Just two countries account for half of the top 20 cities with the most billionaires. And the majority of the other half are found in Asia.


Charted: Which Country Has the Most Billionaires in 2024?
This was originally posted on our Voronoi app. Download the app for free on iOS or Android and discover incredible data-driven charts from a variety of trusted sources.
Some cities seem to attract the rich. Take New York City for example, which has 340,000 high-net-worth residents with investable assets of more than $1 million.
But there’s a vast difference between being a millionaire and a billionaire. So where do the richest of them all live?
Using data from the Hurun Global Rich List 2024, we rank the top 20 cities with the highest number of billionaires in 2024.
A caveat to these rich lists: sources often vary on figures and exact rankings. For example, in last year’s reports, Forbes had New York as the city with the most billionaires, while the Hurun Global Rich List placed Beijing at the top spot.
Ranked: Top 20 Cities with the Most Billionaires in 2024
The Chinese economy’s doldrums over the course of the past year have affected its ultra-wealthy residents in key cities.
Beijing, the city with the most billionaires in 2023, has not only ceded its spot to New York, but has dropped to #4, overtaken by London and Mumbai.
| Rank | City | Billionaires | Rank Change YoY |
|---|---|---|---|
| 1 | 🇺🇸 New York | 119 | +1 |
| 2 | 🇬🇧 London | 97 | +3 |
| 3 | 🇮🇳 Mumbai | 92 | +4 |
| 4 | 🇨🇳 Beijing | 91 | -3 |
| 5 | 🇨🇳 Shanghai | 87 | -2 |
| 6 | 🇨🇳 Shenzhen | 84 | -2 |
| 7 | 🇭🇰 Hong Kong | 65 | -1 |
| 8 | 🇷🇺 Moscow | 59 | No Change |
| 9 | 🇮🇳 New Delhi | 57 | +6 |
| 10 | 🇺🇸 San Francisco | 52 | No Change |
| 11 | 🇹🇭 Bangkok | 49 | +2 |
| 12 | 🇹🇼 Taipei | 45 | +2 |
| 13 | 🇫🇷 Paris | 44 | -2 |
| 14 | 🇨🇳 Hangzhou | 43 | -5 |
| 15 | 🇸🇬 Singapore | 42 | New to Top 20 |
| 16 | 🇨🇳 Guangzhou | 39 | -4 |
| 17T | 🇮🇩 Jakarta | 37 | +1 |
| 17T | 🇧🇷 Sao Paulo | 37 | No Change |
| 19T | 🇺🇸 Los Angeles | 31 | No Change |
| 19T | 🇰🇷 Seoul | 31 | -3 |
In fact all Chinese cities on the top 20 list have lost billionaires between 2023–24. Consequently, they’ve all lost ranking spots as well, with Hangzhou seeing the biggest slide (-5) in the top 20.
Where China lost, all other Asian cities—except Seoul—in the top 20 have gained ranks. Indian cities lead the way, with New Delhi (+6) and Mumbai (+3) having climbed the most.
At a country level, China and the U.S combine to make up half of the cities in the top 20. They are also home to about half of the world’s 3,200 billionaire population.
In other news of note: Hurun officially counts Taylor Swift as a billionaire, estimating her net worth at $1.2 billion.

-

 Culture1 week ago
The Highest Earning Athletes in Seven Professional Sports
-

 Demographics2 weeks ago
Population Projections: The World’s 6 Largest Countries in 2075
-

 Markets2 weeks ago
The Top 10 States by Real GDP Growth in 2023
-

 Demographics2 weeks ago
The Smallest Gender Wage Gaps in OECD Countries
-

 United States2 weeks ago
Where U.S. Inflation Hit the Hardest in March 2024
-

 Green2 weeks ago
Top Countries By Forest Growth Since 2001
-

 United States2 weeks ago
Ranked: The Largest U.S. Corporations by Number of Employees
-

 Maps2 weeks ago
The Largest Earthquakes in the New York Area (1970-2024)