Mining
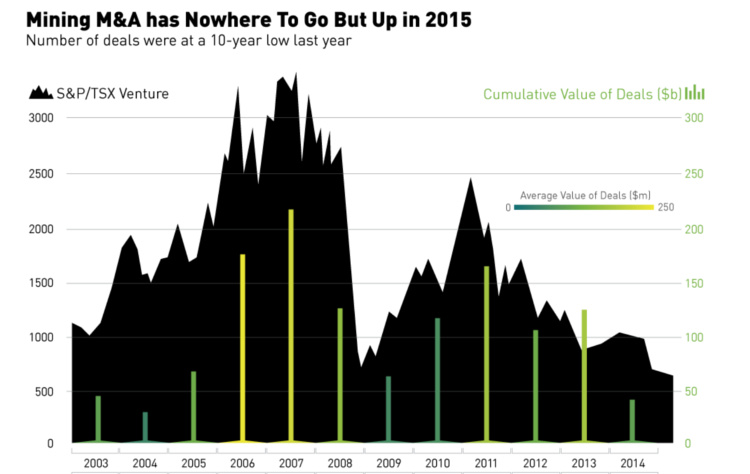
Mining M&A Has Nowhere To Go But Up In 2015 [Chart]
![Mining M&A Has Nowhere To Go But Up In 2015 [Chart]](https://www.visualcapitalist.com/wp-content/uploads/2015/04/mining-ma.png)
Mining M&A Has Nowhere To Go But Up In 2015 [Chart]
The Chart of the Week is a weekly Visual Capitalist feature on Fridays.
This week, Alamos Gold and AuRico announced a merger worth $1.5 billion. This is all while broad speculation continues that former Xstrata boss Mick Davis is looking to finally deploy his $5.6 billion war chest held by his company, X2 Resources.
Common wisdom is that the majority of mergers and acquisitions (M&A) such as these take place at both the peaks and the troughs of the market. In this week’s Chart of the Week, we wanted to take a look at the truth of this statement over the last dozen years.
The answer: the number of deals peaked in the aftermath of the Financial Crisis in 2009 and 2010. During this time, the overall market dropped off and subsequently recovered with the commodity supercycle still intact. The average value per deal was very low post-crisis, steadily increasing until 2011 when the junior market would reach its most recent heights.
During hot market years, M&A activity was frequent and significant. In years such as 2006, 2007, and 2011, both the cumulative value and the average value per deal were at their highest rates. In the down year of 2013 the data was also relatively positive, but it was also skewed by the $90 billion merger of Glencore and Xstrata. Not including this outlier, it would appear that the data point would be more inline with the trend.
Last year, there were 544 deals for the unimpressive total of $44.6 billion. The volume of deals and their cumulative value reached their lowest points since 2003 and 2004 respectively. Most deals in 2015 will follow suit from the previous year, serving defensive and conservative means such as the Alamos and AuRico merger.
However, if Mr. Davis or like-minded groups start dipping into their war chests, that will mark the beginning of something new: the tilting to the speculative side of M&A that traditionally is a prelude to market recovery.


Lithium
Ranked: The Top 10 EV Battery Manufacturers in 2023
Asia dominates this ranking of the world’s largest EV battery manufacturers in 2023.


The Top 10 EV Battery Manufacturers in 2023
This was originally posted on our Voronoi app. Download the app for free on iOS or Android and discover incredible data-driven charts from a variety of trusted sources.
Despite efforts from the U.S. and EU to secure local domestic supply, all major EV battery manufacturers remain based in Asia.
In this graphic we rank the top 10 EV battery manufacturers by total battery deployment (measured in megawatt-hours) in 2023. The data is from EV Volumes.
Chinese Dominance
Contemporary Amperex Technology Co. Limited (CATL) has swiftly risen in less than a decade to claim the title of the largest global battery group.
The Chinese company now has a 34% share of the market and supplies batteries to a range of made-in-China vehicles, including the Tesla Model Y, SAIC’s MG4/Mulan, and various Li Auto models.
| Company | Country | 2023 Production (megawatt-hour) | Share of Total Production |
|---|---|---|---|
| CATL | 🇨🇳 China | 242,700 | 34% |
| BYD | 🇨🇳 China | 115,917 | 16% |
| LG Energy Solution | 🇰🇷 Korea | 108,487 | 15% |
| Panasonic | 🇯🇵 Japan | 56,560 | 8% |
| SK On | 🇰🇷 Korea | 40,711 | 6% |
| Samsung SDI | 🇰🇷 Korea | 35,703 | 5% |
| CALB | 🇨🇳 China | 23,493 | 3% |
| Farasis Energy | 🇨🇳 China | 16,527 | 2% |
| Envision AESC | 🇨🇳 China | 8,342 | 1% |
| Sunwoda | 🇨🇳 China | 6,979 | 1% |
| Other | - | 56,040 | 8% |
In 2023, BYD surpassed LG Energy Solution to claim second place. This was driven by demand from its own models and growth in third-party deals, including providing batteries for the made-in-Germany Tesla Model Y, Toyota bZ3, Changan UNI-V, Venucia V-Online, as well as several Haval and FAW models.
The top three battery makers (CATL, BYD, LG) collectively account for two-thirds (66%) of total battery deployment.
Once a leader in the EV battery business, Panasonic now holds the fourth position with an 8% market share, down from 9% last year. With its main client, Tesla, now sourcing batteries from multiple suppliers, the Japanese battery maker seems to be losing its competitive edge in the industry.
Overall, the global EV battery market size is projected to grow from $49 billion in 2022 to $98 billion by 2029, according to Fortune Business Insights.

-

 Brands6 days ago
How Tech Logos Have Evolved Over Time
-

 Demographics2 weeks ago
The Smallest Gender Wage Gaps in OECD Countries
-

 Economy2 weeks ago
Where U.S. Inflation Hit the Hardest in March 2024
-

 Green2 weeks ago
Top Countries By Forest Growth Since 2001
-

 United States2 weeks ago
Ranked: The Largest U.S. Corporations by Number of Employees
-

 Maps2 weeks ago
The Largest Earthquakes in the New York Area (1970-2024)
-

 Green2 weeks ago
Ranked: The Countries With the Most Air Pollution in 2023
-

 Green2 weeks ago
Ranking the Top 15 Countries by Carbon Tax Revenue