Misc
Mapping the World’s Busiest Air Routes
Mapping the World’s Busiest Air Routes
Modern air travel gives us almost unlimited possibilities for getting around.
Whether you are acting on your wanderlust to explore new and exotic destinations, hopping to a familiar island for a well-deserved vacation, or jetsetting to London in the comfort of business class, the modern airline industry can get you almost anywhere you need to go.
But while flying allows us to have unique experiences, it’s often the case that we are all coming and going from many of the same popular destinations. As a result, the world’s busiest air routes have hundreds of flights per day connecting important city pairs together.
Ranking City Pairs
Today’s chart pulls data from OAG, which has compiled a detailed report ranking the busiest domestic and international air routes from around the globe.
It’s worth noting that the data is over the period of March 2018 to February 2019, and it excludes carriers that operate fewer than 500 routes per year.
Let’s dive in to see which city pairs have the most air travel between them.
Domestic Routes
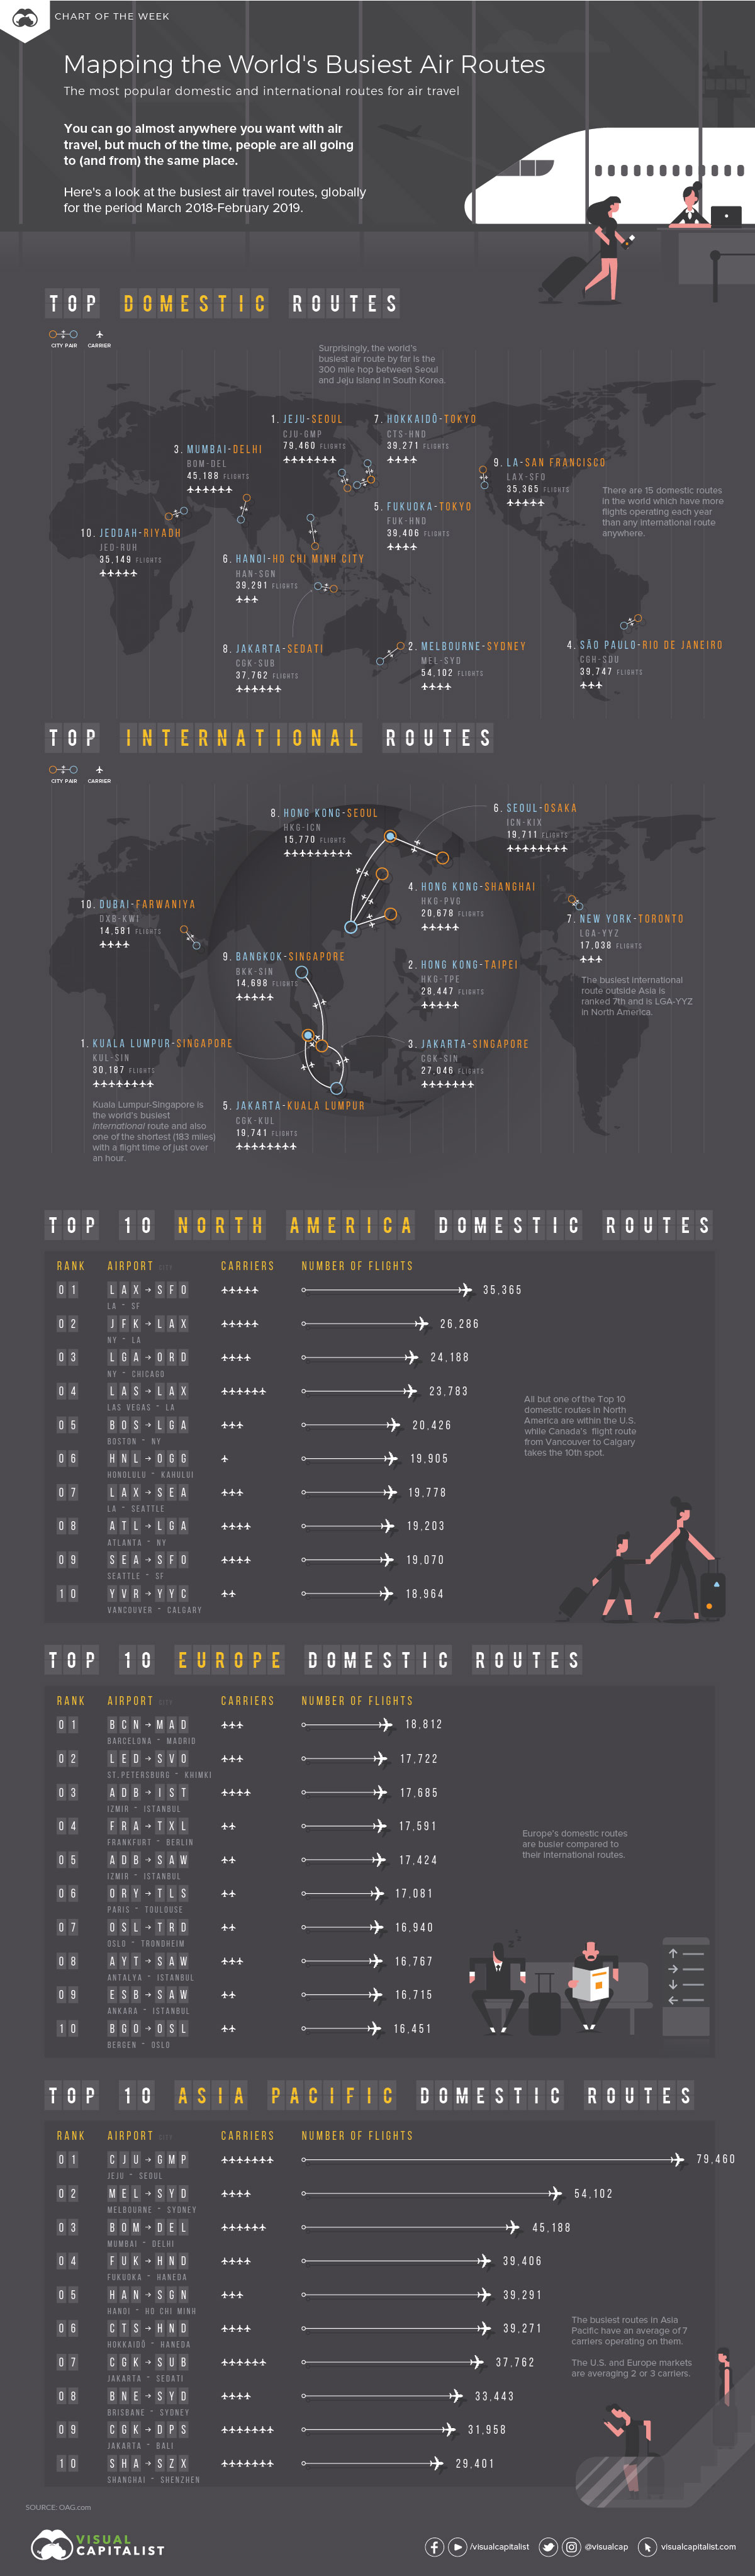
Domestic routes are far more popular than international routes globally. According to the report, there are 15 domestic routes that have more operating flights per year than any international route anywhere.
Here’s a look at the top 10 domestic routes:
| Rank | Country | City Pair | Flights (Annually) | Carriers |
|---|---|---|---|---|
| #1 | 🇰🇷 | Jeju ↔️ Seoul | 79,460 | 7 |
| #2 | 🇦🇺 | Melbourne ↔️ Sydney | 54,102 | 4 |
| #3 | 🇮🇳 | Mumbai ↔️ Delhi | 45,188 | 6 |
| #4 | 🇧🇷 | São Paulo ↔️ Rio de Janeiro | 39,747 | 3 |
| #5 | 🇯🇵 | Fukuoka ↔️ Toyko | 39,406 | 4 |
| #6 | 🇻🇳 | Hanoi ↔️ Ho Chi Minh City | 39,291 | 3 |
| #7 | 🇯🇵 | Hokkaido ↔️ Tokyo | 39,271 | 4 |
| #8 | 🇮🇩 | Jakarta ↔️ Surabaya City | 37,762 | 6 |
| #9 | 🇺🇸 | Los Angeles ↔️ San Francisco | 35,365 | 5 |
| #10 | 🇸🇦 | Jeddah ↔️ Riyadh | 35,149 | 5 |
The busiest domestic route might be a surprise, unless you are familiar with Asian geography.
With almost 80,000 annual flights, the 300-mile hop between Seoul and Jeju Island in South Korea is the busiest air route in the world by a large margin. Overall, there are seven carriers competing on it each day, with over 200 daily flights available between them.
What makes Jeju so popular?
Known as the “Hawaii of South Korea”, this volcanic island is an extremely popular vacation destination within the country, and it hosts roughly 15 million guests per year.
International Routes
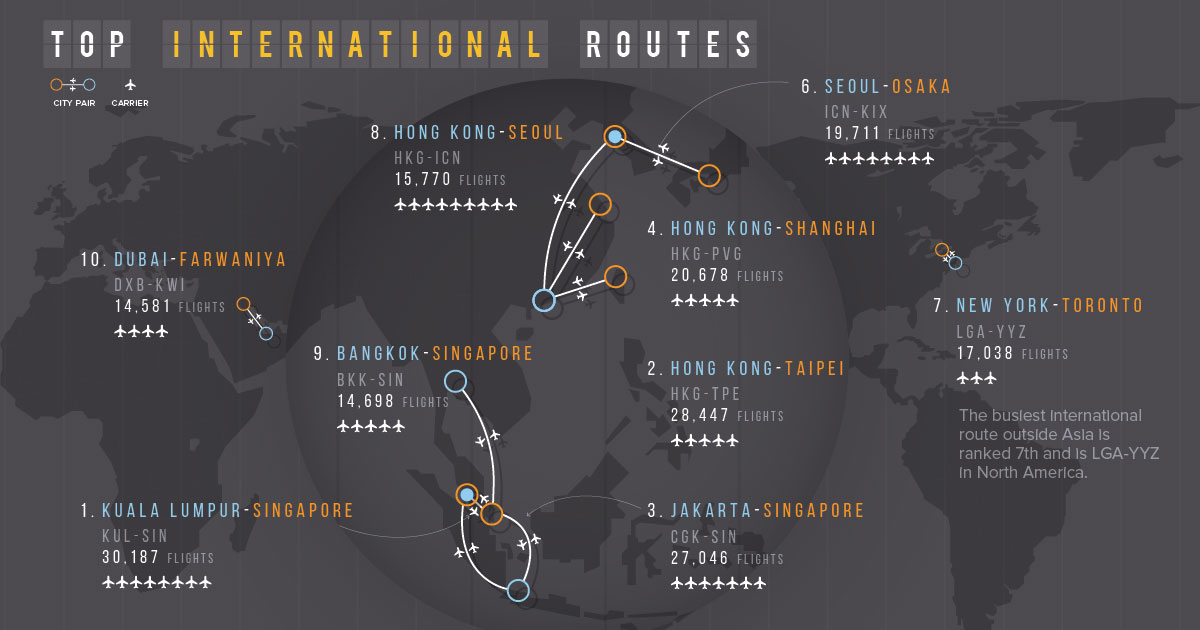
On an international basis, the busiest route has almost 50,000 fewer flights per year than the Jeju-Seoul city pair listed above. Not surprisingly, this route – and many other top international routes – are also located in the Asia Pacific region.
| Rank | Countries | City Pair | Flights (Annually) | Carriers |
|---|---|---|---|---|
| #1 | 🇲🇾🇸🇬 | Kuala Lumpur ↔️ Singapore | 30,187 | 8 |
| #2 | 🇭🇰🇹🇼 | Hong Kong ↔️ Taipei | 28,447 | 5 |
| #3 | 🇮🇩🇸🇬 | Jakarta ↔️ Singapore | 27,046 | 7 |
| #4 | 🇭🇰🇨🇳 | Hong Kong ↔️ Shanghai | 20,678 | 5 |
| #5 | 🇮🇩🇲🇾 | Jakarta ↔️ Kuala Lumpur | 19,741 | 8 |
| #6 | 🇰🇷🇯🇵 | Seoul ↔️ Osaka | 19,711 | 8 |
| #7 | 🇺🇸🇨🇦 | New York (LGA) ↔️ Toronto | 17,038 | 3 |
| #8 | 🇭🇰🇰🇷 | Hong Kong ↔️ Seoul | 15,770 | 9 |
| #9 | 🇹🇭🇸🇬 | Bangkok ↔️ Singapore | 14,698 | 5 |
| #10 | 🇦🇪🇰🇼 | Dubai ↔️ Kuwait | 14,581 | 4 |
The short hop between Singapore and Kuala Lumpur takes only one hour, and it connects two major Southeast Asian commercial hubs. The route has 41 flights per day between eight airlines, making it one of the most competitive routes globally.
The busiest international route outside of the Asia Pacific is between Toronto and New York (LaGuardia) with 17,038 annual flights. Interestingly, it only has three competing carriers – the lowest of any of the top 10 routes.


VC+
VC+: Get Our Key Takeaways From the IMF’s World Economic Outlook
A sneak preview of the exclusive VC+ Special Dispatch—your shortcut to understanding IMF’s World Economic Outlook report.

Have you read IMF’s latest World Economic Outlook yet? At a daunting 202 pages, we don’t blame you if it’s still on your to-do list.
But don’t worry, you don’t need to read the whole April release, because we’ve already done the hard work for you.
To save you time and effort, the Visual Capitalist team has compiled a visual analysis of everything you need to know from the report—and our VC+ Special Dispatch is available exclusively to VC+ members. All you need to do is log into the VC+ Archive.
If you’re not already subscribed to VC+, make sure you sign up now to access the full analysis of the IMF report, and more (we release similar deep dives every week).
For now, here’s what VC+ members get to see.
Your Shortcut to Understanding IMF’s World Economic Outlook
With long and short-term growth prospects declining for many countries around the world, this Special Dispatch offers a visual analysis of the key figures and takeaways from the IMF’s report including:
- The global decline in economic growth forecasts
- Real GDP growth and inflation forecasts for major nations in 2024
- When interest rate cuts will happen and interest rate forecasts
- How debt-to-GDP ratios have changed since 2000
- And much more!

Get the Full Breakdown in the Next VC+ Special Dispatch
VC+ members can access the full Special Dispatch by logging into the VC+ Archive, where you can also check out previous releases.
Make sure you join VC+ now to see exclusive charts and the full analysis of key takeaways from IMF’s World Economic Outlook.
Don’t miss out. Become a VC+ member today.
What You Get When You Become a VC+ Member
VC+ is Visual Capitalist’s premium subscription. As a member, you’ll get the following:
- Special Dispatches: Deep dive visual briefings on crucial reports and global trends
- Markets This Month: A snappy summary of the state of the markets and what to look out for
- The Trendline: Weekly curation of the best visualizations from across the globe
- Global Forecast Series: Our flagship annual report that covers everything you need to know related to the economy, markets, geopolitics, and the latest tech trends
- VC+ Archive: Hundreds of previously released VC+ briefings and reports that you’ve been missing out on, all in one dedicated hub
You can get all of the above, and more, by joining VC+ today.

-

 Debt1 week ago
How Debt-to-GDP Ratios Have Changed Since 2000
-

 Markets2 weeks ago
Ranked: The World’s Top Flight Routes, by Revenue
-

 Countries2 weeks ago
Population Projections: The World’s 6 Largest Countries in 2075
-

 Markets2 weeks ago
The Top 10 States by Real GDP Growth in 2023
-

 Demographics2 weeks ago
The Smallest Gender Wage Gaps in OECD Countries
-

 United States2 weeks ago
Where U.S. Inflation Hit the Hardest in March 2024
-

 Green2 weeks ago
Top Countries By Forest Growth Since 2001
-

 United States2 weeks ago
Ranked: The Largest U.S. Corporations by Number of Employees