Money
Mapped: Which Countries Have the Highest Inflation?
![]() Subscribe to the Elements free mailing list for more like this
Subscribe to the Elements free mailing list for more like this
Mapped: Which Countries Have the Highest Inflation Rate?
This was originally posted on Elements. Sign up to the free mailing list to get beautiful visualizations on natural resource megatrends in your email every week.
Inflation is surging nearly everywhere in 2022.
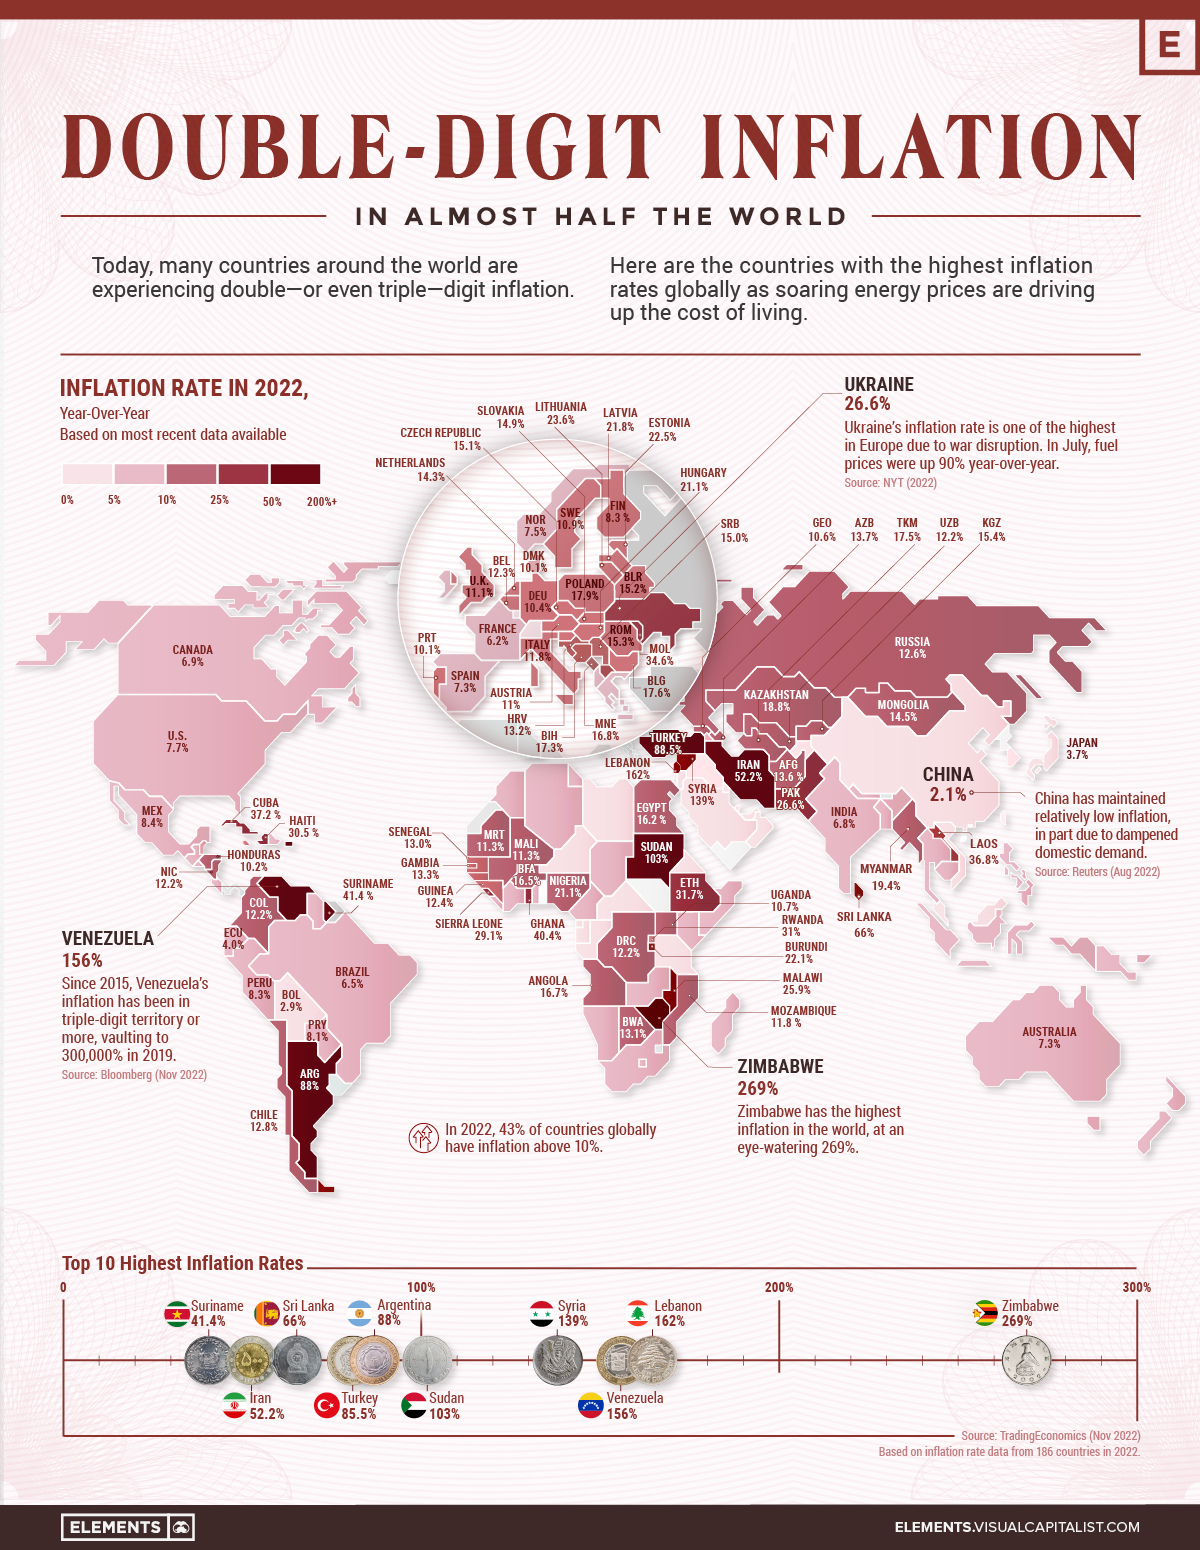
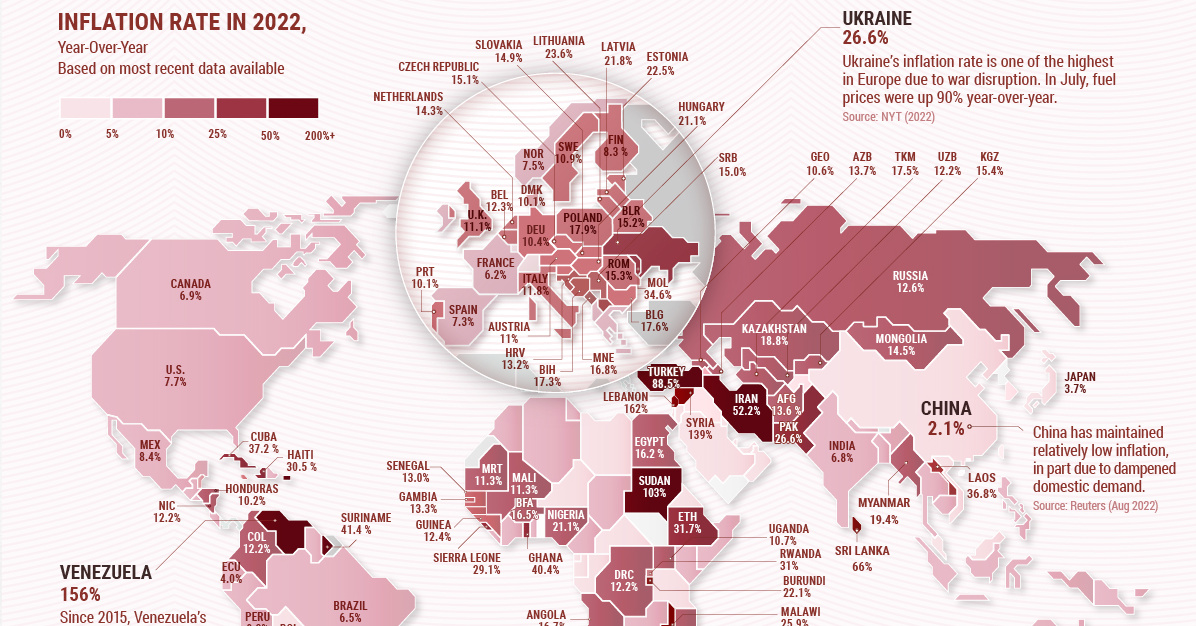
Geopolitical tensions are triggering high energy costs, while supply-side disruptions are also distorting consumer prices. The end result is that almost half of countries worldwide are seeing double-digit inflation rates or higher.
With new macroeconomic forces shaping the global economy, the above infographic shows countries with the highest inflation rates, using data from Trading Economics.
Double-Digit Inflation in 2022
As the table below shows, countless countries are navigating record-high levels of inflation. Some are even facing triple-digit inflation rates. Globally, Zimbabwe, Lebanon, and Venezuela have the highest rates in the world.
| Country | Inflation Rate, Year-Over-Year | Date |
|---|---|---|
| 🇿🇼 Zimbabwe | 269.0% | Oct 2022 |
| 🇱🇧 Lebanon | 162.0% | Sep 2022 |
| 🇻🇪 Venezuela | 156.0% | Oct 2022 |
| 🇸🇾 Syria | 139.0% | Aug 2022 |
| 🇸🇩 Sudan | 103.0% | Oct 2022 |
| 🇦🇷 Argentina | 88.0% | Oct 2022 |
| 🇹🇷 Turkey | 85.5% | Oct 2022 |
| 🇱🇰 Sri Lanka | 66.0% | Oct 2022 |
| 🇮🇷 Iran | 52.2% | Aug 2022 |
| 🇸🇷 Suriname | 41.4% | Sep 2022 |
| 🇬🇭 Ghana | 40.4% | Oct 2022 |
| 🇨🇺 Cuba | 37.2% | Sep 2022 |
| 🇱🇦 Laos | 36.8% | Oct 2022 |
| 🇲🇩 Moldova | 34.6% | Oct 2022 |
| 🇪🇹 Ethiopia | 31.7% | Oct 2022 |
| 🇷🇼 Rwanda | 31.0% | Oct 2022 |
| 🇭🇹 Haiti | 30.5% | Jul 2022 |
| 🇸🇱 Sierra Leone | 29.1% | Sep 2022 |
| 🇵🇰 Pakistan | 26.6% | Oct 2022 |
| 🇺🇦 Ukraine | 26.6% | Oct 2022 |
| 🇲🇼 Malawi | 25.9% | Sep 2022 |
| 🇱🇹 Lithuania | 23.6% | Oct 2022 |
| 🇪🇪 Estonia | 22.5% | Oct 2022 |
| 🇧🇮 Burundi | 22.1% | Oct 2022 |
| 🇸🇹 Sao Tome and Principe | 21.9% | Sep 2022 |
| 🇱🇻 Latvia | 21.8% | Oct 2022 |
| 🇭🇺 Hungary | 21.1% | Oct 2022 |
| 🇳🇬 Nigeria | 21.1% | Oct 2022 |
| 🇲🇰 Macedonia | 19.8% | Oct 2022 |
| 🇲🇲 Myanmar | 19.4% | Jun 2022 |
| 🇰🇿 Kazakhstan | 18.8% | Oct 2022 |
| 🇵🇱 Poland | 17.9% | Oct 2022 |
| 🇧🇬 Bulgaria | 17.6% | Oct 2022 |
| 🇹🇲 Turkmenistan | 17.5% | Dec 2021 |
| 🇧🇦 Bosnia and Herzegovina | 17.3% | Sep 2022 |
| 🇲🇪 Montenegro | 16.8% | Oct 2022 |
| 🇦🇴 Angola | 16.7% | Oct 2022 |
| 🇧🇫 Burkina Faso | 16.5% | Sep 2022 |
| 🇪🇬 Egypt | 16.2% | Oct 2022 |
| 🇰🇲 Comoros | 15.9% | Sep 2022 |
| 🇰🇬 Kyrgyzstan | 15.4% | Oct 2022 |
| 🇷🇴 Romania | 15.3% | Oct 2022 |
| 🇧🇾 Belarus | 15.2% | Oct 2022 |
| 🇨🇿 Czech Republic | 15.1% | Oct 2022 |
| 🇷🇸 Serbia | 15.0% | Oct 2022 |
| 🇸🇰 Slovakia | 14.9% | Oct 2022 |
| 🇲🇳 Mongolia | 14.5% | Oct 2022 |
| 🇳🇱 Netherlands | 14.3% | Oct 2022 |
| 🇦🇿 Azerbaijan | 13.7% | Oct 2022 |
| 🇦🇫 Afghanistan | 13.6% | Sep 2022 |
| 🇬🇲 Gambia | 13.3% | Sep 2022 |
| 🇭🇷 Croatia | 13.2% | Oct 2022 |
| 🇧🇼 Botswana | 13.1% | Oct 2022 |
| 🇸🇳 Senegal | 13.0% | Oct 2022 |
| 🇨🇱 Chile | 12.8% | Oct 2022 |
| 🇽🇰 Kosovo | 12.7% | Oct 2022 |
| 🇷🇺 Russia | 12.6% | Oct 2022 |
| 🇬🇳 Guinea | 12.4% | Jul 2022 |
| 🇧🇪 Belgium | 12.3% | Oct 2022 |
| 🇨🇴 Colombia | 12.2% | Oct 2022 |
| 🇺🇿 Uzbekistan | 12.2% | Oct 2022 |
| 🇨🇬 Congo | 12.2% | Oct 2022 |
| 🇳🇮 Nicaragua | 12.2% | Oct 2022 |
| 🇰🇾 Cayman Islands | 12.1% | Jun 2022 |
| 🇲🇺 Mauritius | 11.9% | Oct 2022 |
| 🇲🇿 Mozambique | 11.8% | Oct 2022 |
| 🇮🇹 Italy | 11.8% | Oct 2022 |
| 🇲🇱 Mali | 11.3% | Sep 2022 |
| 🇲🇷 Mauritania | 11.3% | Sep 2022 |
| 🇬🇧 United Kingdom | 11.1% | Oct 2022 |
| 🇦🇹 Austria | 11.0% | Oct 2022 |
| 🇸🇪 Sweden | 10.9% | Oct 2022 |
| 🇺🇬 Uganda | 10.7% | Oct 2022 |
| 🇬🇪 Georgia | 10.6% | Oct 2022 |
| 🇩🇪 Germany | 10.4% | Oct 2022 |
| 🇭🇳 Honduras | 10.2% | Oct 2022 |
| 🇩🇰 Denmark | 10.1% | Oct 2022 |
| 🇵🇹 Portugal | 10.1% | Oct 2022 |
| 🇯🇲 Jamaica | 9.9% | Oct 2022 |
| 🇸🇮 Slovenia | 9.9% | Oct 2022 |
| 🇬🇹 Guatemala | 9.7% | Oct 2022 |
| 🇿🇲 Zambia | 9.7% | Oct 2022 |
| 🇰🇪 Kenya | 9.6% | Oct 2022 |
| 🇦🇲 Armenia | 9.5% | Oct 2022 |
| 🇮🇸 Iceland | 9.4% | Oct 2022 |
| 🇲🇬 Madagascar | 9.3% | Aug 2022 |
| 🇮🇪 Ireland | 9.2% | Oct 2022 |
| 🇱🇸 Lesotho | 9.2% | Sep 2022 |
| 🇹🇳 Tunisia | 9.2% | Oct 2022 |
| 🇬🇷 Greece | 9.1% | Oct 2022 |
| 🇺🇾 Uruguay | 9.1% | Oct 2022 |
| 🇨🇷 Costa Rica | 9.0% | Oct 2022 |
| 🇧🇩 Bangladesh | 8.9% | Oct 2022 |
| 🇨🇾 Cyprus | 8.8% | Oct 2022 |
| 🇫🇴 Faroe Islands | 8.8% | Sep 2022 |
| 🇩🇿 Algeria | 8.7% | Sep 2022 |
| 🇳🇵 Nepal | 8.6% | Sep 2022 |
| 🇸🇧 Solomon Islands | 8.5% | Aug 2022 |
| 🇲🇽 Mexico | 8.4% | Oct 2022 |
| 🇬🇼 Guinea Bissau | 8.4% | Sep 2022 |
| 🇦🇱 Albania | 8.3% | Oct 2022 |
| 🇧🇧 Barbados | 8.3% | Aug 2022 |
| 🇫🇮 Finland | 8.3% | Oct 2022 |
| 🇲🇦 Morocco | 8.3% | Sep 2022 |
| 🇵🇪 Peru | 8.3% | Oct 2022 |
| 🇩🇴 Dominican Republic | 8.2% | Oct 2022 |
| 🇨🇻 Cape Verde | 8.2% | Oct 2022 |
| 🇵🇾 Paraguay | 8.1% | Oct 2022 |
| 🇹🇱 East Timor | 7.9% | Sep 2022 |
| 🇹🇬 Togo | 7.9% | Sep 2022 |
| 🇵🇭 Philippines | 7.7% | Oct 2022 |
| 🇺🇸 U.S. | 7.7% | Oct 2022 |
| 🇨🇲 Cameroon | 7.6% | Sep 2022 |
| 🇳🇴 Norway | 7.5% | Oct 2022 |
| 🇸🇬 Singapore | 7.5% | Sep 2022 |
| 🇿🇦 South Africa | 7.5% | Sep 2022 |
| 🇸🇻 El Salvador | 7.5% | Oct 2022 |
| 🇲🇹 Malta | 7.4% | Oct 2022 |
| 🇦🇺 Australia | 7.3% | Sep 2022 |
| 🇪🇸 Spain | 7.3% | Oct 2022 |
| 🇹🇩 Chad | 7.2% | Sep 2022 |
| 🇳🇿 New Zealand | 7.2% | Sep 2022 |
| 🇧🇿 Belize | 7.1% | Sep 2022 |
| 🇳🇦 Namibia | 7.1% | Oct 2022 |
| 🇦🇼 Aruba | 7.0% | Sep 2022 |
| 🇨🇦 Canada | 6.9% | Oct 2022 |
| 🇱🇺 Luxembourg | 6.9% | Oct 2022 |
| 🇸🇴 Somalia | 6.9% | Oct 2022 |
| 🇮🇳 India | 6.8% | Oct 2022 |
| 🇦🇪 United Arab Emirates | 6.8% | Jun 2022 |
| 🇬🇾 Guyana | 6.5% | Sep 2022 |
| 🇱🇷 Liberia | 6.5% | Jul 2022 |
| 🇧🇷 Brazil | 6.5% | Oct 2022 |
| 🇧🇸 Bahamas | 6.3% | Aug 2022 |
| 🇨🇮 Ivory Coast | 6.3% | Sep 2022 |
| 🇹🇹 Trinidad and Tobago | 6.3% | Aug 2022 |
| 🇫🇷 France | 6.2% | Oct 2022 |
| 🇩🇯 Djibouti | 6.1% | Sep 2022 |
| 🇵🇷 Puerto Rico | 6.1% | Sep 2022 |
| 🇧🇹 Bhutan | 6.1% | Sep 2022 |
| 🇧🇹 Qatar | 6.0% | Sep 2022 |
| 🇹🇭 Thailand | 6.0% | Oct 2022 |
| 🇸🇿 Swaziland | 5.8% | Aug 2022 |
| 🇮🇩 Indonesia | 5.7% | Oct 2022 |
| 🇰🇷 South Korea | 5.7% | Oct 2022 |
| 🇹🇯 Tajikistan | 5.7% | Sep 2022 |
| 🇵🇬 Papua New Guinea | 5.5% | Jun 2022 |
| 🇰🇭 Cambodia | 5.4% | Jul 2022 |
| 🇮🇶 Iraq | 5.3% | Sep 2022 |
| 🇯🇴 Jordan | 5.2% | Oct 2022 |
| 🇫🇯 Fiji | 5.1% | Sep 2022 |
| 🇮🇱 Israel | 5.1% | Oct 2022 |
| 🇳🇨 New Caledonia | 5.0% | Sep 2022 |
| 🇹🇿 Tanzania | 4.9% | Oct 2022 |
| 🇧🇲 Bermuda | 4.5% | Jul 2022 |
| 🇪🇷 Eritrea | 4.5% | Dec 2021 |
| 🇲🇾 Malaysia | 4.5% | Sep 2022 |
| 🇭🇰 Hong Kong | 4.4% | Sep 2022 |
| 🇵🇸 Palestine | 4.4% | Oct 2022 |
| 🇧🇳 Brunei | 4.3% | Sep 2022 |
| 🇱🇾 Libya | 4.3% | Sep 2022 |
| 🇻🇳 Vietnam | 4.3% | Oct 2022 |
| 🇪🇨 Ecuador | 4.0% | Oct 2022 |
| 🇧🇭 Bahrain | 4.0% | Sep 2022 |
| 🇯🇵 Japan | 3.7% | Oct 2022 |
| 🇰🇼 Kuwait | 3.2% | Sep 2022 |
| 🇳🇪 Niger | 3.2% | Sep 2022 |
| 🇲🇻 Maldives | 3.1% | Sep 2022 |
| 🇬🇦 Gabon | 3.0% | Jul 2022 |
| 🇱🇮 Liechtenstein | 3.0% | Oct 2022 |
| 🇸🇦 Saudi Arabia | 3.0% | Oct 2022 |
| 🇨🇭 Switzerland | 3.0% | Oct 2022 |
| 🇸🇨 Seychelles | 2.9% | Oct 2022 |
| 🇬🇶 Equatorial Guinea | 2.9% | Dec 2021 |
| 🇧🇴 Bolivia | 2.9% | Oct 2022 |
| 🇹🇼 Taiwan | 2.7% | Oct 2022 |
| 🇨🇫 Central African Republic | 2.7% | Dec 2021 |
| 🇻🇺 Vanuatu | 2.7% | Mar 2022 |
| 🇴🇲 Oman | 2.4% | Sep 2022 |
| 🇧🇯 Benin | 2.1% | Oct 2022 |
| 🇨🇳 China | 2.1% | Oct 2022 |
| 🇵🇦 Panama | 1.9% | Sep 2022 |
| 🇲🇴 Macau | 1.1% | Sep 2022 |
| 🇸🇸 South Sudan | -2.5% | Aug 2022 |
*Inflation rates based on the latest available data.
As price pressures mount, 33 central banks tracked by the Bank of International Settlements (out of a total of 38) have raised interest rates this year. These coordinated rate hikes are the largest in two decades, representing an end to an era of rock-bottom interest rates.
Going into 2023, central banks could continue this shift towards hawkish policies as inflation remains aggressively high.
The Role of Energy Prices
Driven by the war in Ukraine, energy inflation is pushing up the cost of living around the world.
Since October 2020, an index of global energy prices—made up of crude oil, natural gas, coal, and propane—has increased drastically.
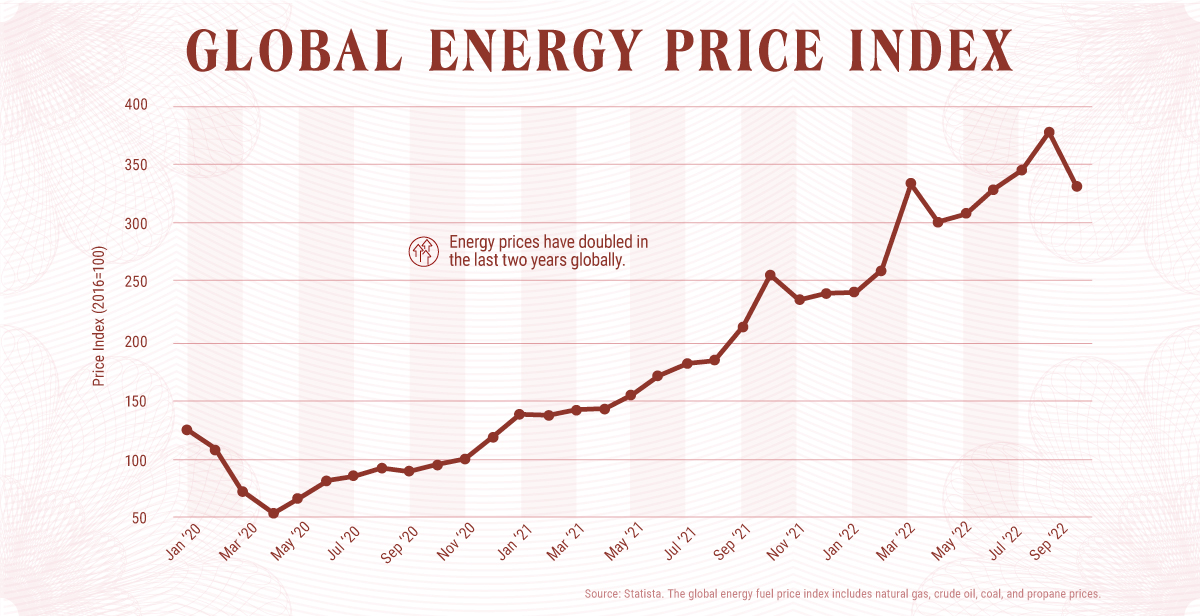
Compared to the 2021 average, natural gas prices in Europe are up sixfold. Real European household electricity prices are up 78% and gas prices have climbed even more, at 144% compared to 20-year averages.
Amid global competition for liquefied natural gas supplies, price pressures are likely to stay high, even though they have fallen recently. Other harmful consequences of the energy shock include price volatility, economic strain, and energy shortages.
“The world is in the midst of the first truly global energy crisis, with impacts that will be felt for years to come”.
-Fatih Birol, executive director of the IEA
Double-Digit Inflation: Will it Last?
If history is an example, taming rising prices could take at least a few years yet.
Take the sky-high inflation of the 1980s. Italy, which managed to combat inflation faster than most countries, brought down inflation from 22% in 1980 to 4% in 1986.
If global inflation rates, which hover around 9.8% in 2022, were to follow this course, it would take at least until 2025 for levels to reach the 2% target.
It’s worth noting that inflation was also highly volatile over this decade. Consider how inflation fell across much of the rich world by 1981 but shot up again in 1987 amid higher energy prices. Federal Reserve chair Jerome Powell spoke to the volatility of inflation at their November meeting, indicating that high inflation has a chance of following a period of low inflation.
While the Federal Reserve projects U.S. inflation to fall closer to its 2% target by 2024, the road ahead could still get a lot bumpier between now and then.


Economy
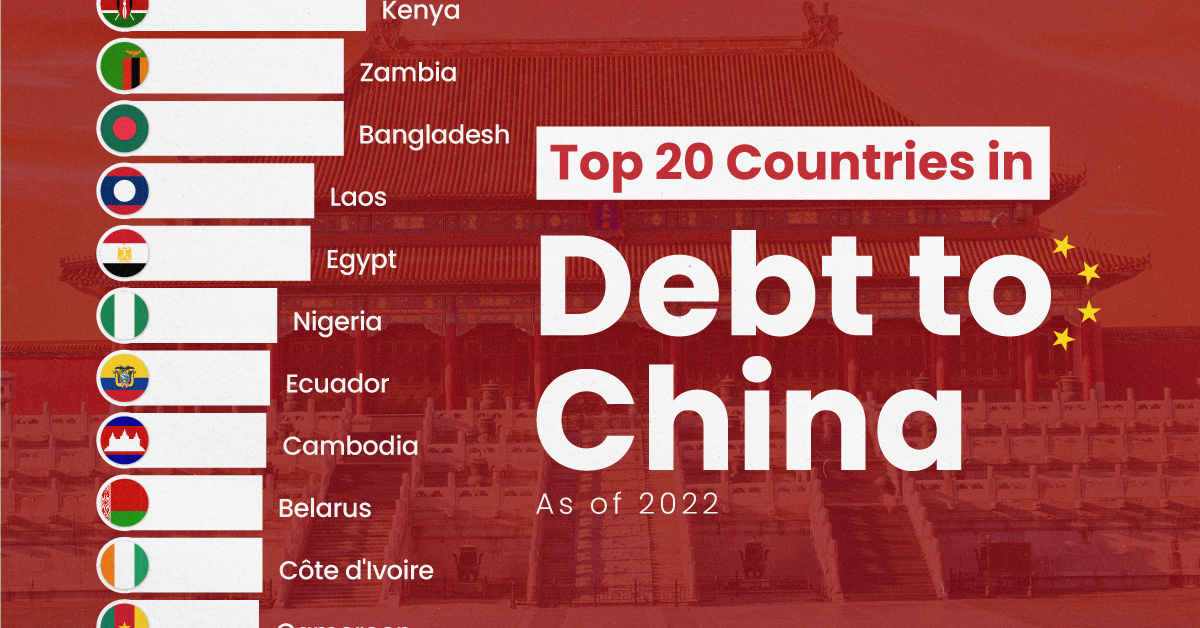
Ranked: The Top 20 Countries in Debt to China
The 20 nations featured in this graphic each owe billions in debt to China, posing concerns for their economic future.
Ranked: The Top 20 Countries in Debt to China
This was originally posted on our Voronoi app. Download the app for free on iOS or Android and discover incredible data-driven charts from a variety of trusted sources.
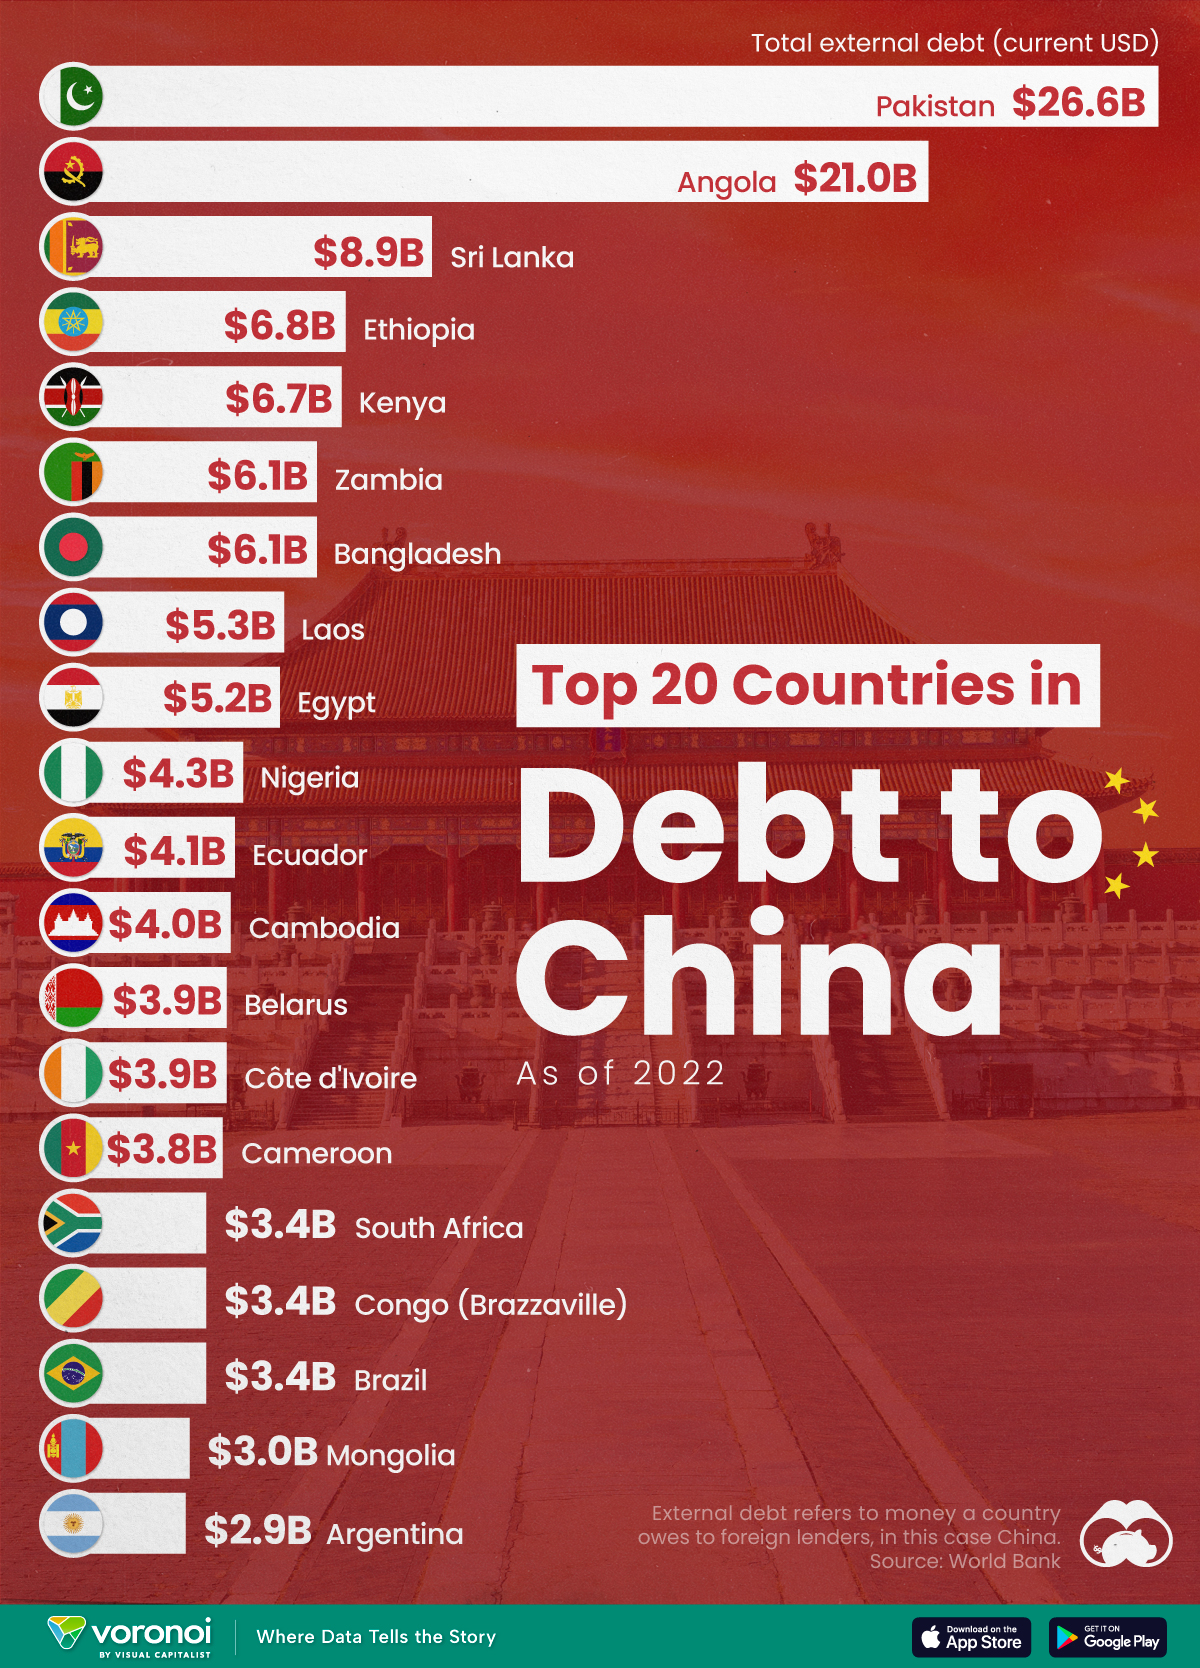
In this graphic, we ranked the top 20 countries by their amount of debt to China. These figures are as of 2022, and come from the World Bank (accessed via Yahoo Finance).
The data used to make this graphic can be found in the table below.
| Country | Total external debt to China ($B) |
|---|---|
| 🇵🇰 Pakistan | $26.6 |
| 🇦🇴 Angola | $21.0 |
| 🇱🇰 Sri Lanka | $8.9 |
| 🇪🇹 Ethiopia | $6.8 |
| 🇰🇪 Kenya | $6.7 |
| 🇧🇩 Bangladesh | $6.1 |
| 🇿🇲 Zambia | $6.1 |
| 🇱🇦 Laos | $5.3 |
| 🇪🇬 Egypt | $5.2 |
| 🇳🇬 Nigeria | $4.3 |
| 🇪🇨 Ecuador | $4.1 |
| 🇰🇭 Cambodia | $4.0 |
| 🇨🇮 Côte d'Ivoire | $3.9 |
| 🇧🇾 Belarus | $3.9 |
| 🇨🇲 Cameroon | $3.8 |
| 🇧🇷 Brazil | $3.4 |
| 🇨🇬 Republic of the Congo | $3.4 |
| 🇿🇦 South Africa | $3.4 |
| 🇲🇳 Mongolia | $3.0 |
| 🇦🇷 Argentina | $2.9 |
This dataset highlights Pakistan and Angola as having the largest debts to China by a wide margin. Both countries have taken billions in loans from China for various infrastructure and energy projects.
Critically, both countries have also struggled to manage their debt burdens. In February 2024, China extended the maturity of a $2 billion loan to Pakistan.
Soon after in March 2024, Angola negotiated a lower monthly debt payment with its biggest Chinese creditor, China Development Bank (CDB).
Could China be in Trouble?
China has provided developing countries with over $1 trillion in committed funding through its Belt and Road Initiative (BRI), a massive economic development project aimed at enhancing trade between China and countries across Asia, Africa, and Europe.
Many believe that this lending spree could be an issue in the near future.
According to a 2023 report by AidData, 80% of these loans involve countries in financial distress, raising concerns about whether participating nations will ever be able to repay their debts.
While China claims the BRI is a driver of global development, critics in the West have long warned that the BRI employs debt-trap diplomacy, a tactic where one country uses loans to gain influence over another.
Editor’s note: The debt shown in this visualization focuses only on direct external debt, and does not include publicly-traded, liquid, debt securities like bonds. Furthermore, it’s worth noting the World Bank data excludes some countries with data accuracy or reporting issues, such as Venezuela.
Learn More About Debt from Visual Capitalist
If you enjoyed this post, check out our breakdown of $97 trillion in global government debt.

-

 Technology6 days ago
All of the Grants Given by the U.S. CHIPS Act
-

 Uranium2 weeks ago
The World’s Biggest Nuclear Energy Producers
-

 Education2 weeks ago
How Hard Is It to Get Into an Ivy League School?
-

 Debt2 weeks ago
How Debt-to-GDP Ratios Have Changed Since 2000
-

 Sports2 weeks ago
The Highest Earning Athletes in Seven Professional Sports
-

 Science2 weeks ago
Visualizing the Average Lifespans of Mammals
-

 Brands1 week ago
How Tech Logos Have Evolved Over Time
-

 Energy1 week ago
Ranked: The Top 10 EV Battery Manufacturers in 2023