Markets
Mapped: GDP per Capita Worldwide
View the full-resolution version of this infographic


Mapped: Visualizing GDP per Capita Worldwide
View the high-resolution of the infographic by clicking here.
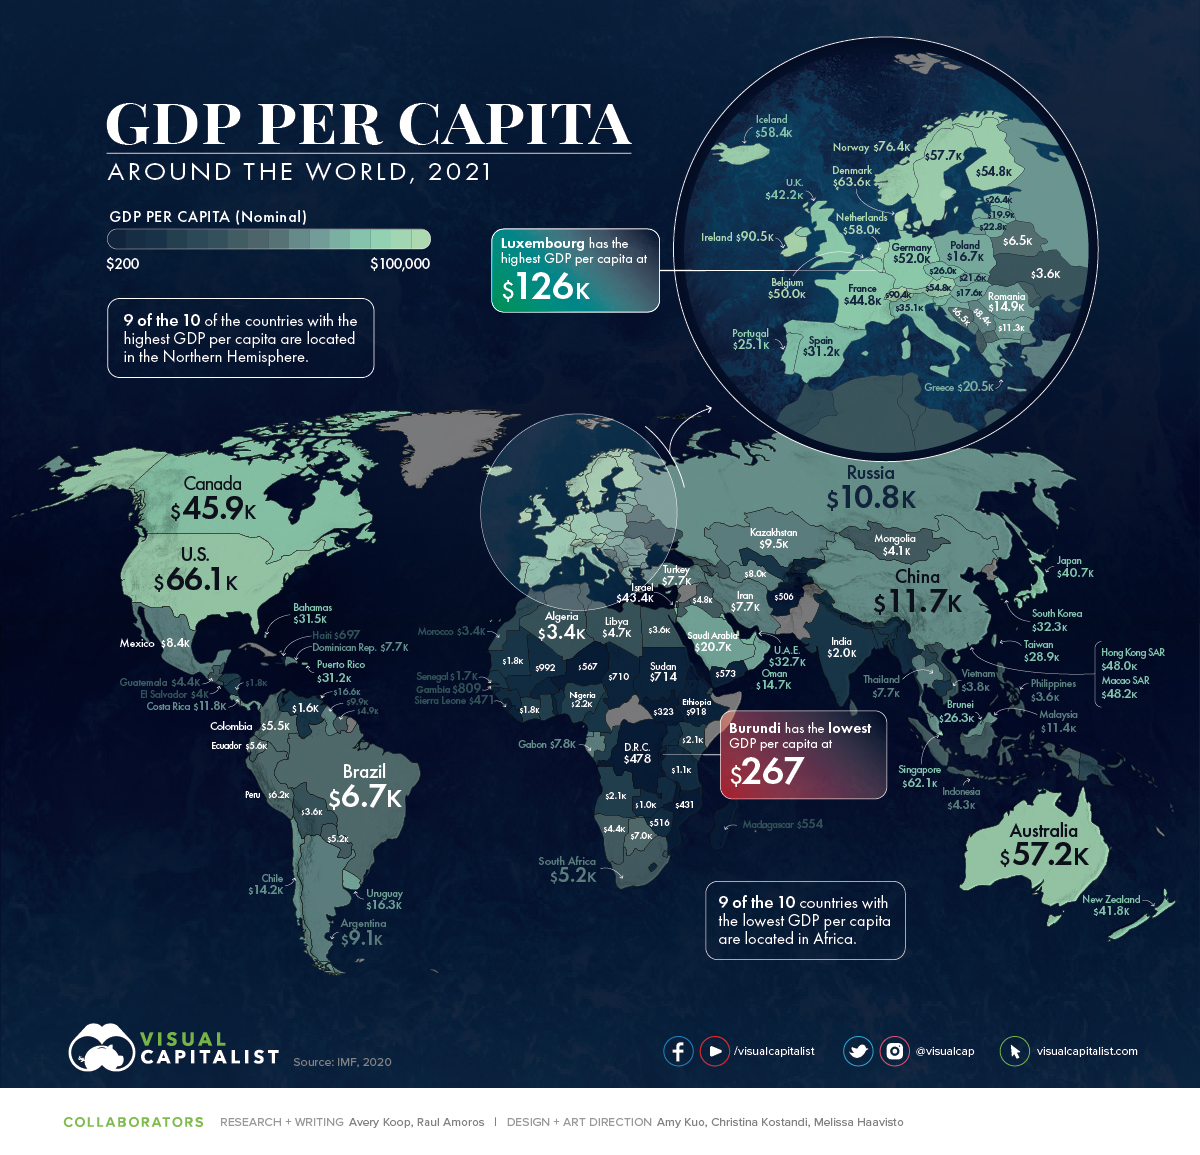
GDP per capita has steadily risen globally over time, and in tandem, the standard of living worldwide has increased immensely.
This map using data from the IMF shows the GDP per capita (nominal) of nearly every country and territory in the world.
GDP per capita is one of the best measures of a country’s wealth as it provides an understanding of how each country’s citizens live on average, showing a representation of the quantity of goods and services created per person.
The Standard of Living Over Time
Looking at history, our standard of living has increased drastically. According to Our World in Data, from 1820 to 2018, the average global GDP per capita increased by almost 15x.
Literacy rates, access to vaccines, and basic education have also improved our quality of life, while things like child mortality rates and poverty have all decreased.
For example, in 1990, 1.9 billion people lived in extreme poverty, which was 36% of the world’s population at the time. Over the last 30 years, the number has been steadily decreasing — by 2030, an estimated 479 million people will be living in extreme poverty, which according to UN population estimates, will represent only 6% of the population.
That said, economic inequality between different regions is still prevalent. In fact, the richest country today (in terms of nominal GDP per capita), Luxembourg, is over 471x more wealthy than the poorest, Burundi.
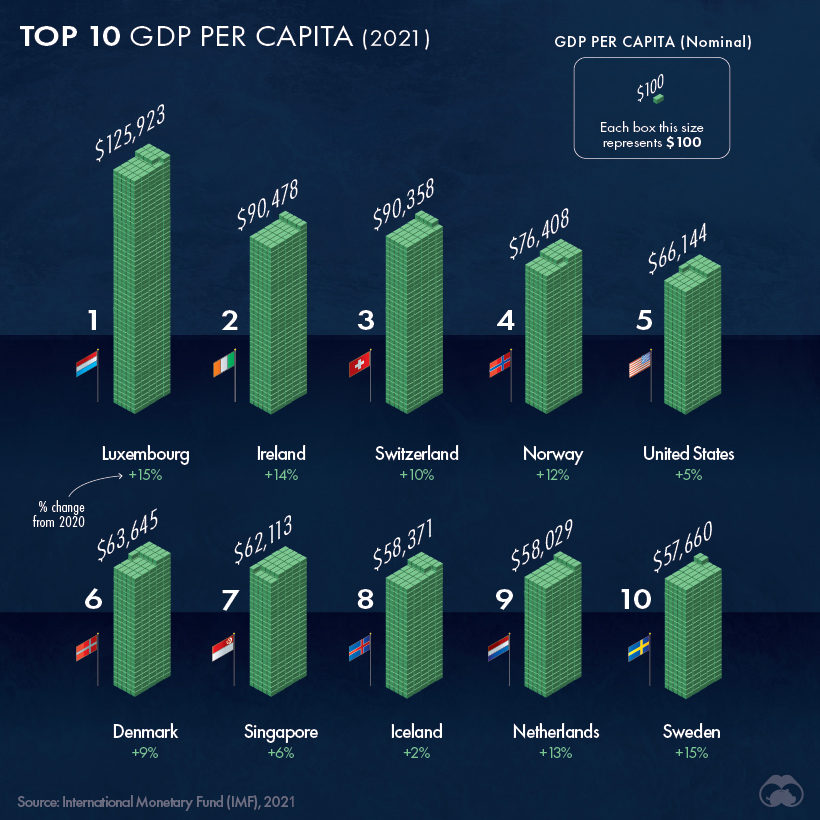
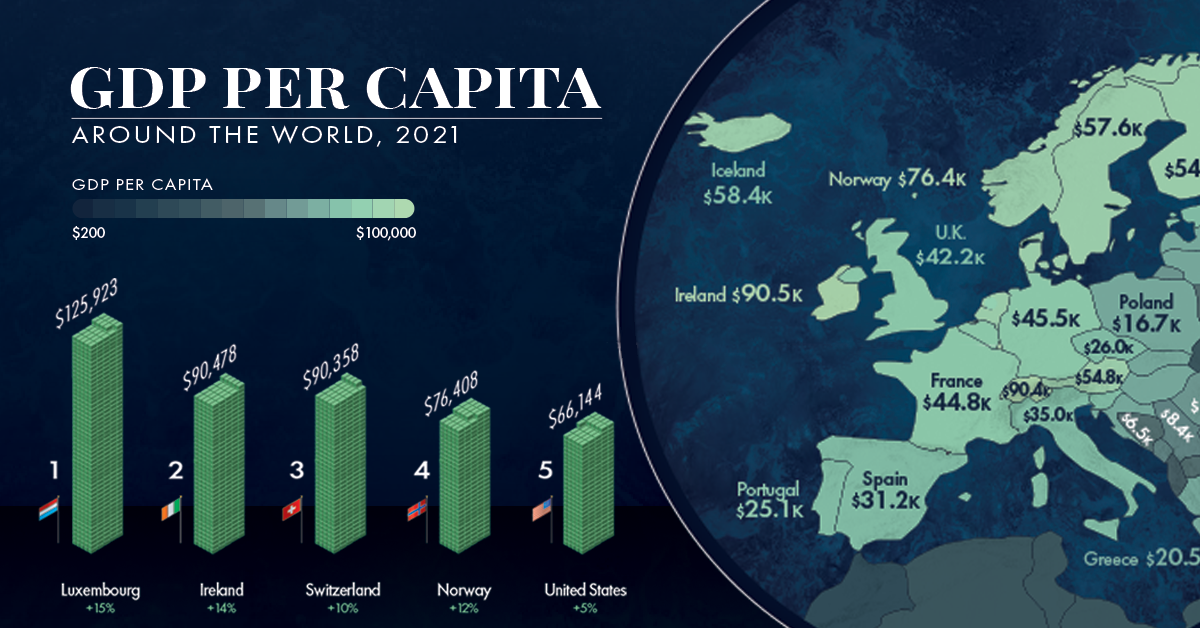
Here’s a look at the 10 countries with the highest GDP per capita in 2021:
However, not all citizens in Luxembourg are extremely wealthy. In fact:
- 29% of people spend over 40% of their income on housing costs
- 31% would be at risk of falling into poverty if they had to forgo 3 months of income
The cost of living is expensive in Luxembourg — but the standard of living in terms of goods and services produced is the highest in the world. Additionally, only 4% of the population reports low life satisfaction.
Emerging Economies and Developing Countries
Although we have never lived in a more prosperous period, and poverty rates have been declining overall, this year global extreme poverty rose for the first time in over two decades.
About 120 million additional people are living in poverty as a result of the pandemic, with the total expected to rise to about 150 million by the end of 2021.
Many of the poorest countries in the world are also considered Least Developed Countries (LDCs) by the UN. In these countries, more than 75% of the population live below the poverty line.
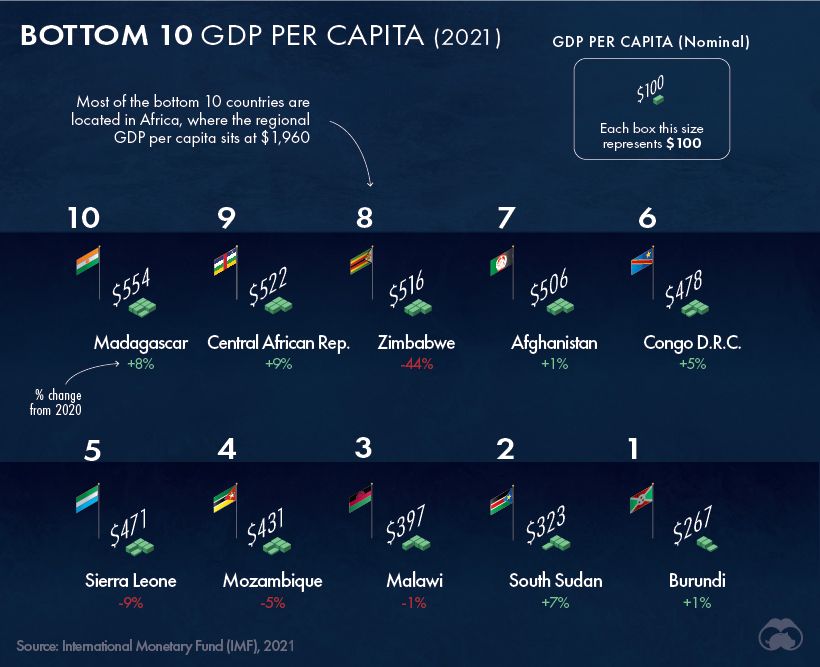
Here’s a look at the 10 countries with the lowest GDP per capita:
Life in these countries offers a stark contrast compared to the top 10. Here’s a glance at the quality of life in the poorest country, Burundi:
- 80% of the population works in agriculture
- 1 in 3 Burundians are in need of urgent humanitarian assistance
- Average households spend up to two-thirds of their income on food
However, many of the world’s poorest countries can also be classified as emerging markets with immense economic potential in the future.
In fact, China has seen the opportunity in emerging economies. Their confidence in these regions is best exemplified in the Belt and Road initiative which has funneled massive investments into infrastructure projects across multiple African countries.
Continually Raising the Bar
Prosperity is a very recent reality only characterizing the last couple hundred years. In pre-modern societies, the average person was living in conditions that would be considered extreme poverty by today’s standards.
Overall, the standard of living for everyone today is immensely improved compared to even recent history, and some countries will be experiencing rapid economic growth in the future.
GDP per Capita in 2021: Full Dataset
| Country | GDP per Capita (Nominal, 2021, USD) |
|---|---|
| 🇱🇺 Luxembourg | $125,923 |
| 🇮🇪 Ireland | $90,478 |
| 🇨🇭 Switzerland | $90,358 |
| 🇳🇴 Norway | $76,408 |
| 🇺🇸 United States | $66,144 |
| 🇩🇰 Denmark | $63,645 |
| 🇸🇬 Singapore | $62,113 |
| 🇮🇸 Iceland | $58,371 |
| 🇳🇱 Netherlands | $58,029 |
| 🇸🇪 Sweden | $57,660 |
| Australia | $57,211 |
| Qatar | $55,417 |
| Austria | $54,820 |
| Finland | $54,817 |
| Germany | $51,967 |
| Belgium | $50,051 |
| Macao SAR | $48,207 |
| Hong Kong SAR | $47,990 |
| Canada | $45,871 |
| France | $44,770 |
| San Marino | $44,676 |
| Israel | $43,439 |
| United Kingdom | $42,236 |
| New Zealand | $41,793 |
| Japan | $40,733 |
| Italy | $35,062 |
| United Arab Emirates | $32,686 |
| South Korea | $32,305 |
| Malta | $32,099 |
| The Bahamas | $31,532 |
| Puerto Rico | $31,207 |
| Spain | $31,178 |
| Europe | $31,022 |
| Cyprus | $29,686 |
| Taiwan | $28,890 |
| Slovenia | $28,734 |
| Estonia | $26,378 |
| Brunei | $26,274 |
| Czech Republic | $25,991 |
| Portugal | $25,097 |
| Bahrain | $23,710 |
| Kuwait | $23,138 |
| Lithuania | $22,752 |
| Aruba | $22,710 |
| Slovakia | $21,606 |
| Saudi Arabia | $20,742 |
| Greece | $20,521 |
| Latvia | $19,934 |
| Hungary | $17,645 |
| Barbados | $17,472 |
| Poland | $16,740 |
| Trinidad and Tobago | $16,622 |
| Saint Kitts and Nevis | $16,491 |
| Croatia | $16,402 |
| Uruguay | $16,297 |
| Romania | $14,916 |
| Antigua and Barbuda | $14,748 |
| Oman | $14,675 |
| Panama | $14,390 |
| Chile | $14,209 |
| Maldives | $14,194 |
| Palau | $13,180 |
| Seychelles | $12,648 |
| Costa Rica | $11,805 |
| China | $11,713 |
| Malaysia | $11,378 |
| Bulgaria | $11,349 |
| Russia | $10,793 |
| Saint Lucia | $10,636 |
| Grenada | $10,211 |
| Guyana | $9,913 |
| Nauru | $9,865 |
| Mauritius | $9,630 |
| Kazakhstan | $9,454 |
| Montenegro | $9,152 |
| Argentina | $9,095 |
| Turkmenistan | $8,874 |
| Serbia | $8,444 |
| Mexico | $8,403 |
| Dominica | $8,111 |
| Equatorial Guinea | $8,000 |
| Gabon | $7,785 |
| Dominican Republic | $7,740 |
| Thailand | $7,675 |
| Iran | $7,668 |
| Turkey | $7,659 |
| Saint Vincent and the Grenadines | $7,401 |
| Botswana | $7,036 |
| North Macedonia | $6,933 |
| Brazil | $6,728 |
| Bosnia and Herzegovina | $6,536 |
| Belarus | $6,513 |
| Peru | $6,229 |
| Jamaica | $5,643 |
| Ecuador | $5,589 |
| Colombia | $5,457 |
| South Africa | $5,236 |
| Paraguay | $5,207 |
| Albania | $5,161 |
| Tonga | $4,949 |
| Suriname | $4,921 |
| Fiji | $4,822 |
| Iraq | $4,767 |
| Kosovo | $4,753 |
| Libya | $4,733 |
| Georgia | $4,714 |
| Moldova | $4,527 |
| Armenia | $4,427 |
| Namibia | $4,412 |
| Azerbaijan | $4,404 |
| Guatemala | $4,385 |
| Jordan | $4,347 |
| Tuvalu | $4,296 |
| Indonesia | $4,287 |
| Mongolia | $4,139 |
| Marshall Islands | $4,092 |
| Samoa | $4,053 |
| El Salvador | $4,023 |
| Micronesia | $3,995 |
| Belize | $3,968 |
| Sri Lanka | $3,928 |
| Vietnam | $3,759 |
| Eswatini | $3,697 |
| Cabo Verde | $3,675 |
| Bolivia | $3,618 |
| Ukraine | $3,615 |
| Egypt | $3,606 |
| Philippines | $3,602 |
| North Africa | $3,560 |
| Algeria | $3,449 |
| Bhutan | $3,447 |
| Morocco | $3,409 |
| Tunisia | $3,380 |
| Djibouti | $3,275 |
| West Bank and Gaza | $3,060 |
| Vanuatu | $2,967 |
| Laos | $2,614 |
| Papua New Guinea | $2,596 |
| Honduras | $2,593 |
| Côte d'Ivoire | $2,571 |
| Solomon Islands | $2,501 |
| Ghana | $2,300 |
| Republic of Congo | $2,271 |
| Nigeria | $2,209 |
| São Tomé and Príncipe | $2,133 |
| Angola | $2,130 |
| Kenya | $2,122 |
| India | $2,031 |
| Bangladesh | $1,990 |
| Uzbekistan | $1,836 |
| Nicaragua | $1,828 |
| Kiribati | $1,817 |
| Mauritania | $1,782 |
| Cambodia | $1,680 |
| Cameroon | $1,657 |
| Senegal | $1,629 |
| Venezuela | $1,586 |
| Myanmar | $1,441 |
| Comoros | $1,431 |
| Benin | $1,400 |
| Timor-Leste | $1,273 |
| Kyrgyzstan | $1,270 |
| Nepal | $1,166 |
| Tanzania | $1,132 |
| Guinea | $1,067 |
| Lesotho | $1,018 |
| Zambia | $1,006 |
| Mali | $992 |
| Uganda | $971 |
| Ethiopia | $918 |
| Tajikistan | $851 |
| Burkina Faso | $851 |
| Guinea-Bissau | $844 |
| Rwanda | $820 |
| The Gambia | $809 |
| Togo | $759 |
| Sudan | $714 |
| Chad | $710 |
| Haiti | $698 |
| Liberia | $646 |
| Eritrea | $632 |
| Yemen | $573 |
| Niger | $567 |
| Madagascar | $554 |
| Central African Republic | $522 |
| Zimbabwe | $516 |
| Afghanistan | $506 |
| Democratic Republic of the Congo | $478 |
| Sierra Leone | $471 |
| Mozambique | $431 |
| Malawi | $397 |
| South Sudan | $323 |
| Burundi | $267 |
Editor’s note: Readers have rightly pointed out that Monaco is one of the world’s richest countries in GDP per capita (nominal) terms. This is true, but the IMF dataset excludes Monaco and lists it as “No data” each year. As a result, it is excluded from the visualization(s) above.


Markets
Mapped: Europe’s GDP Per Capita, by Country
Which European economies are richest on a GDP per capita basis? This map shows the results for 44 countries across the continent.


Mapped: Europe’s GDP Per Capita, by Country (2024)
This was originally posted on our Voronoi app. Download the app for free on iOS or Android and discover incredible data-driven charts from a variety of trusted sources.
Europe is home to some of the largest and most sophisticated economies in the world. But how do countries in the region compare with each other on a per capita productivity basis?
In this map, we show Europe’s GDP per capita levels across 44 nations in current U.S. dollars. Data for this visualization and article is sourced from the International Monetary Fund (IMF) via their DataMapper tool, updated April 2024.
Europe’s Richest and Poorest Nations, By GDP Per Capita
Luxembourg, Ireland, and Switzerland, lead the list of Europe’s richest nations by GDP per capita, all above $100,000.
| Rank | Country | GDP Per Capita (2024) |
|---|---|---|
| 1 | 🇱🇺 Luxembourg | $131,380 |
| 2 | 🇮🇪 Ireland | $106,060 |
| 3 | 🇨🇭 Switzerland | $105,670 |
| 4 | 🇳🇴 Norway | $94,660 |
| 5 | 🇮🇸 Iceland | $84,590 |
| 6 | 🇩🇰 Denmark | $68,900 |
| 7 | 🇳🇱 Netherlands | $63,750 |
| 8 | 🇸🇲 San Marino | $59,410 |
| 9 | 🇦🇹 Austria | $59,230 |
| 10 | 🇸🇪 Sweden | $58,530 |
| 11 | 🇧🇪 Belgium | $55,540 |
| 12 | 🇫🇮 Finland | $55,130 |
| 13 | 🇩🇪 Germany | $54,290 |
| 14 | 🇬🇧 UK | $51,070 |
| 15 | 🇫🇷 France | $47,360 |
| 16 | 🇦🇩 Andorra | $44,900 |
| 17 | 🇲🇹 Malta | $41,740 |
| 18 | 🇮🇹 Italy | $39,580 |
| 19 | 🇨🇾 Cyprus | $37,150 |
| 20 | 🇪🇸 Spain | $34,050 |
| 21 | 🇸🇮 Slovenia | $34,030 |
| 22 | 🇪🇪 Estonia | $31,850 |
| 23 | 🇨🇿 Czech Republic | $29,800 |
| 24 | 🇵🇹 Portugal | $28,970 |
| 25 | 🇱🇹 Lithuania | $28,410 |
| 26 | 🇸🇰 Slovakia | $25,930 |
| 27 | 🇱🇻 Latvia | $24,190 |
| 28 | 🇬🇷 Greece | $23,970 |
| 29 | 🇭🇺 Hungary | $23,320 |
| 30 | 🇵🇱 Poland | $23,010 |
| 31 | 🇭🇷 Croatia | $22,970 |
| 32 | 🇷🇴 Romania | $19,530 |
| 33 | 🇧🇬 Bulgaria | $16,940 |
| 34 | 🇷🇺 Russia | $14,390 |
| 35 | 🇹🇷 Türkiye | $12,760 |
| 36 | 🇲🇪 Montenegro | $12,650 |
| 37 | 🇷🇸 Serbia | $12,380 |
| 38 | 🇦🇱 Albania | $8,920 |
| 39 | 🇧🇦 Bosnia & Herzegovina | $8,420 |
| 40 | 🇲🇰 North Macedonia | $7,690 |
| 41 | 🇧🇾 Belarus | $7,560 |
| 42 | 🇲🇩 Moldova | $7,490 |
| 43 | 🇽🇰 Kosovo | $6,390 |
| 44 | 🇺🇦 Ukraine | $5,660 |
| N/A | 🇪🇺 EU Average | $44,200 |
Note: Figures are rounded.
Three Nordic countries (Norway, Iceland, Denmark) also place highly, between $70,000-90,000. Other Nordic peers, Sweden and Finland rank just outside the top 10, between $55,000-60,000.
Meanwhile, Europe’s biggest economies in absolute terms, Germany, UK, and France, rank closer to the middle of the top 20, with GDP per capitas around $50,000.
Finally, at the end of the scale, Eastern Europe as a whole tends to have much lower per capita GDPs. In that group, Ukraine ranks last, at $5,660.
A Closer Look at Ukraine
For a broader comparison, Ukraine’s per capita GDP is similar to Iran ($5,310), El Salvador ($5,540), and Guatemala ($5,680).
According to experts, Ukraine’s economy has historically underperformed to expectations. After the fall of the Berlin Wall, the economy contracted for five straight years. Its transition to a Western, liberalized economic structure was overshadowed by widespread corruption, a limited taxpool, and few revenue sources.
Politically, its transformation from authoritarian regime to civil democracy has proved difficult, especially when it comes to institution building.
Finally, after the 2022 invasion of the country, Ukraine’s GDP contracted by 30% in a single year—the largest loss since independence. Large scale emigration—to the tune of six million refugees—is also playing a role.
Despite these challenges, the country’s economic growth has somewhat stabilized while fighting continues.

-

 Markets6 days ago
Visualized: Interest Rate Forecasts for Advanced Economies
-

 Economy2 weeks ago
Economic Growth Forecasts for G7 and BRICS Countries in 2024
-

 Wealth2 weeks ago
Charted: Which City Has the Most Billionaires in 2024?
-

 Technology2 weeks ago
All of the Grants Given by the U.S. CHIPS Act
-

 Green2 weeks ago
The Carbon Footprint of Major Travel Methods
-

 United States1 week ago
Visualizing the Most Common Pets in the U.S.
-

 Culture1 week ago
The World’s Top Media Franchises by All-Time Revenue
-

 Best of1 week ago
Best Visualizations of April on the Voronoi App