Environment
Mapped: 30 Years of Deforestation and Forest Growth, by Country


Global Deforestation and Forest Growth over 30 Years
Forests are the great carbon capturers of our planet, and they are a key source of wildlife habitats and vital resources for people around the world.
But deforestation is threatening this natural infrastructure, releasing carbon into the atmosphere while simultaneously reducing wildlife diversity and making our environment more susceptible to environmental disasters.
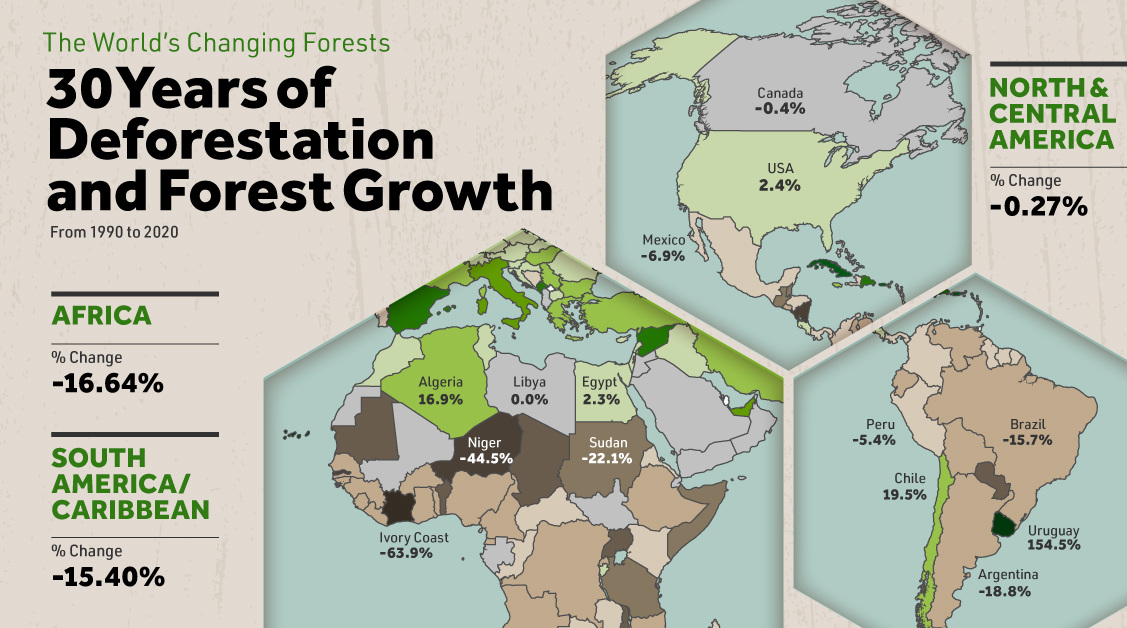
This graphic looks at global deforestation and forest growth over the past 30 years, mapping out the net forest change by country and region using data from the UN’s Food and Agriculture Organization (FAO).
The State of Deforestation by Region
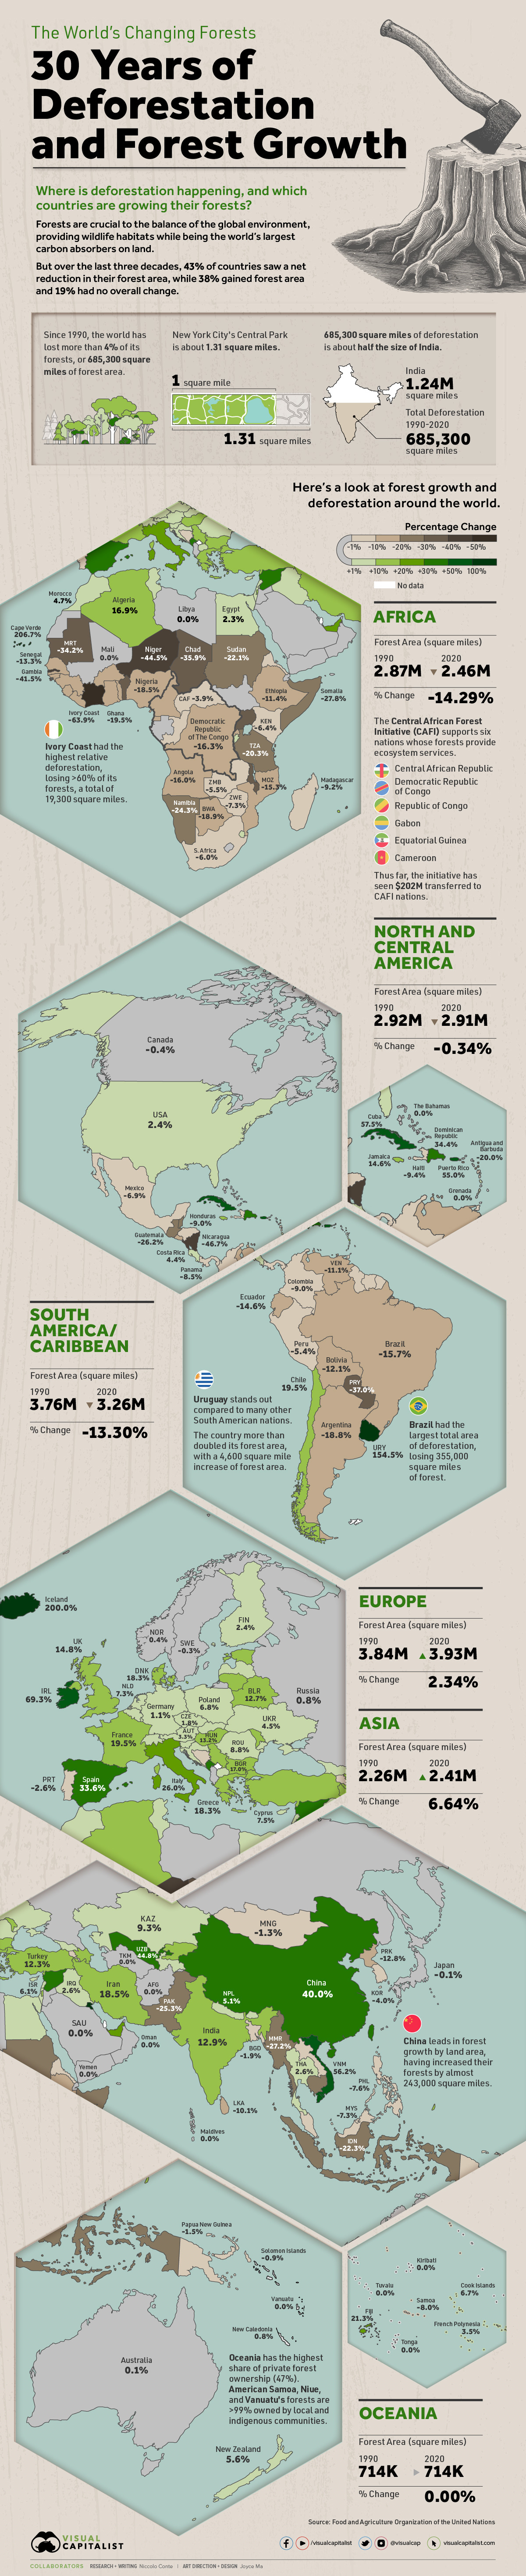
Today, forests make up around 31% of the Earth’s total land area, spanning 15.68 million square miles (40.6 million km²). Over the past three decades, the world lost a bit more than 4% (685,300 square miles) of its forests, which equates to an area about half the size of India.
Europe and Asia were the only two regions which had significant overall forest growth during this time period, while Oceania saw no significant change and North and Central America saw a slight reduction.
| Region | Forest area change (1990-2020) | Percentage change in forest area |
|---|---|---|
| Asia | +146,718 sq mi | +6.64% |
| Europe | +88,803 sq mi | +2.34% |
| Oceania | +1,057 sq mi | +0.0015% |
| North America and Central America | -7,722 sq mi | -0.34% |
| South America and the Caribbean | -501,932 sq mi | -13.30% |
| Africa | -409,268 sq mi | -14.29% |
| Global total | -685,401 sq mi | -4.19% |
Source: UN Food and Agriculture Organization
Africa along with South America and the Caribbean were the regions with the greatest amount of net forest loss, both losing more than 13% of their forests over the past 30 years. This is largely because these two regions have large amounts of forest area available, with the underlying land in high demand for agriculture and cattle-raising.
Although the overall forest loss around the world is massive, the rate of forest loss has slowed down over the past three decades. While an average of 30,116 square miles were lost each year between 1990 to 2000, between 2010 to 2020 that number has dropped to 18,146 square miles, showing that the rate of overall loss has fallen by almost 40%.
The Countries and Drivers of Deforestation and Forest Growth
Despite an overall slowing down of forest loss, certain countries in South America along with the entirety of Africa are still showing an increase in the rate of forest loss. It’s in these regions where most of the countries with the largest reduction in forest area are located:
| Country | Net change in forest area (1990-2020) | Percentage change in forest area |
|---|---|---|
| Brazil | -356,287 sq mi | -15.67% |
| Indonesia | -101,977 sq mi | -22.28% |
| Democratic Republic of the Congo | -94,495 sq mi | -16.25% |
| Angola | -48,865 sq mi | -15.97% |
| Tanzania | -44,962 sq mi | -20.29% |
| Myanmar | -41,213 sq mi | -27.22% |
| Paraguay | -36,463 sq mi | -36.97% |
| Bolivia | -26,915 sq mi | -12.06% |
| Mozambique | -25,614 sq mi | -15.29% |
| Argentina | -25,602 sq mi | -18.84% |
Source: UN Food and Agriculture Organization
Brazil, home to most of the Amazon rainforest, saw 356,287 square miles of net forest loss, largely fueled by farmers using the land to raise cattle for beef. It’s estimated that 80% of the deforested land area of the Amazon has been replaced with pastures, with the resulting beef production known to be among the worst meats for the environment in terms of carbon emissions.
The other great driver of deforestation is seed and palm oil agriculture. These oils account for about 20% of the world’s deforestation carbon emissions, and their production concentrated in Indonesia and Malaysia is now expanding to other Asian countries along with Africa.
While the demand for beef and palm oils drives deforestation, initiatives like the Central African Forest Initiative (CAFI) are providing incentives to protect forest land.
Select countries in the European Union along with the United Kingdom and South Korea have committed $494.7 million to six central African nations (Cameroon, Gabon, Central African Republic, Democratic Republic of the Congo, Equatorial Guinea, and the Republic of Congo) for them to preserve their forests and pursue low emission pathways for sustainable development. The initiative has seen $202 million transferred thus far and an anticipated reduction of 75 million tons of CO2 emissions.
Forests and the Climate Crisis
It’s estimated that forests absorb around 30% of the world’s carbon emissions each year, making them the greatest and most important carbon sinks we have on land. When you pair this with the fact that deforestation contributes around 12% of annual greenhouse gas emissions, the importance of forest preservation becomes even more clear.
But we often forget how much forests protect our environment by acting as natural buffers against extreme weather. Forests increase and ensure rainfall security, making nearby land areas significantly less susceptible to wildfires and natural droughts in hot and dry seasons along with flooding and landslides in wet seasons.
With every dollar invested in landscape restoration yielding up to $30 in benefits, reducing deforestation and investing in reforestation is considered an effective way to reduce the difficulty and costs of meeting climate and environmental protection goals. This is without even considering the benefits of maintaining the world’s largest wildlife habitat and source of species diversity, the home of the nearly 70 million indigenous people who live in forests, and the livelihood of 1.6 billion people who rely on forests every day.
Preserving and Regrowing Forests for the Future
Despite the short-term acceleration in forest loss seen in 2020, there have been positive signs about forest regrowth coming to light. A recent study found that previously deforested land can recuperate its soil fertility in about a decade, and layered plants, trees, and species diversity can recover in around 25-60 years.
Along with this, in some instances these regrowing “secondary forests” can absorb more carbon dioxide than “primary forests”, giving hope that a global reforestation effort can absorb more emissions than previously thought possible.
From better financial incentives for local farmers and ranchers to preserve forest area to larger scale policies and initiatives like CAFI, curbing deforestation and promoting reforestation requires a global effort. Reversing forest loss in the coming decades is a daunting but necessary step towards stabilizing the climate and preserving the environment that billions of animals and people rely on.


Green
Ranked: Top Countries by Total Forest Loss Since 2001
The country with the most forest loss since 2001 lost as much forest cover as the next four countries combined.
Ranked: Top Countries By Total Forest Loss Since 2001
This was originally posted on our Voronoi app. Download the app for free on iOS or Android and discover incredible data-driven charts from a variety of trusted sources.
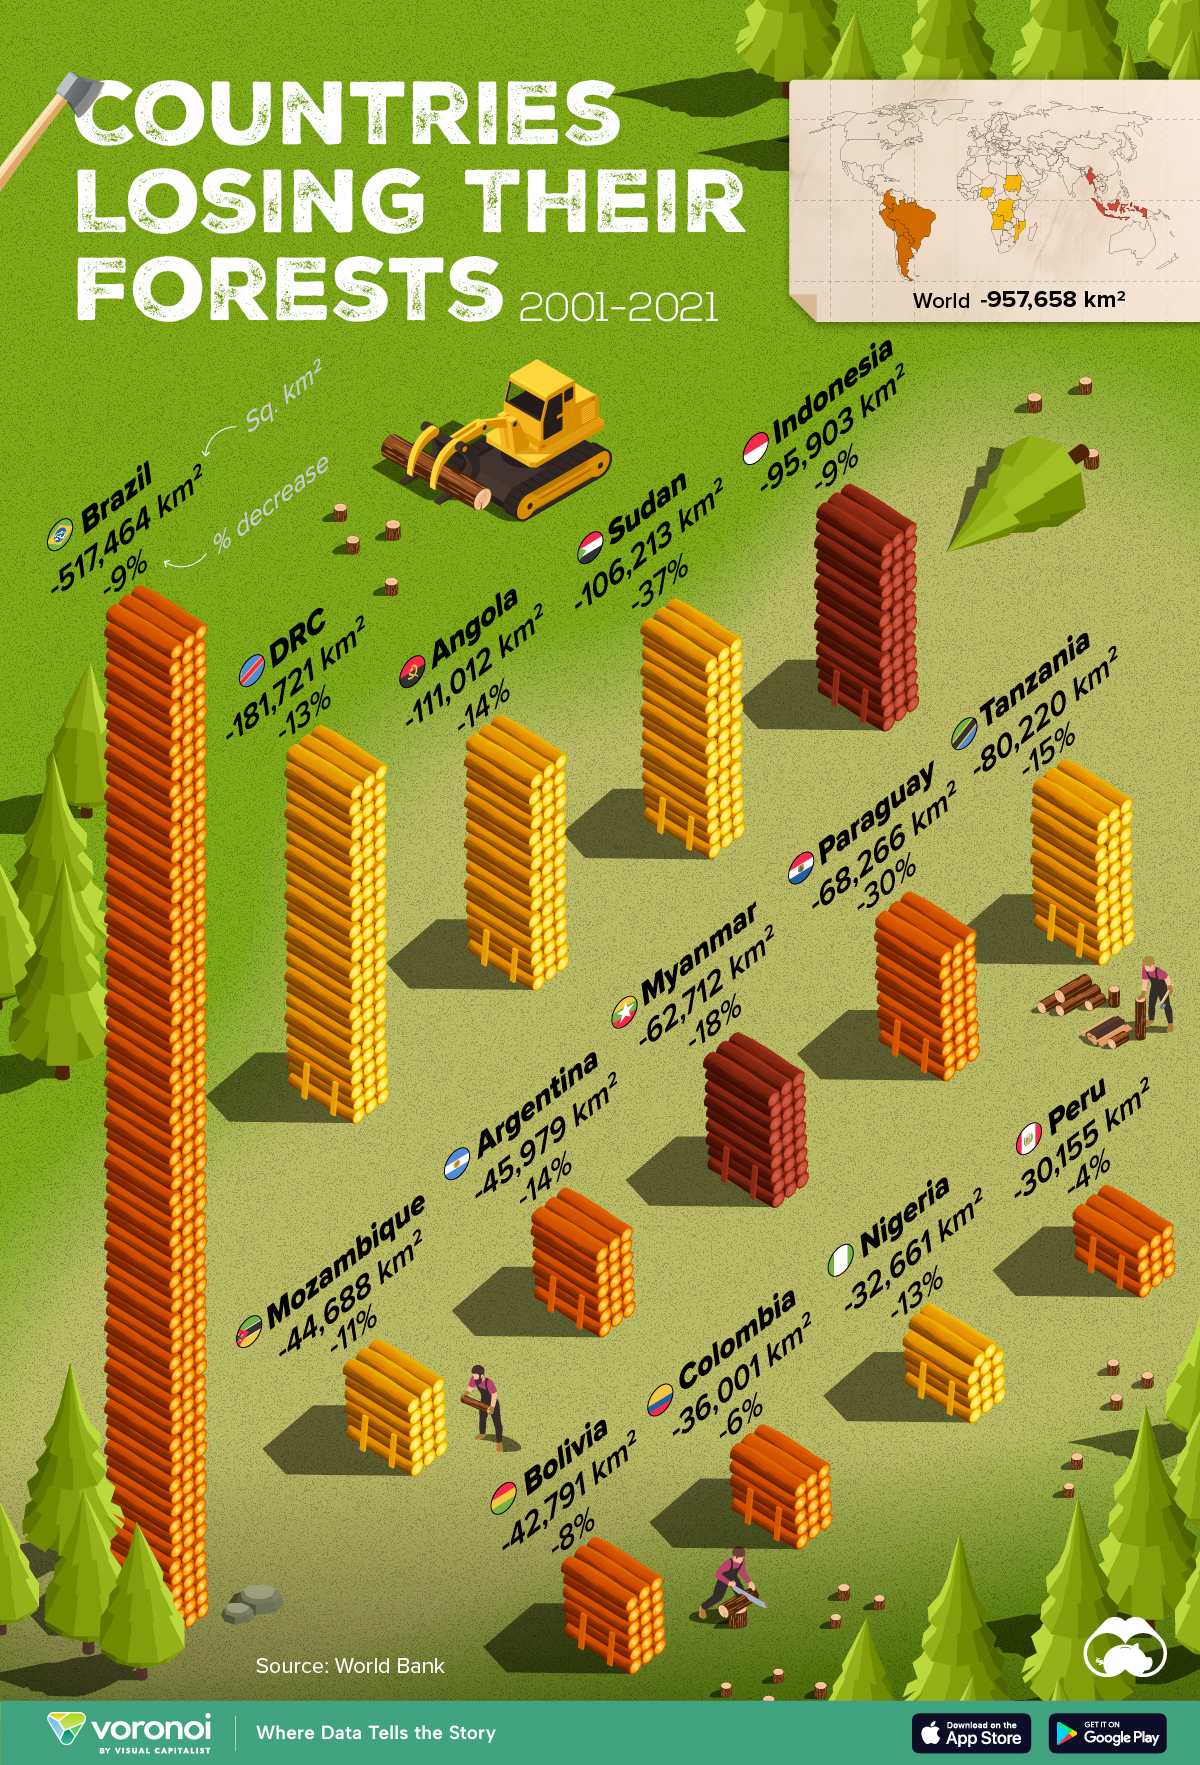
Forests are critical natural resources, often caught in the crosshairs of economic development. Thanks to expanding human settlement, agriculture, and industry, the world lost nearly 1 million square kilometers (km²) of forest cover since 2001.
But where has most of this deforestation occurred?
We rank the countries by the total decrease in their forest area between 2001 and 2021, measured in square kilometers along with their percentage decrease for context. All of this data was sourced from the World Bank.
A caveat to this data: countries are ranked by total forest loss, so countries with the largest forests feature predominantly on this list.
Which Country Has Lost the Most Forests (2001-2021)?
Brazil has lost more than half a million square kilometers of forest in the last two decades. Agricultural expansion for beef and soy production alongside mining and infrastructure growth are the primary drivers behind this large scale deforestation.
This has also caused periodic fires in the Amazon rainforest, drawing repeated alarm from around the world. In fact, Brazil has lost as much forest cover as the next four countries combined.
The table below lists the countries included in this graphic, as well as several others further down the ranking.
| Rank | Country | Region | 2001–21 Change (in km2) | % of Forest Loss |
|---|---|---|---|---|
| 1 | 🇧🇷 Brazil | South America | -517,464 | -9% |
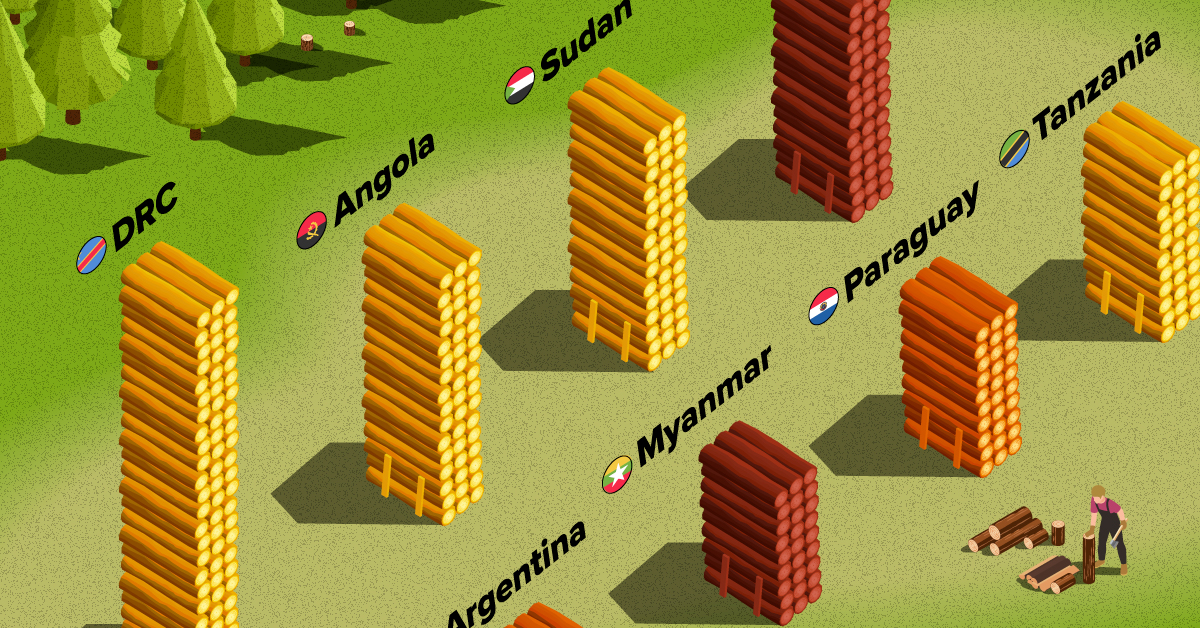
| 2 | 🇨🇩 DRC | Africa | -181,721 | -13% |
| 3 | 🇦🇴 Angola | Africa | -111,012 | -14% |
| 4 | 🇸🇩 Sudan | Africa | -106,213 | -37% |
| 5 | 🇮🇩 Indonesia | Asia | -95,903 | -9% |
| 6 | 🇹🇿 Tanzania | Africa | -80,220 | -15% |
| 7 | 🇵🇾 Paraguay | South America | -68,266 | -30% |
| 8 | 🇲🇲 Myanmar | Asia | -62,712 | -18% |
| 9 | 🇦🇷 Argentina | South America | -45,979 | -14% |
| 10 | 🇲🇿 Mozambique | Africa | -44,688 | -11% |
| 11 | 🇧🇴 Bolivia | South America | -42,791 | -8% |
| 12 | 🇨🇴 Colombia | South America | -36,001 | -6% |
| 13 | 🇳🇬 Nigeria | Africa | -32,661 | -13% |
| 14 | 🇵🇪 Peru | South America | -30,155 | -4% |
| 15 | 🇰🇭 Cambodia | Asia | -28,491 | -26% |
| 16 | 🇻🇪 Venezuela | South America | -28,130 | -6% |
| 17 | 🇲🇽 Mexico | North America | -26,732 | -4% |
| 18 | 🇿🇲 Zambia | Africa | -23,924 | -5% |
| 19 | 🇧🇼 Botswana | Africa | -23,660 | -14% |
| 20 | 🇨🇮 Cote d'Ivoire | Africa | -22,577 | -45% |
What is quickly apparent is how most of the countries on this list are from Africa and South America. A study found a correlation where developing economies tend to have higher deforestation rates than advanced economies. Former colonies have also experienced more forest loss than those that were not colonized.
In Asia, Indonesia’s burgeoning palm oil industry is a key driver to deforestation, though efforts are now being made to reverse its impact. Meanwhile, Cambodia experienced rapid clear-cutting for its growing rubber plantations and timber industry.
Finally, Myanmar has long contended with illegal logging, but the country’s ongoing civil war is styming conversation efforts.

-

 Mining1 week ago
Gold vs. S&P 500: Which Has Grown More Over Five Years?
-

 Markets2 weeks ago
Ranked: The Most Valuable Housing Markets in America
-

 Money2 weeks ago
Which States Have the Highest Minimum Wage in America?
-

 AI2 weeks ago
Ranked: Semiconductor Companies by Industry Revenue Share
-

 Markets2 weeks ago
Ranked: The World’s Top Flight Routes, by Revenue
-

 Demographics2 weeks ago
Population Projections: The World’s 6 Largest Countries in 2075
-

 Markets2 weeks ago
The Top 10 States by Real GDP Growth in 2023
-

 Demographics2 weeks ago
The Smallest Gender Wage Gaps in OECD Countries