Technology
How Big Tech Makes Their Billions
Check out the 2022 edition of how Big Tech makes their billions for the latest update.
How Big Tech Makes Their Billions
Check out the 2022 edition of how Big Tech makes their billions for the latest update.
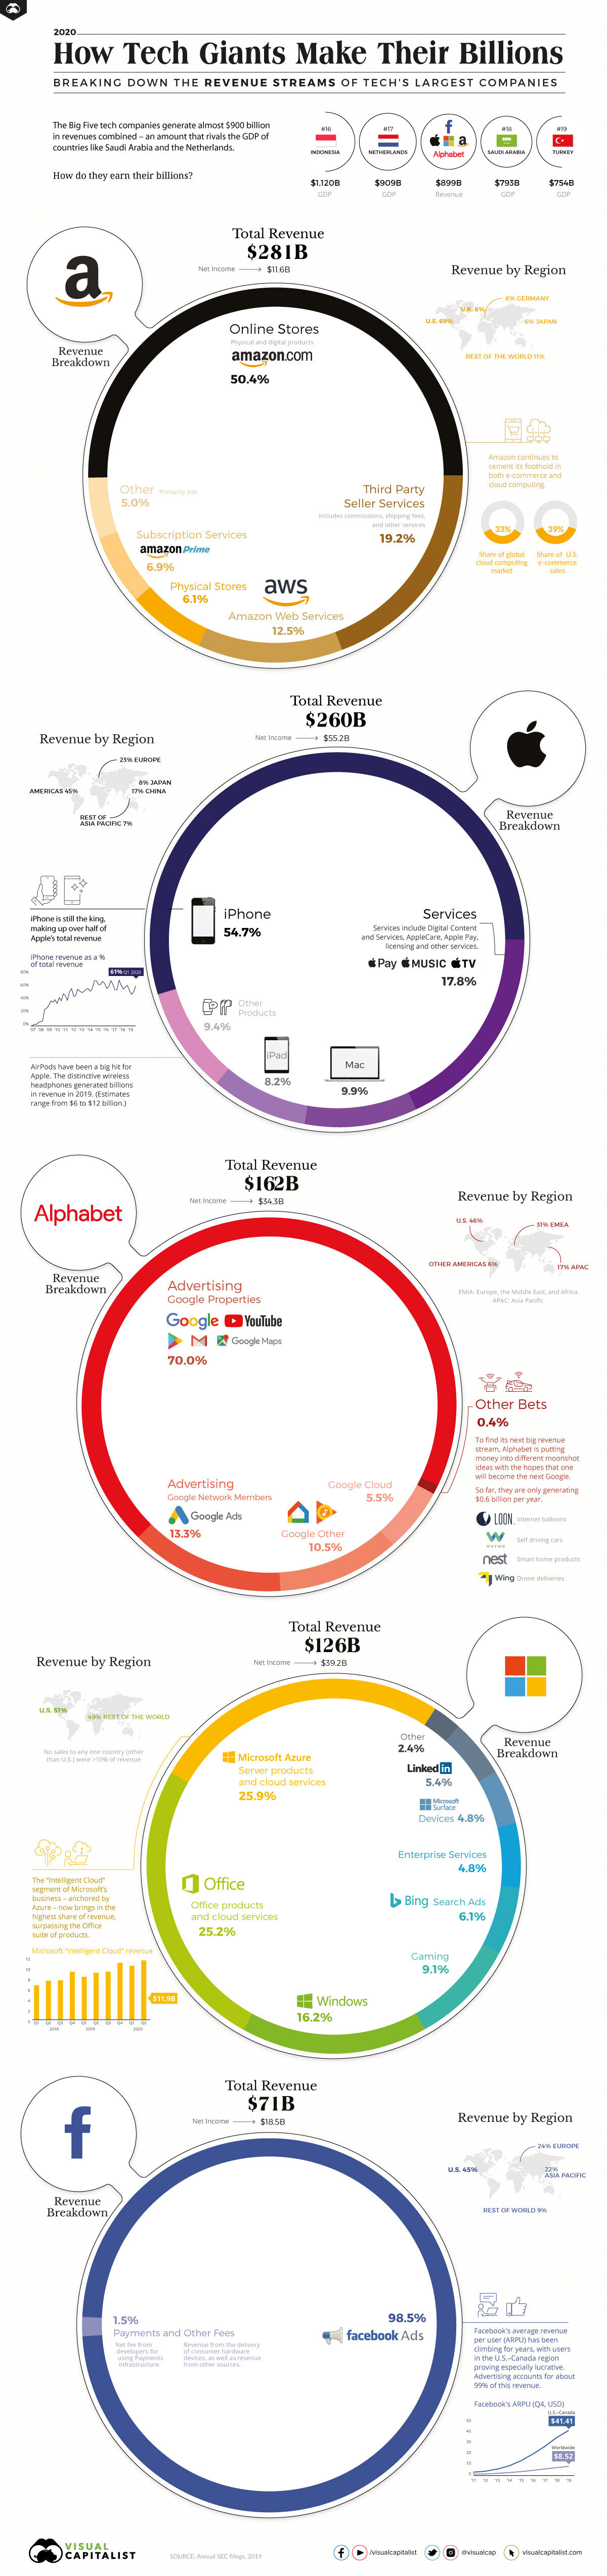
The world’s largest companies are all in technology, and four out of five of those “Big Tech” companies have grown to trillion-dollar market capitalizations.
Despite their similarities, each of the five technology companies (Amazon, Apple, Facebook, Microsoft, and Alphabet) have very different cashflow breakdowns and growth trajectories. Some have a diversified mix of applications and cloud services, products, and data accumulation, while others have a more singular focus.
But through growth in almost all segments, Big Tech has eclipsed Big Oil and other major industry groups to comprise the most valuable publicly-traded companies in the world. By continuing to grow, these companies have strengthened the financial position of their billionaire founders and led the tech-heavy NASDAQ to new record highs.
Unfortunately, with growth comes difficulty. Data-use, diversity, and treatment of workers have all become hot-button issues on a global scale, putting Big Tech on the defensive with advertisers and governments alike.
Still, even this hasn’t stopped the tech giants from (almost) all posting massive revenue growth.
Revenues for Big Tech Keep Increasing
Across the board, greater technological adoption is the biggest driver of increased revenues.
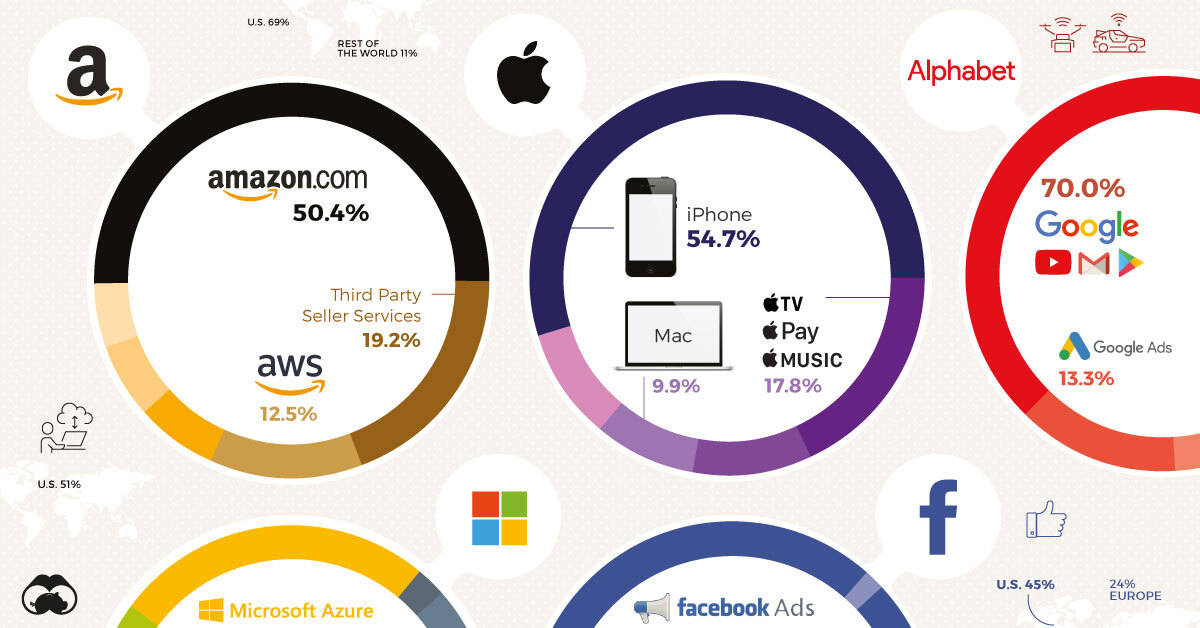
Amazon earned the most in total revenue compared with last year’s figures, with leaps in almost all of the company’s operations. Revenue from online sales and third-party seller services increased by almost $30 billion, while Amazon Web Services and Amazon Prime saw increased revenues of $15 billion combined.
The only chunk of the Amazon pie that didn’t increase were physical store sales, which have stagnated after previously being the fastest growing segment.
Big Tech Revenues (2019 vs. 2018)
| Company | Revenue (2018) | Revenue (2019) | Growth (YoY) |
|---|---|---|---|
| Apple | $265.6 billion | $260.2 billion | -2.03% |
| Amazon | $232.9 billion | $280.5 billion | 20.44% |
| Alphabet | $136.8 billion | $161.9 billion | 18.35% |
| Microsoft | $110.4 billion | $125.8 billion | 13.95% |
| $55.8 billion | $70.8 billion | 26.88% | |
| Combined | $801.5 billion | $899.2 billion | 12.19% |
Services and ads drove increased revenues for the rest of Big Tech as well. Alphabet’s ad revenue from Google properties and networks increased by $20 billion. Meanwhile, Google Cloud has seen continued adoption and grown into its own $8.9 billion segment.
For Microsoft, growth in cloud computing and services led to stronger revenue in almost all segments. Most interestingly, growth for Azure services outpaced that of Office and Windows to become the company’s largest share of revenue.
And greater adoption of services and ad integration were a big boost for ad-driven Facebook. Largely due to continued increases in average revenue per user, Facebook generated an additional $20 billion in revenue.
Comparing the Tech Giants
The one company that didn’t post massive revenue increases was Apple, though it did see gains in some revenue segments.
iPhone revenue, still the cornerstone of the business, dropped by almost $25 billion. That offset an almost $10 billion increase in revenue from services and about $3 billion from iPad sales.
However, with net income of $55.2 billion, Apple leads Big Tech in both net income and market capitalization.
Big Tech: The Full Picture
| Company | Revenue (2019) | Net Income (2019) | Market Cap (July 2020) |
|---|---|---|---|
| Apple | $260.2 billion | $55.2 billion | $1.58 trillion |
| Amazon | $280.5 billion | $11.6 billion | $1.44 trillion |
| Alphabet | $161.9 billion | $34.3 billion | $1.02 trillion |
| Microsoft | $125.8 billion | $39.2 billion | $1.56 trillion |
| $70.8 billion | $18.5 billion | $665.04 billion | |
| Combined | $899.2 billion | $158.8 billion | $6.24 trillion |
Bigger Than Countries
They might have different revenue streams and margins, but together the tech giants have grown from Silicon Valley upstarts to global forces.
The tech giants combined for almost $900 billion in revenues in 2019, greater than the GDP of four of the G20 nations. By comparison, Big Tech’s earnings would make it the #18 largest country by GDP, ahead of Saudi Arabia and just behind the Netherlands.
Big Tech earns billions by capitalizing on their platforms and growing user databases. Through increased growth and adoption of software, cloud computing, and ad proliferation, those billions should continue to increase.
As technology use has increased in 2020, and is only forecast to continue growing, how much more will Big Tech be able to earn in the future?


Technology
Countries With the Highest Rates of Crypto Ownership
While the U.S. is a major market for cryptocurrencies, two countries surpass it in terms of their rates of crypto ownership.


Countries With the Highest Rates of Crypto Ownership
This was originally posted on our Voronoi app. Download the app for free on iOS or Android and discover incredible data-driven charts from a variety of trusted sources.
This graphic ranks the top 10 countries by their rate of cryptocurrency ownership, which is the percentage of the population that owns crypto. These figures come from crypto payment gateway, Triple-A, and are as of 2023.
Data and Highlights
The table below lists the rates of crypto ownership in the top 10 countries, as well as the number of people this amounts to.
| Country | % of Population Who Own Crypto | # of Crypto Owners |
|---|---|---|
| 🇦🇪 United Arab Emirates | 30.4 | 3M |
| 🇻🇳 Vietnam | 21.2 | 21M |
| 🇺🇸 U.S. | 15.6 | 53M |
| 🇮🇷 Iran | 13.5 | 12M |
| 🇵🇭 Philippines | 13.4 | 16M |
| 🇧🇷 Brazil | 12 | 26M |
| 🇸🇦 Saudi Arabia | 11.4 | 4M |
| 🇸🇬 Singapore | 11.1 | 665K |
| 🇺🇦 Ukraine | 10.6 | 4M |
| 🇻🇪 Venezuela | 10.3 | 3M |
Note that if we were to rank countries based on their actual number of crypto owners, India would rank first at 93 million people, China would rank second at 59 million people, and the U.S. would rank third at 52 million people.
The UAE Takes the Top Spot
The United Arab Emirates (UAE) boasts the highest rates of crypto ownership globally. The country’s government is considered to be very crypto friendly, as described in Henley & Partners’ Crypto Wealth Report 2023:
In the UAE, the Financial Services Regulatory Authority (FSRA-ADGM) was the first to provide rules and regulations regarding cryptocurrency purchasing and selling. The Emirates are generally very open to new technologies and have proposed zero taxes for crypto owners and businesses.
Vietnam leads Southeast Asia
According to the Crypto Council for Innovation, cryptocurrency holdings in Vietnam are also untaxed, making them an attractive asset.
Another reason for Vietnam’s high rates of ownership could be its large unbanked population (people without access to financial services). Cryptocurrencies may provide an alternative means of accessing these services without relying on traditional banks.
Learn More About Crypto From Visual Capitalist
If you enjoyed this post, be sure to check out The World’s Largest Corporate Holders of Bitcoin, which ranks the top 12 publicly traded companies by their Bitcoin holdings.

-

 Energy5 days ago
Who’s Building the Most Solar Energy?
-

 Wealth2 weeks ago
Charted: Which Country Has the Most Billionaires in 2024?
-

 Business2 weeks ago
The Top Private Equity Firms by Country
-

 Markets2 weeks ago
The Best U.S. Companies to Work for According to LinkedIn
-

 Economy1 week ago
Ranked: The Top 20 Countries in Debt to China
-

 Misc1 week ago
Charted: Trust in Government Institutions by G7 Countries
-

 Energy1 week ago
Mapped: The Age of Energy Projects in Interconnection Queues, by State
-

 Mining1 week ago
Visualizing Global Gold Production in 2023