Markets
The Biggest Global Risks of 2023


The Biggest Global Risks of 2023
The profile of risks facing the world is evolving constantly. Events like last year’s invasion of Ukraine can send shockwaves through the system, radically shifting perceptions of what the biggest risks facing humanity are.
Today’s graphic summarizes findings from the Global Risks Report, an annual publication produced by the World Economic Forum (WEF). It provides an overview of the most pressing global risks that the world is facing, as identified by experts and decision-makers.
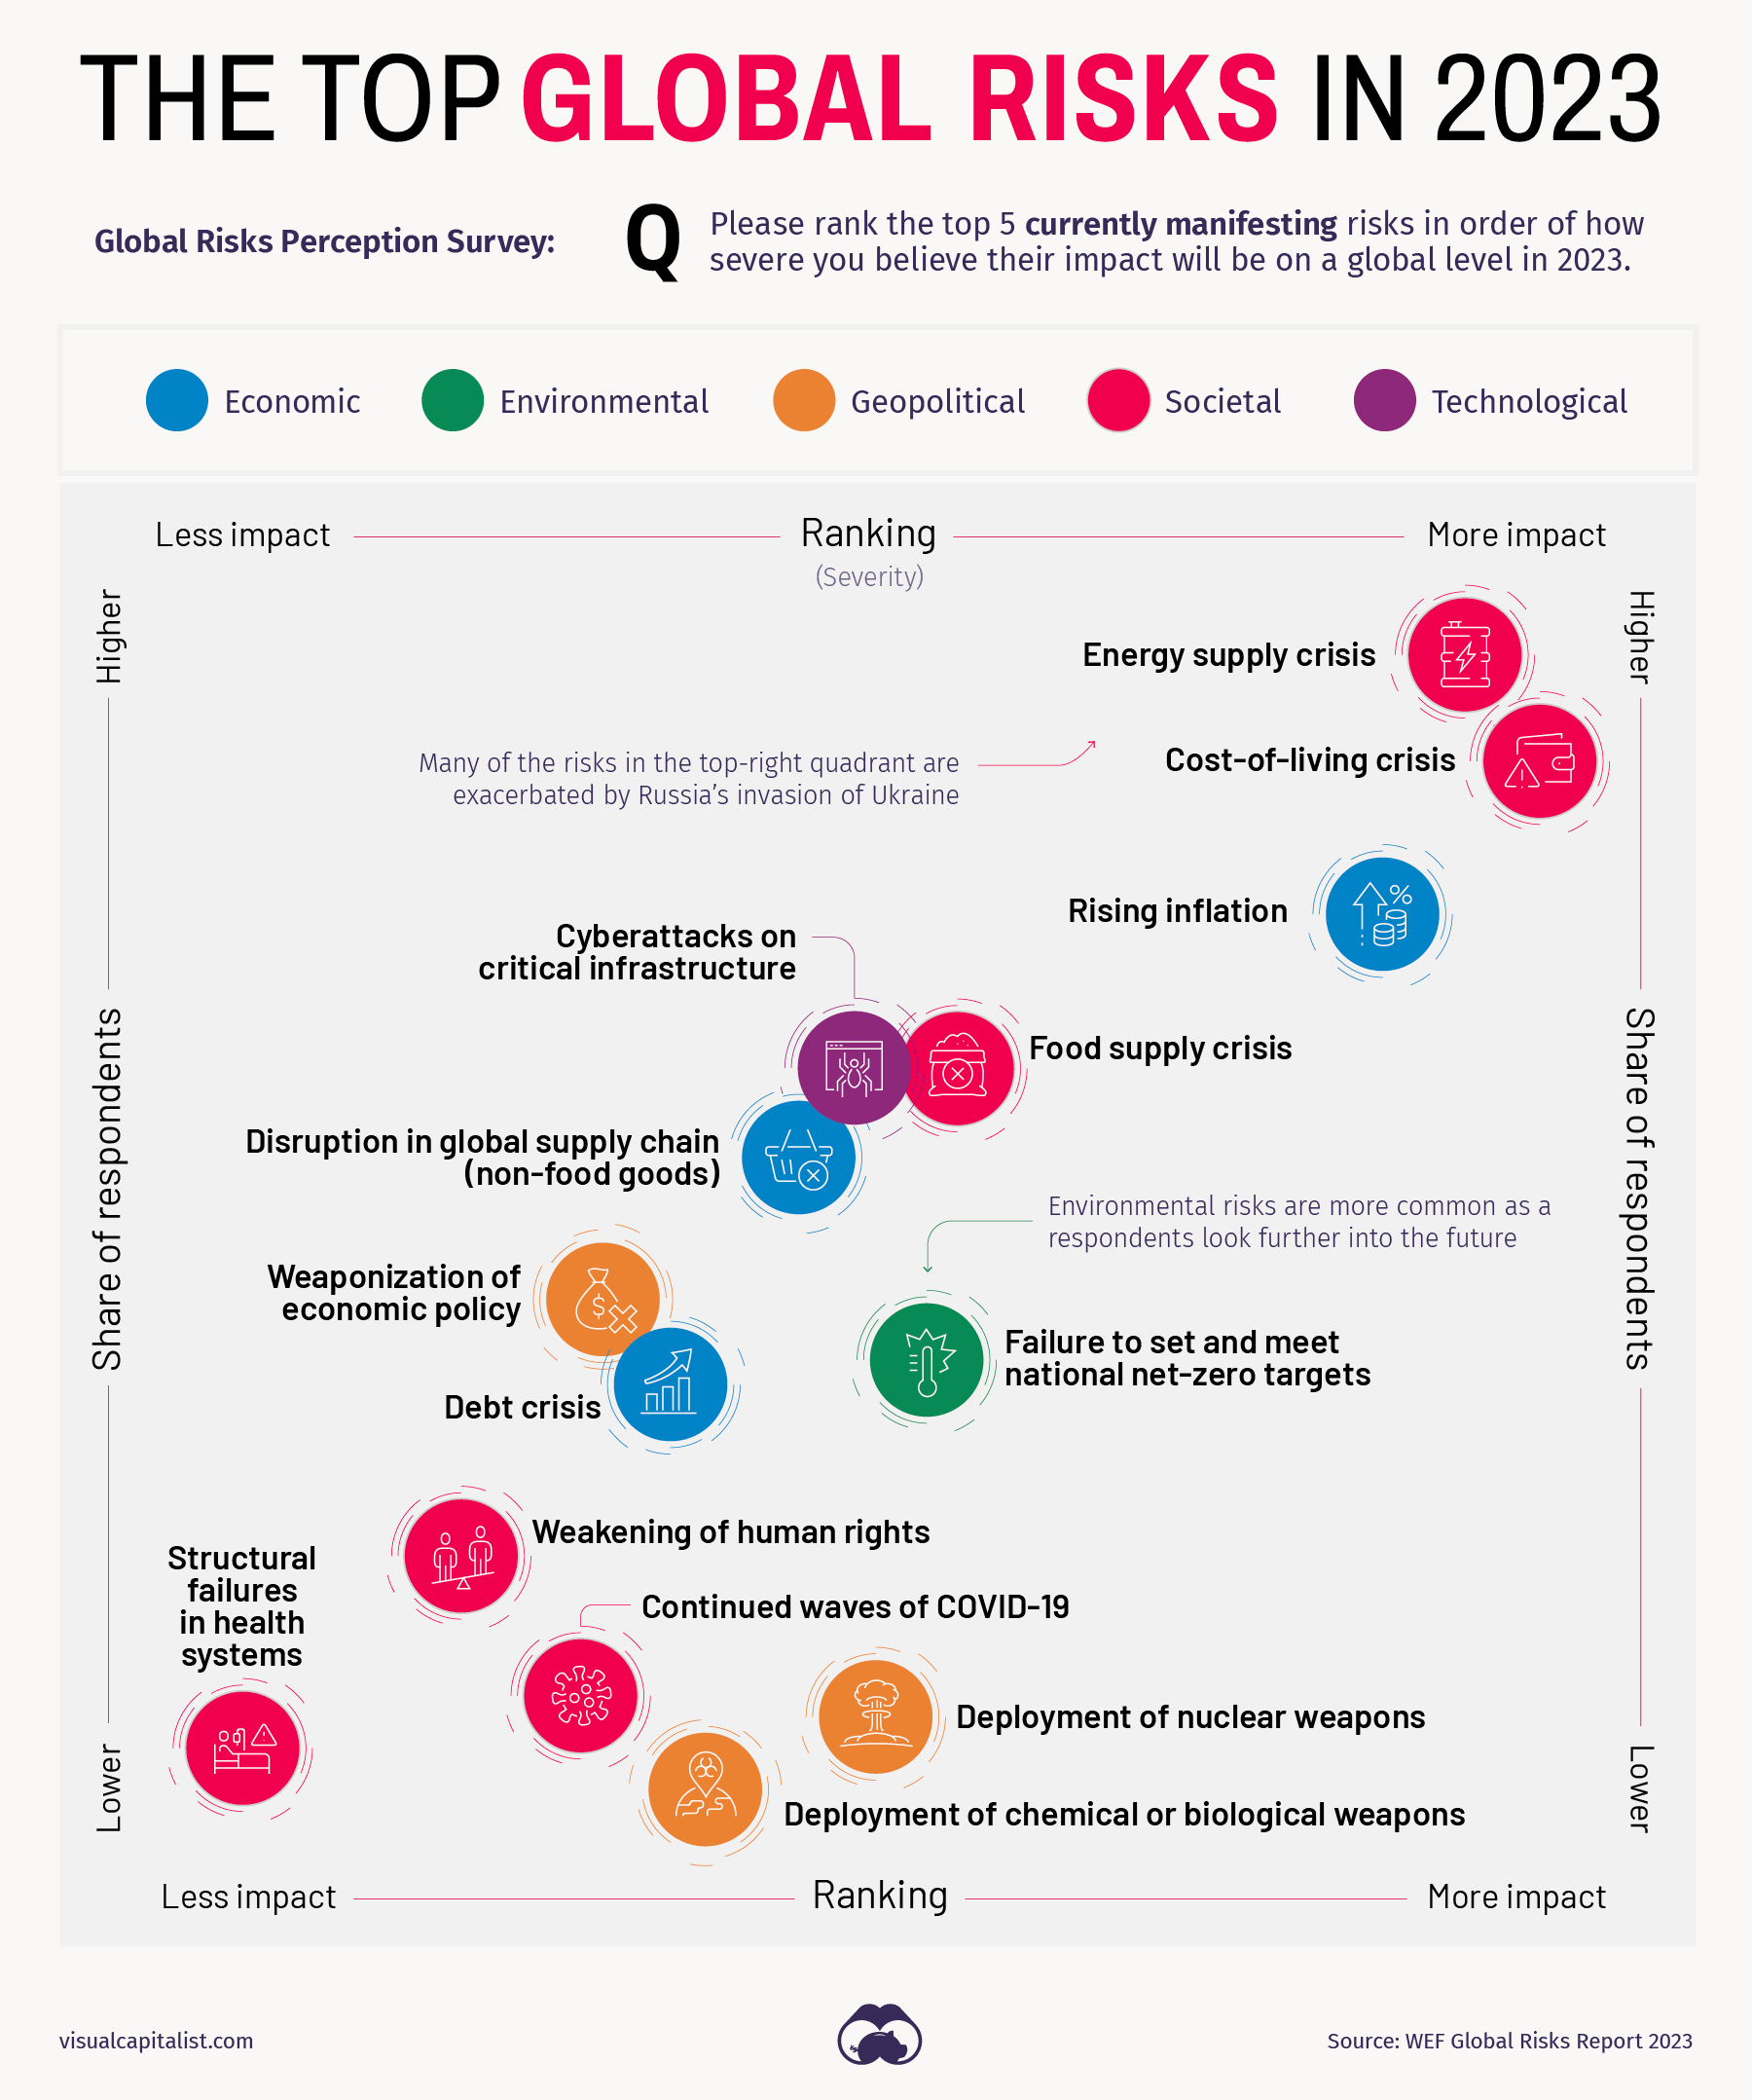
These risks are grouped into five general categories: economic, environmental, geopolitical, societal, and technological.
Let’s dive into this year’s findings.
2023’s Risk Profile
In the lower–middle portion of the chart are the risks that could have serious impacts—such as attacks involving nuclear or biological weapons—but that were highlighted by fewer experts.
Over in the top-right quadrant of the chart are the risks that a number of experts mentioned, and that are causing a strain on society. Not surprisingly, the top risks are related to issues that impact a wide variety of people, such as the rising cost of living and inflation. When staples like food and energy become more expensive, this can fuel unrest and political instability—particularly in countries that already had simmering discontent. WEF points out that increases in fuel prices alone led to protests in an estimated 92 countries.
One risk worth watching is geoeconomic confrontation, which includes sanctions, trade wars, investment screening, and other actions that have the intent of weakening the countries on the receiving end. Efforts to mitigate this risk result in some of the key themes we see for the coming year. One example is the onshoring of industries, and “friend-shoring”, which is essentially moving operations to a foreign country that has more stable relations with one’s home country.
How Prepared Are We?
It’s one thing to be aware of risks, but it’s quite another to have the ability to head off negative events when they come to fruition.
The chart below is a look at how prepared we are globally to deal with specific types of risks that could arise in the next few years.
At the top of the chart are risks that experts feel society is better equipped to handle with current plans and resources. Moving towards the bottom of the chart are risks that experts feel are more of a threat since mechanisms for handling them are weak or non-existent.
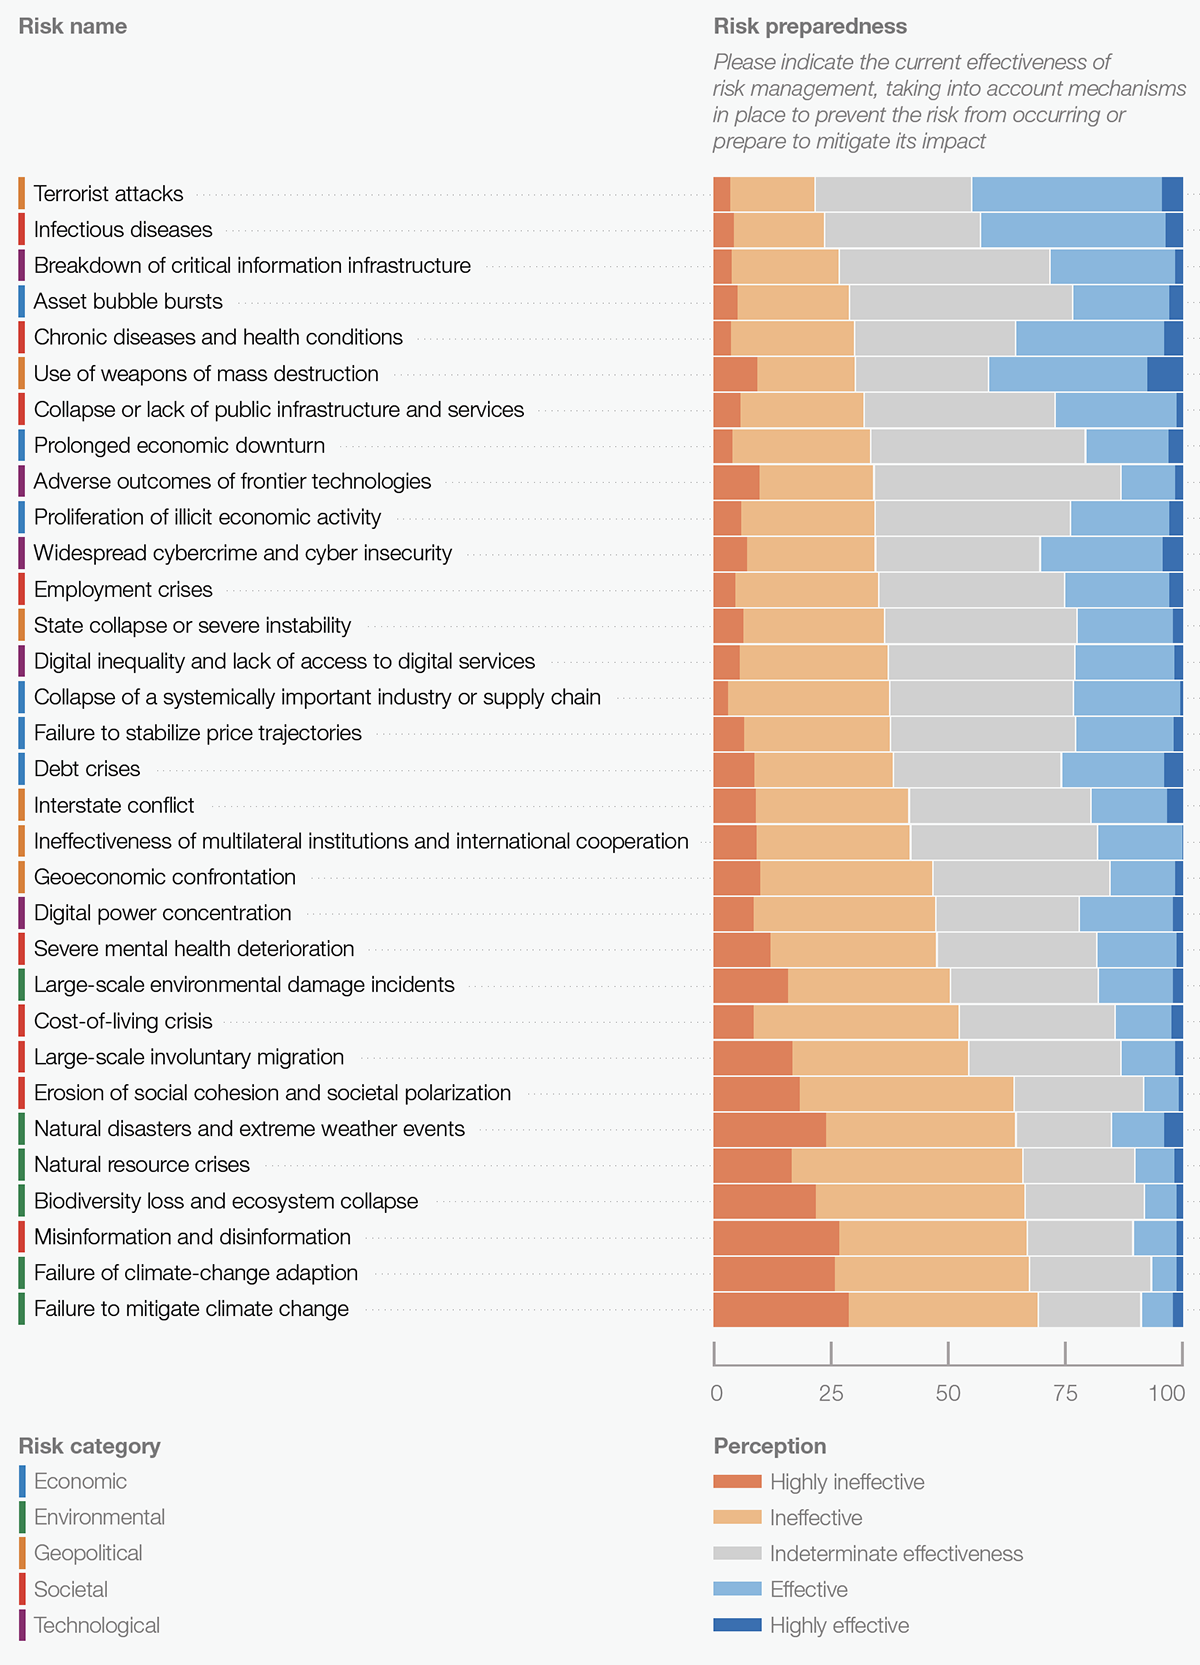
Experts are generally more confident in solutions in the military or healthcare domains. Environmental and societal challenges leave policy and decision-makers less confident.
One telling observation from the data above is that none of the risks left a majority of experts feeling confident in our ability to prevent the risk from occurring, or prepared to mitigate its impact. As the 2020s are shaping up to be a turbulent decade, that could be a cause for concern.
Where does this data come from?
Source: The Global Risks Report 2023, produced by the World Economic Forum (in partnership with Marsh McLennan and Zurich Insurance Group).
Data note: The chart in this article is based on the Global Risks Perception Survey 2022-2023. A list of 32 global risks, along with their definitions, is shown in Table A.1 of the PDF. Page 77 of the report also includes detailed information on sample sizes and demographics of respondents.


Markets
The European Stock Market: Attractive Valuations Offer Opportunities
On average, the European stock market has valuations that are nearly 50% lower than U.S. valuations. But how can you access the market?


European Stock Market: Attractive Valuations Offer Opportunities
Europe is known for some established brands, from L’Oréal to Louis Vuitton. However, the European stock market offers additional opportunities that may be lesser known.
The above infographic, sponsored by STOXX, outlines why investors may want to consider European stocks.
Attractive Valuations
Compared to most North American and Asian markets, European stocks offer lower or comparable valuations.
| Index | Price-to-Earnings Ratio | Price-to-Book Ratio |
|---|---|---|
| EURO STOXX 50 | 14.9 | 2.2 |
| STOXX Europe 600 | 14.4 | 2 |
| U.S. | 25.9 | 4.7 |
| Canada | 16.1 | 1.8 |
| Japan | 15.4 | 1.6 |
| Asia Pacific ex. China | 17.1 | 1.8 |
Data as of February 29, 2024. See graphic for full index names. Ratios based on trailing 12 month financials. The price to earnings ratio excludes companies with negative earnings.
On average, European valuations are nearly 50% lower than U.S. valuations, potentially offering an affordable entry point for investors.
Research also shows that lower price ratios have historically led to higher long-term returns.
Market Movements Not Closely Connected
Over the last decade, the European stock market had low-to-moderate correlation with North American and Asian equities.
The below chart shows correlations from February 2014 to February 2024. A value closer to zero indicates low correlation, while a value of one would indicate that two regions are moving in perfect unison.
| EURO STOXX 50 | STOXX EUROPE 600 | U.S. | Canada | Japan | Asia Pacific ex. China |
|
|---|---|---|---|---|---|---|
| EURO STOXX 50 | 1.00 | 0.97 | 0.55 | 0.67 | 0.24 | 0.43 |
| STOXX EUROPE 600 | 1.00 | 0.56 | 0.71 | 0.28 | 0.48 | |
| U.S. | 1.00 | 0.73 | 0.12 | 0.25 | ||
| Canada | 1.00 | 0.22 | 0.40 | |||
| Japan | 1.00 | 0.88 | ||||
| Asia Pacific ex. China | 1.00 |
Data is based on daily USD returns.
European equities had relatively independent market movements from North American and Asian markets. One contributing factor could be the differing sector weights in each market. For instance, technology makes up a quarter of the U.S. market, but health care and industrials dominate the broader European market.
Ultimately, European equities can enhance portfolio diversification and have the potential to mitigate risk for investors.
Tracking the Market
For investors interested in European equities, STOXX offers a variety of flagship indices:
| Index | Description | Market Cap |
|---|---|---|
| STOXX Europe 600 | Pan-regional, broad market | €10.5T |
| STOXX Developed Europe | Pan-regional, broad-market | €9.9T |
| STOXX Europe 600 ESG-X | Pan-regional, broad market, sustainability focus | €9.7T |
| STOXX Europe 50 | Pan-regional, blue-chip | €5.1T |
| EURO STOXX 50 | Eurozone, blue-chip | €3.5T |
Data is as of February 29, 2024. Market cap is free float, which represents the shares that are readily available for public trading on stock exchanges.
The EURO STOXX 50 tracks the Eurozone’s biggest and most traded companies. It also underlies one of the world’s largest ranges of ETFs and mutual funds. As of November 2023, there were €27.3 billion in ETFs and €23.5B in mutual fund assets under management tracking the index.
“For the past 25 years, the EURO STOXX 50 has served as an accurate, reliable and tradable representation of the Eurozone equity market.”
— Axel Lomholt, General Manager at STOXX
Partnering with STOXX to Track the European Stock Market
Are you interested in European equities? STOXX can be a valuable partner:
- Comprehensive, liquid and investable ecosystem
- European heritage, global reach
- Highly sophisticated customization capabilities
- Open architecture approach to using data
- Close partnerships with clients
- Part of ISS STOXX and Deutsche Börse Group
With a full suite of indices, STOXX can help you benchmark against the European stock market.
Learn how STOXX’s European indices offer liquid and effective market access.

-

 Economy2 days ago
Economic Growth Forecasts for G7 and BRICS Countries in 2024
The IMF has released its economic growth forecasts for 2024. How do the G7 and BRICS countries compare?
-

 Markets1 week ago
U.S. Debt Interest Payments Reach $1 Trillion
U.S. debt interest payments have surged past the $1 trillion dollar mark, amid high interest rates and an ever-expanding debt burden.
-

 United States2 weeks ago
Ranked: The Largest U.S. Corporations by Number of Employees
We visualized the top U.S. companies by employees, revealing the massive scale of retailers like Walmart, Target, and Home Depot.
-

 Markets2 weeks ago
The Top 10 States by Real GDP Growth in 2023
This graphic shows the states with the highest real GDP growth rate in 2023, largely propelled by the oil and gas boom.
-

 Markets2 weeks ago
Ranked: The World’s Top Flight Routes, by Revenue
In this graphic, we show the highest earning flight routes globally as air travel continued to rebound in 2023.
-

 Markets2 weeks ago
Ranked: The Most Valuable Housing Markets in America
The U.S. residential real estate market is worth a staggering $47.5 trillion. Here are the most valuable housing markets in the country.


-

 Energy1 week ago
The World’s Biggest Nuclear Energy Producers
-

 Money2 weeks ago
Which States Have the Highest Minimum Wage in America?
-

 Technology2 weeks ago
Ranked: Semiconductor Companies by Industry Revenue Share
-
Markets2 weeks ago
Ranked: The World’s Top Flight Routes, by Revenue
-

 Demographics2 weeks ago
Population Projections: The World’s 6 Largest Countries in 2075
-
Markets2 weeks ago
The Top 10 States by Real GDP Growth in 2023
-

 Demographics2 weeks ago
The Smallest Gender Wage Gaps in OECD Countries
-

 Economy2 weeks ago
Where U.S. Inflation Hit the Hardest in March 2024