Mining
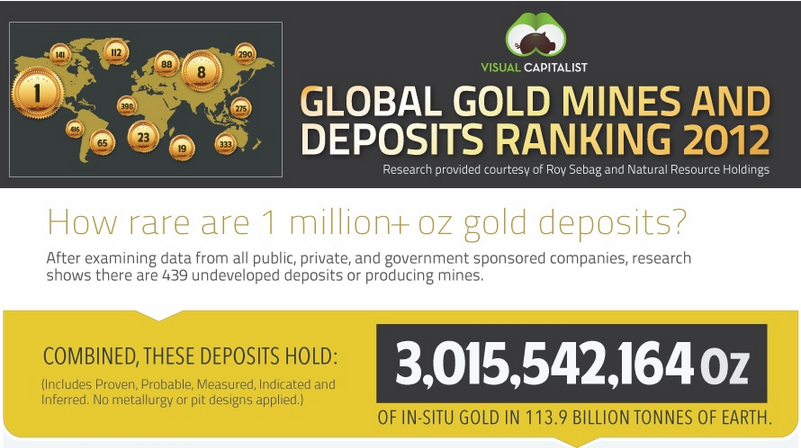
Global Gold Mines and Deposits Ranking 2012


Introduction
Following on the success of last year’s report we have decided to make the ranking of the world’s gold deposits an annual endeavor highlighting trends in future mine supply, depletion, discoveries, and in-situ grades.
As far as we know, there has not been a similar effort to compile a comprehensive database of the world’s gold mines and deposits. Nevertheless, we rose to the laborious challenge as we knew that the industry reliance on risk capital via public markets presented an opportunity to data mine regulatory filings which would result in a high quality database.
With this research our goal was to provide quantitative answers to some of the questions we kept asking ourselves as investors in the space. Questions such as:
How many ounces of in-situ gold exist?
How many gold mines exist in Canada?
How rare is a 1.0 million ounce undeveloped deposit?
The report answers these questions and more while providing insight into the scarcity of mines & deposits. Additionally, having a granular view of the supply mix is useful as it allows market participants to ascertain the long-term supply and demand fundamentals of the metal.
We have made some important changes this year to the methodology of the database adding grade, tonnage, and government owned mines/deposits. We also partnered with Visual Capitalists, an investor website that provides rich visual content, to assist in visualizing the data we compiled. The report is free for usage and distribution with acknowledgment of the author.
Sincerely,
Roy Sebag
Changes to Methodology
This year we implemented some important changes to our methodology leading to a higher quality database that is more comprehensive:
A) Introduction of Grade and Tonnage in grams per tonne providing a more qualitative analysis of each respective deposit.
B) The inclusion of Government owned deposits such as Murantao and Sukhoi Log.
C) The inclusion of South African mines and deposits.
D) The inclusion of Australian listed companies as well as Polyus, Anglogold Ashanti and Newcrest, companies that are harder to compile due to the opacity of their mineral resource disclosure.
While we still have serious reservations relating to what portion of delineated resources can actually be extracted in the South African deposits we felt that they warranted inclusion in order to provide readers with an all-encompassing database. That same logic led us to include government owned mines even though we are somewhat skeptical of their reported grades and often relied on an outdated technical report.
Methodology
We started with a list of 1,892 publicly traded companies that are in some way involved in gold production, exploration, or development of over 7,000 geologic anomalies. Our goal was to find an undeveloped gold deposit or producing mine that hosted over 1 million troy ounces of in-situ resources under a globally respected mineral definition standard such as CIM NI 43-101, JORC, or SAMREC.
In an effort to provide the most comprehensive database and due to the fact that every proven or probable ounce starts of as inferred, we aggregate all resource categories into one figure (refer to last year’s report for a discussion relating to aggregating all resource categories). Where there are reserves and resources we will most likely use the inclusive resource figure. When a cutoff grade is recommended by a geological consultancy we will rely on that cutoff grade unless the report was outdated and we felt a lower cutoff grade was warranted. It is important to stress that resources are not necessarily indicative of future mine supply given that metallurgical recovery rates and economic pit outlines are not applied. In the “Potential Mine Supply Exercise” section we discuss this further.
When it came to copper/gold porphyries it was difficult to draw the line as to what was a gold deposit vs. a copper deposit. In this year’s report we included deposits such as Reko Diq and Galore Creek because we felt their global contained ounces were too large to disregard even though they are primarily copper deposits.
2012 Result Summary
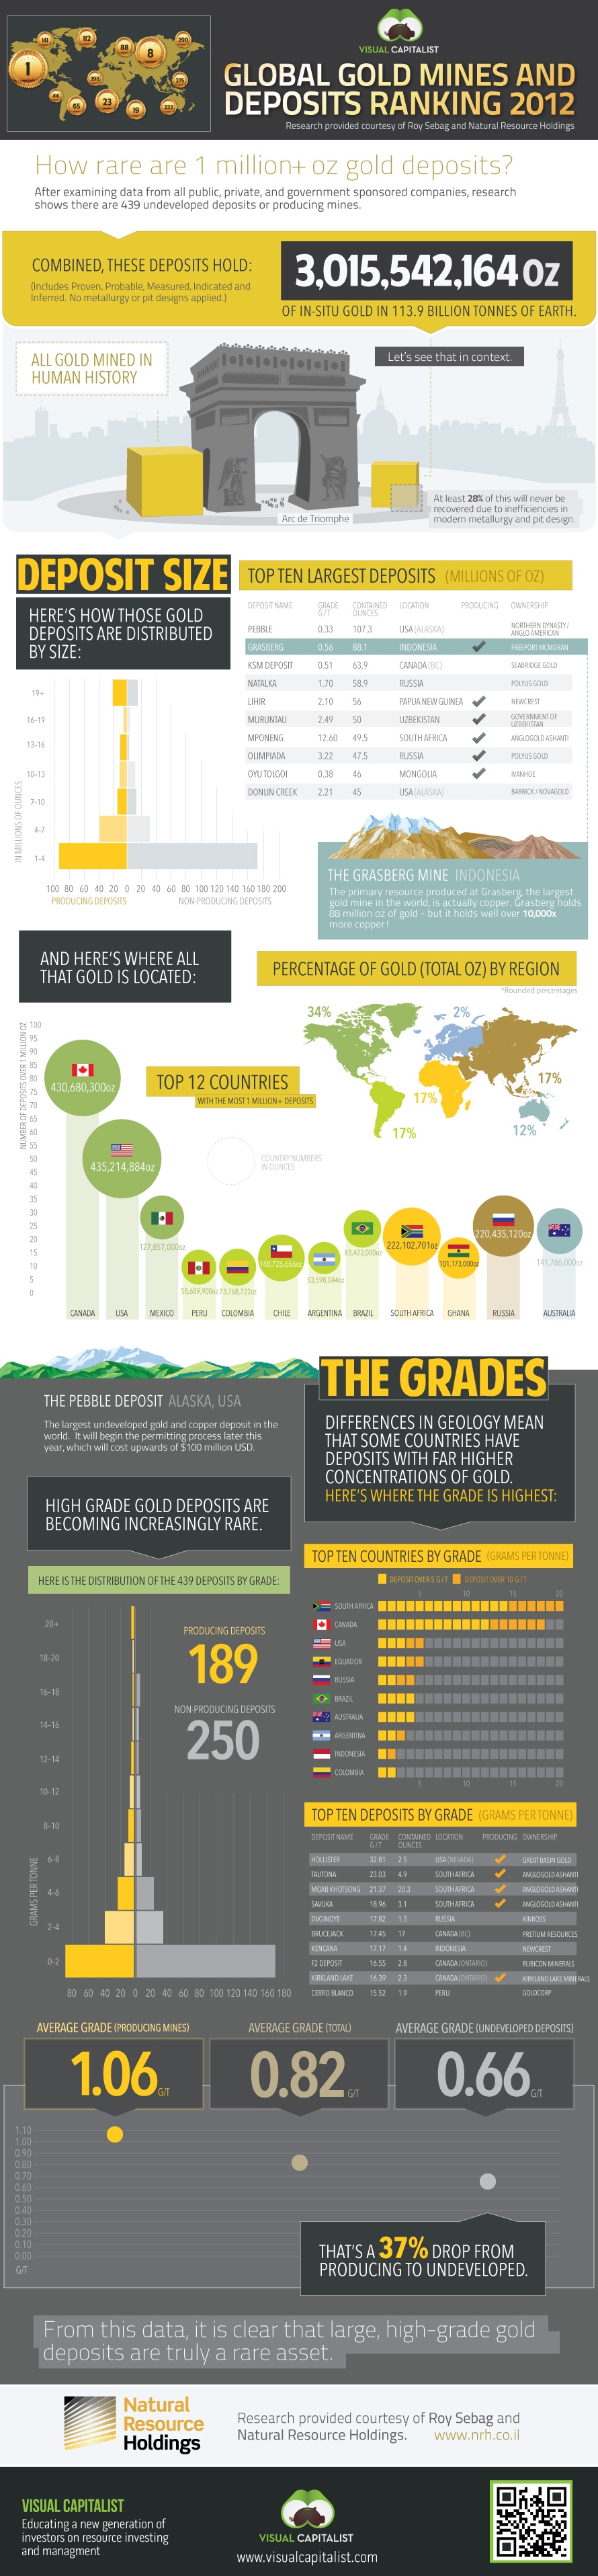
From an initial list of 1,896 companies we were able to identify 212 entities (Public, Private and Government Sponsored Corporations) that own 439 gold deposits hosting over 1,000,000 ounces in all categories representing a total of 3,015,542,164 ounces of gold. The complete list can be found at the end of this report.
Summary of Findings:
Total Mines & Deposits in over 1 million ounces in-situ: 439
Total In-Situ Ounces: 3,015,542,164 Total Tonnage & Grade of Database: 113.9 Billion Tonnes @ .82 g/t
Total In-Situ Ounces & Avg. Grade Producing Mines: 1,556,265,676 oz. @ 1.06 g/t
Total In-Situ Ounces & Avg. Grade Undeveloped Deposits: 1,459,276,488 oz. @ .66 g/t
Global In-SITU Ranking
Mines & Deposits over 3 million Oz: 228 Mines & Deposits over 5 million Oz: 148
Mines & Deposits over 10 million Oz: 74 Mines & Deposits over 20 million Oz: 33
Producing Mines over 3 Million Oz: 120 Undeveloped Deposits over 3 Million Oz: 108
Producing Mines over 5 million Oz: 82 Undeveloped Deposits over 5 million Oz: 66
Producing Mines over 10 million Oz: 43 Undeveloped Deposits over 10 million Oz: 31
HIGH GRADE GOLD SUMMARY
Mines & Deposits over 1mm oz and 3 g/t: 136 Mines & Deposits over 1mm oz and 5 g/t: 81
Mines & Deposits over 1mm oz and 10 g/t: 26 Mines & Deposits over 1mm oz and 15 g/t: 11
Producing Mines over 1mm oz and 3 g/t: 76 Undeveloped Deposits over 1mm oz and 3 g/t: 60
Producing Mines over 1mm oz and 5 g/t: 49 Undeveloped Deposits over 1mm oz and 5 g/t: 32
Producing Mines over 1mm oz and 10 g/t: 14 Undeveloped Deposits over 1mm oz and 10 g/t: 12
For full results and tables of deposits, view the full report PDF.
2012 Results Discussion
This year’s results confirmed both the scarcity of gold deposits as well as the lower-grade production trends facing the industry. Even with our generous thresholds allowing inferred resources to be included in the database, we were able to identify only 439 mines or deposits containing over 1 million ounces of gold.
In our view a mine or deposit is an asset no different than a farm, commercial property, or financial security. Yet when it comes to gold, there are only 439 assets that meet the industry perceived economic threshold of 1 million ounces. Last year, we compared this figure to the tens of thousands of commercial real estate properties in the world or the nearly 72,000 financial securities. While the crustal abundance of gold is fixed, and discovery grades continue to decline, there is no limit to the creation of financial securities and plenty of land and building materials to construct more property. Simply put, a gold mine or deposit with over 1 million ounces is a very rare asset. This is especially true when viewing the geographical distribution of the mines & deposits:
Independently Owned Undeveloped Deposits
Another data point we found fascinating was that out of 439 mines or deposits, 189 are in fact producing mines owned by companies with an average market capitalization of $1.8 Billion. This leaves us with a universe of undeveloped deposits over 1 million ounces of just 250. Of course some of these 250 deposits are owned by miners (84) while just 166 are owned by independent junior companies, private companies, or government sponsored enterprises. Investors seeking leverage to gold should focus on these companies as they provide the best exposure to a rising gold price environment. We have attached a table with these deposits and companies at the end of the report titled “Undeveloped Deposits over 1mm oz owned by Independent Juniors”.
It is interesting to note that in Canada we were able to find only 59 undeveloped deposits over 1mm ounces owned by 49 companies (41 Independents). In the United States we found only 33 deposits owned by 26 companies (23 Independents).
Internally, the purpose of this report was to identify potential short-comings in the theories employed by leading thinkers in the gold industry. After reviewing nearly 2,000 companies in the space we can objectively say that are no such red flags. Annual discoveries in 2011 lacked the gravitas required to move the needle on the aggregate in-situ figures after incorporating depletion. This was surprising to as historically high gold prices have provided nearly unprecedented capital to gold exploration companies and we had assumed that after tallying up the year’s discoveries there would be a significant nominal gain in ounces. Another important data point was observed with regards to the grade of producing mines vs. undeveloped deposits with grades for undeveloped deposits being markedly lower (37%) guaranteeing the need for higher energy input in the future only to sustain current production figures.
Another caveat with the undeveloped deposits in the database is that some of the largest ones face significant permitting headwinds. Pebble, Reko Diq, Donlin, KSM, and Rosia Montana which represent nearly 20% of the undeveloped ounces in the database may not become mines for 10,20 and even 30 years.
Quality Deposits are Rare
While this report and the accompanying database provide an accurate view of global mine supply, there are crucial qualitative metrics still missing. Even high grade deposits with no infrastructure are inferior to easily mined bulk tonnage deposits with close proximity to infrastructure in stable geopolitical jurisdictions.
Looking at the matrix of undeveloped deposits, one can see why size and even grade are not the most important attributes when predicting which deposit will become a mine. Let us compare Cerro Cassale in Chile with 32.5mm ounces to Titiribi in Colombia with 11.1mm ounces (and continues to grow). While Cerro Cassale is nearly three times the size, its remote location in the Maricunga desert has forced Barrick to budget over $500mm for a120km water pipeline. Titiribi, owned by independent junior Sunward Resources, is located on a paved road with both water and power running directly to the site. While it is too early to estimate CAPEX for Titiribi, it is not farfetched to assume that for the amount Barrick will be spending transporting water from point A to point B, Titiribi will be producing a few hundred thousand ounces of gold per annum.
In conclusion, we would like to stress that while this database serves as an effective starting point we urge investors to incorporate additional metrics such as geopolitical risk, permitting challenges, and most importantly infrastructure when ranking deposits for investment.
Global Mine Supply Exercise
In this section we will attempt to make sense of the 3,015,542,164 ounce (93,796 tonnes) figure which is the sum of all in-situ ounces in the database. As we previously explained this figure is inaccurate as it relates to potentially mined ounces in the future due to the following factors:
1) Inclusion of inferred resources in global contained ounces.
2) Not applying any economic pit outlines.
3) Not applying any metallurgical recovery rates.
4) The inclusion of undeveloped deposits with no clear path towards permitting.
In order to project an accurate figure we will adjust the 3,015,542,164 ounce number through an exercise that incorporates metallurgical recovery rates, economic pit outlines, and physical constraints that come with moving the billions of tonnes that host these ounces.
First, we will apply a metallurgical recovery rate. Industry averages tend to be 70-90% depending on the type of mineralization. Casting a wide net, we will use 80% as our metallurgical recovery rate. Following this step we are left with 2,412,433,133 ounces.
Next, we will apply economic pit outlines to the resource figure. Once again in an effort to include the most possible ounces we will apply only a 10% reduction for potential pit outlines. Given the amount of inferred ounces in our database this is a very generous figure. Following this step we are left with 2,171,190,358 ounces or 67,533 tonnes.
Next, we will estimate the physical constraints required to mine the remaining ounces. As these ounces exist within 81 billion tonnes of ore (49 billion tonnes for undeveloped deposits containing 1.05 billion ounces after applying economic pit outlines and metallurgical recoveries) they cannot be immediately extracted from the earth’s crust.
As we are estimating future potential supply, the 189 producing mines are less important given their production is already factored in the existing supply mix. A more relevant exercise is one projecting future supply from undeveloped deposits as only they could meaningfully disrupt the supply & demand fundamentals.
Let us assume for a moment that all 250 undeveloped deposits were somehow permitted and financed tomorrow. With 49 billion tonnes to mine at an average grade of .66 g/t it would take no less than 25 years to extract the 1,050,000,000 ounces contained within these deposits. Arriving at this figure, we assume that the average build time would be 3 years and the average mill size would be 25,000 tonnes per day.
Even with our unrealistic scenario introducing all 250 undeveloped deposits into the supply mix at once, we can only quantify an increase of roughly 42mm ounces of gold production or 1,306 tonnes per annum. Compare that to current gold production of roughly 2,800 tonnes or 90mm ounces per annum.
Realistically, 50% or more of the deposits in the database will most likely remain deposits 25 years from now for a variety of factors including: permitting, ability to finance a mine, and attractiveness to a producer (producer balance sheets are so large they require significant projects to be accretive , making even most 1mm-2mm ounce deposits unattractive).
Consequently, the guaranteed depletion in the existing production mix coupled with a more realistic introduction of new mines into the mix (as opposed to our theoretical tomorrow scenario) makes it clear that barring multiple high-grade, multi-million ounce discoveries each year, a significant increase in gold production is unlikely. Moreover our back of the envelope calculations point towards gold production peaking at some point between 2022 and 2025 assuming the 90mm ounce per year figure is maintained.


Lithium
Ranked: The Top 10 EV Battery Manufacturers in 2023
Asia dominates this ranking of the world’s largest EV battery manufacturers in 2023.


The Top 10 EV Battery Manufacturers in 2023
This was originally posted on our Voronoi app. Download the app for free on iOS or Android and discover incredible data-driven charts from a variety of trusted sources.
Despite efforts from the U.S. and EU to secure local domestic supply, all major EV battery manufacturers remain based in Asia.
In this graphic we rank the top 10 EV battery manufacturers by total battery deployment (measured in megawatt-hours) in 2023. The data is from EV Volumes.
Chinese Dominance
Contemporary Amperex Technology Co. Limited (CATL) has swiftly risen in less than a decade to claim the title of the largest global battery group.
The Chinese company now has a 34% share of the market and supplies batteries to a range of made-in-China vehicles, including the Tesla Model Y, SAIC’s MG4/Mulan, and various Li Auto models.
| Company | Country | 2023 Production (megawatt-hour) | Share of Total Production |
|---|---|---|---|
| CATL | 🇨🇳 China | 242,700 | 34% |
| BYD | 🇨🇳 China | 115,917 | 16% |
| LG Energy Solution | 🇰🇷 Korea | 108,487 | 15% |
| Panasonic | 🇯🇵 Japan | 56,560 | 8% |
| SK On | 🇰🇷 Korea | 40,711 | 6% |
| Samsung SDI | 🇰🇷 Korea | 35,703 | 5% |
| CALB | 🇨🇳 China | 23,493 | 3% |
| Farasis Energy | 🇨🇳 China | 16,527 | 2% |
| Envision AESC | 🇨🇳 China | 8,342 | 1% |
| Sunwoda | 🇨🇳 China | 6,979 | 1% |
| Other | - | 56,040 | 8% |
In 2023, BYD surpassed LG Energy Solution to claim second place. This was driven by demand from its own models and growth in third-party deals, including providing batteries for the made-in-Germany Tesla Model Y, Toyota bZ3, Changan UNI-V, Venucia V-Online, as well as several Haval and FAW models.
The top three battery makers (CATL, BYD, LG) collectively account for two-thirds (66%) of total battery deployment.
Once a leader in the EV battery business, Panasonic now holds the fourth position with an 8% market share, down from 9% last year. With its main client, Tesla, now sourcing batteries from multiple suppliers, the Japanese battery maker seems to be losing its competitive edge in the industry.
Overall, the global EV battery market size is projected to grow from $49 billion in 2022 to $98 billion by 2029, according to Fortune Business Insights.

-

 Debt1 week ago
How Debt-to-GDP Ratios Have Changed Since 2000
-

 Markets2 weeks ago
Ranked: The World’s Top Flight Routes, by Revenue
-

 Countries2 weeks ago
Population Projections: The World’s 6 Largest Countries in 2075
-

 Markets2 weeks ago
The Top 10 States by Real GDP Growth in 2023
-

 Demographics2 weeks ago
The Smallest Gender Wage Gaps in OECD Countries
-

 United States2 weeks ago
Where U.S. Inflation Hit the Hardest in March 2024
-

 Green2 weeks ago
Top Countries By Forest Growth Since 2001
-

 United States2 weeks ago
Ranked: The Largest U.S. Corporations by Number of Employees