Markets
Visualizing the State of Global Debt, by Country
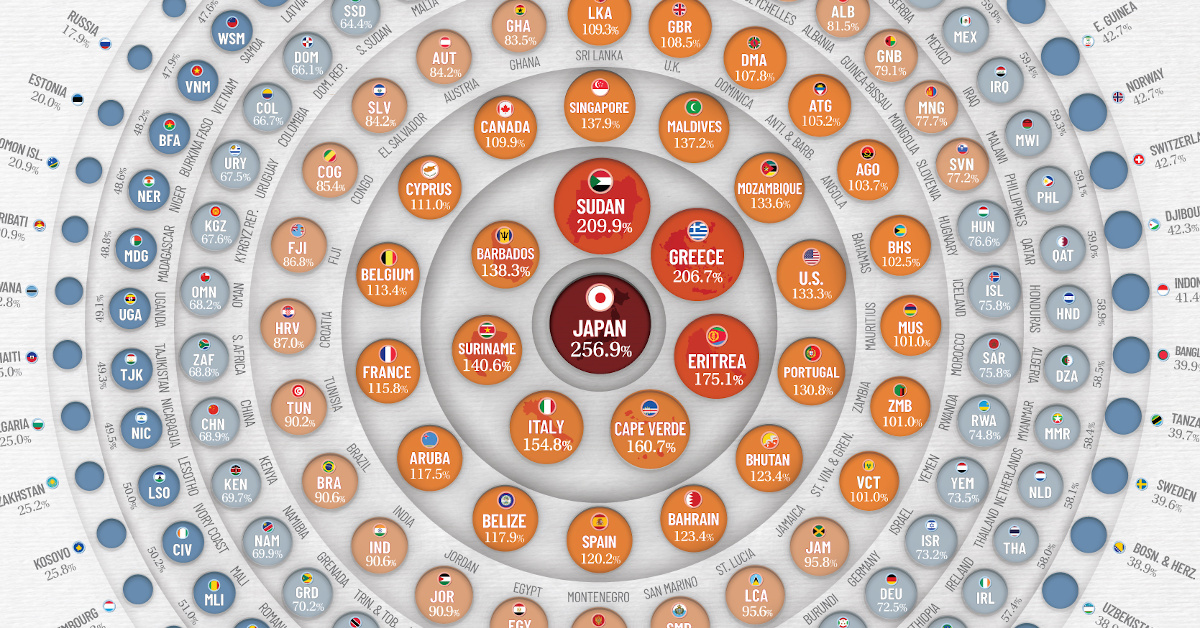
View the expanded version of this infographic to see all countries.
View the expanded version of this infographic to see all countries.


Visualizing the State of Global Debt, by Country
Since COVID-19 started its spread around the world in 2020, the global economy has been put to the test with supply chain disruptions, price volatility for commodities, challenges in the job market, and declining income from tourism. The World Bank has estimated that almost 97 million people have been pushed into extreme poverty as a result of the pandemic.
In order to help with this difficult situation, global governments have had to increase their expenditures to deal with higher healthcare costs, unemployment, food insecurity, and to help businesses to survive. Countries have taken on new debt to provide financial support for these measures, which has resulted in the highest global debt levels in half a century.
To analyze the extent of global debt, we’ve compiled debt-to-GDP data by country from the most recent World Economic Outlook report by the IMF.
Global Debt by Country: The Top 10 Most Indebted Nations
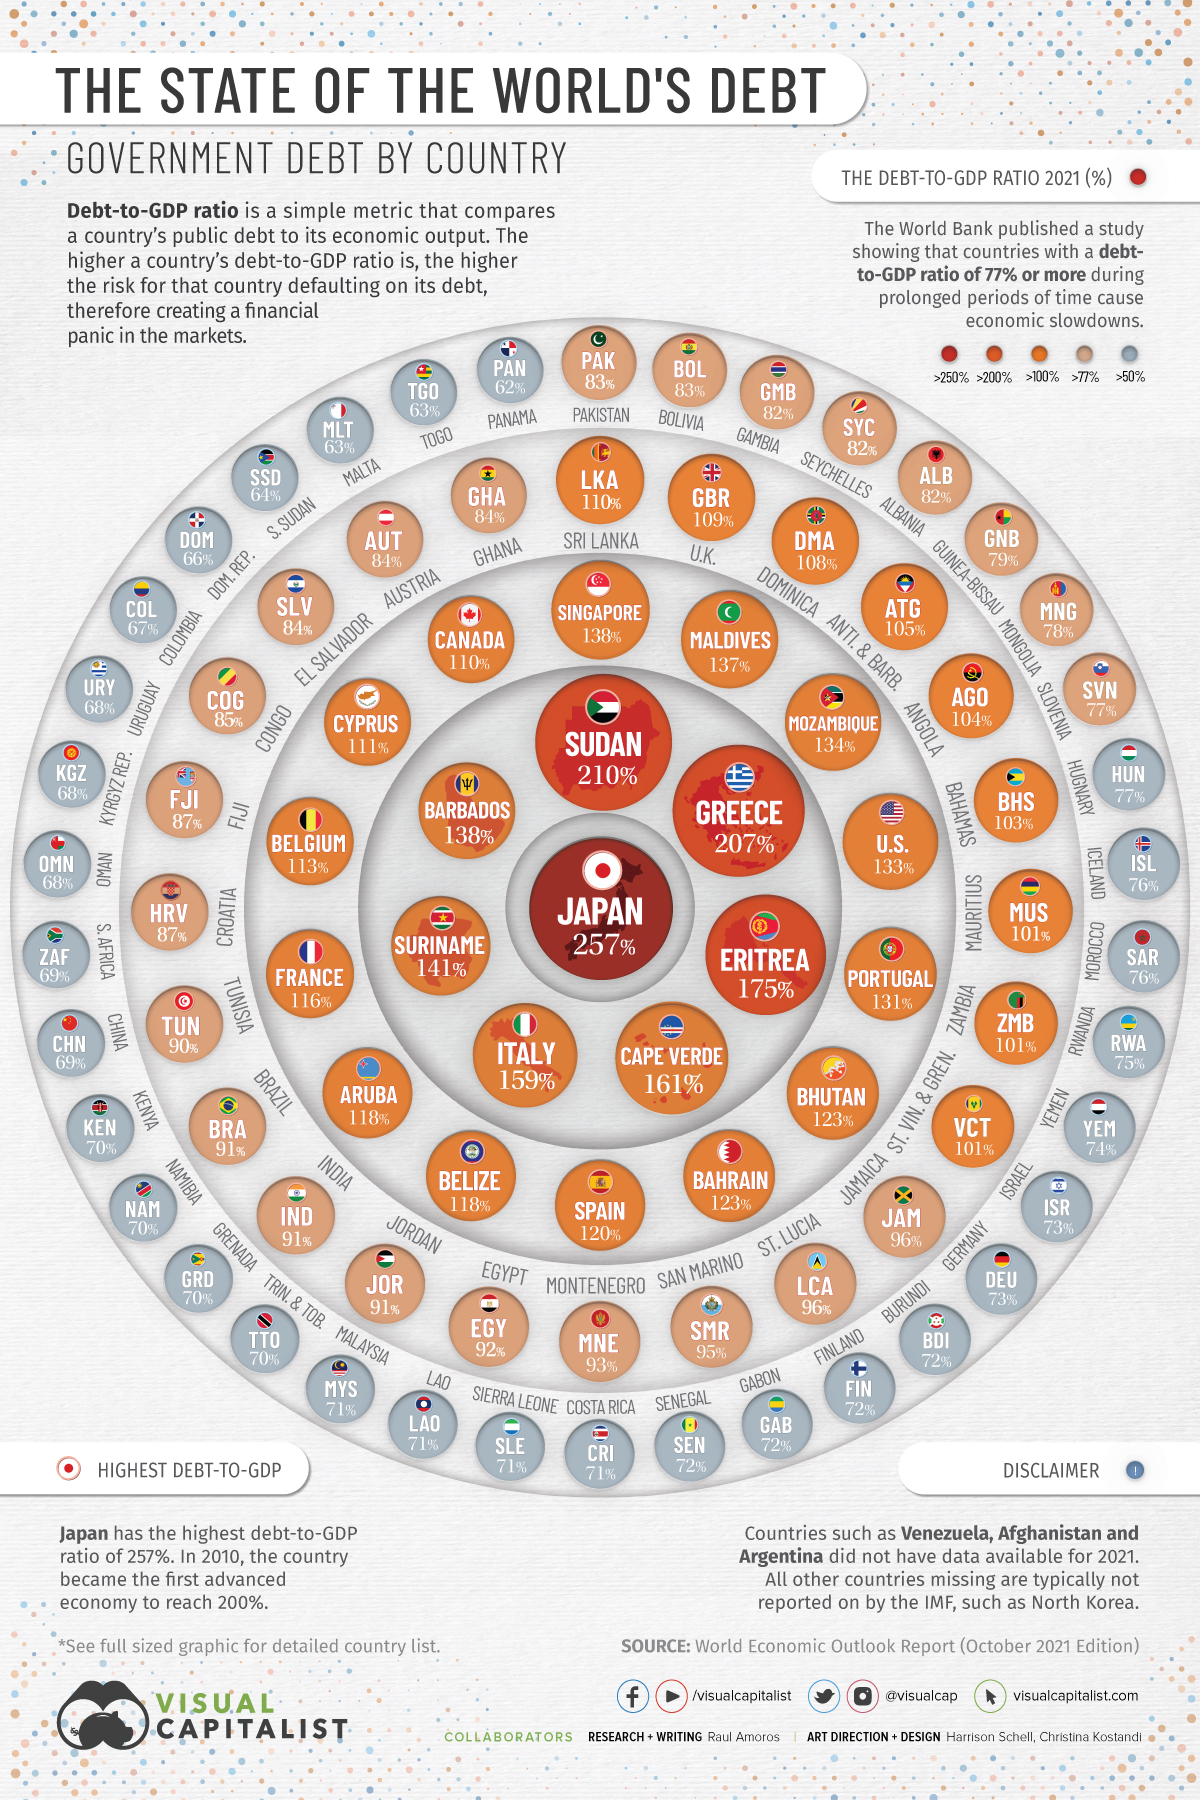
The debt-to-GDP ratio is a simple metric that compares a country’s public debt to its economic output. By comparing how much a country owes and how much it produces in a year, economists can measure a country’s theoretical ability to pay off its debt.
Let’s take a look at the top 10 countries in terms of debt-to-GDP:
| Rank | Country | Debt-to-GDP (2021) |
|---|---|---|
| #1 | Japan 🇯🇵 | 257% |
| #2 | Sudan 🇸🇩 | 210% |
| #3 | Greece 🇬🇷 | 207% |
| #4 | Eritrea 🇪🇷 | 175% |
| #5 | Cape Verde 🇨🇻 | 161% |
| #6 | Italy 🇮🇹 | 155% |
| #7 | Suriname 🇸🇷 | 141% |
| #8 | Barbados 🇧🇧 | 138% |
| #9 | Singapore 🇸🇬 | 138% |
| #10 | Maldives 🇲🇻 | 137% |
Source: World Economic Outlook Report (October 2021 Edition)
Japan, Sudan, and Greece top the list with debt-to-GDP ratios well above 200%, followed by Eritrea (175%), Cape Verde (160%), and Italy (154%).
Japan’s debt level won’t come as a surprise to most. In 2010, it became the first country to reach a debt-to-GDP ratio 200%, and it now sits at 257%. In order to finance new debt, the Japanese government issues bonds which get bought up primarily by the Bank of Japan.
By the end of 2020, the Bank of Japan owned 45% of government debt outstanding.
What is the main risk of a high debt-to-GDP ratio?
A rapid increase in government debt is a major cause for concern. Generally, the higher a country’s debt-to-GDP ratio is, the higher chance that country could default on its debt, therefore creating a financial panic in the markets.
The World Bank published a study showing that countries that maintained a debt-to-GDP ratio of over 77% for prolonged periods of time experienced economic slowdowns.
COVID-19 has worsened a debt crisis that has been brewing since the 2008 global recession. A report from the International Monetary Fund (IMF) shows that at least 100 countries will have to reduce expenditures on health, education, and social protection. Also, 30 countries in the developing world have high levels of debt distress, meaning they’re experiencing great difficulties in servicing their debt.
This crisis is hitting poor and middle-income countries harder than rich countries. Wealthier countries are borrowing to launch fiscal stimulus packages while low and middle income countries cannot afford such measures, potentially resulting in wider global inequality.
The IMF Warns of Interest Rates
Global debt reached $226 trillion by the end of 2020, seeing the biggest one-year increase since World War II.
Borrowing by governments accounted for slightly over half of the $28 trillion increase, bringing global public debt ratio to a record of 99% of GDP. As interest rates rise, IMF officials warn that higher interest rates will diminish the impact of fiscal spending, and cause debt sustainability concerns to intensify. “The risks will be magnified if global interest rates rise faster than expected and growth falters,” the officials wrote.
“A significant tightening of financial conditions would heighten the pressure on the most highly indebted governments, households, and firms. If the public and private sectors are forced to deleverage simultaneously, growth prospects will suffer.”
Editor’s note: All data used in our visualization was extracted from the World Economic Outlook Report (October 2021 Edition) and The World Bank. We will update this data when the new report is available in April 2022.


Markets
The European Stock Market: Attractive Valuations Offer Opportunities
On average, the European stock market has valuations that are nearly 50% lower than U.S. valuations. But how can you access the market?


European Stock Market: Attractive Valuations Offer Opportunities
Europe is known for some established brands, from L’Oréal to Louis Vuitton. However, the European stock market offers additional opportunities that may be lesser known.
The above infographic, sponsored by STOXX, outlines why investors may want to consider European stocks.
Attractive Valuations
Compared to most North American and Asian markets, European stocks offer lower or comparable valuations.
| Index | Price-to-Earnings Ratio | Price-to-Book Ratio |
|---|---|---|
| EURO STOXX 50 | 14.9 | 2.2 |
| STOXX Europe 600 | 14.4 | 2 |
| U.S. | 25.9 | 4.7 |
| Canada | 16.1 | 1.8 |
| Japan | 15.4 | 1.6 |
| Asia Pacific ex. China | 17.1 | 1.8 |
Data as of February 29, 2024. See graphic for full index names. Ratios based on trailing 12 month financials. The price to earnings ratio excludes companies with negative earnings.
On average, European valuations are nearly 50% lower than U.S. valuations, potentially offering an affordable entry point for investors.
Research also shows that lower price ratios have historically led to higher long-term returns.
Market Movements Not Closely Connected
Over the last decade, the European stock market had low-to-moderate correlation with North American and Asian equities.
The below chart shows correlations from February 2014 to February 2024. A value closer to zero indicates low correlation, while a value of one would indicate that two regions are moving in perfect unison.
| EURO STOXX 50 | STOXX EUROPE 600 | U.S. | Canada | Japan | Asia Pacific ex. China |
|
|---|---|---|---|---|---|---|
| EURO STOXX 50 | 1.00 | 0.97 | 0.55 | 0.67 | 0.24 | 0.43 |
| STOXX EUROPE 600 | 1.00 | 0.56 | 0.71 | 0.28 | 0.48 | |
| U.S. | 1.00 | 0.73 | 0.12 | 0.25 | ||
| Canada | 1.00 | 0.22 | 0.40 | |||
| Japan | 1.00 | 0.88 | ||||
| Asia Pacific ex. China | 1.00 |
Data is based on daily USD returns.
European equities had relatively independent market movements from North American and Asian markets. One contributing factor could be the differing sector weights in each market. For instance, technology makes up a quarter of the U.S. market, but health care and industrials dominate the broader European market.
Ultimately, European equities can enhance portfolio diversification and have the potential to mitigate risk for investors.
Tracking the Market
For investors interested in European equities, STOXX offers a variety of flagship indices:
| Index | Description | Market Cap |
|---|---|---|
| STOXX Europe 600 | Pan-regional, broad market | €10.5T |
| STOXX Developed Europe | Pan-regional, broad-market | €9.9T |
| STOXX Europe 600 ESG-X | Pan-regional, broad market, sustainability focus | €9.7T |
| STOXX Europe 50 | Pan-regional, blue-chip | €5.1T |
| EURO STOXX 50 | Eurozone, blue-chip | €3.5T |
Data is as of February 29, 2024. Market cap is free float, which represents the shares that are readily available for public trading on stock exchanges.
The EURO STOXX 50 tracks the Eurozone’s biggest and most traded companies. It also underlies one of the world’s largest ranges of ETFs and mutual funds. As of November 2023, there were €27.3 billion in ETFs and €23.5B in mutual fund assets under management tracking the index.
“For the past 25 years, the EURO STOXX 50 has served as an accurate, reliable and tradable representation of the Eurozone equity market.”
— Axel Lomholt, General Manager at STOXX
Partnering with STOXX to Track the European Stock Market
Are you interested in European equities? STOXX can be a valuable partner:
- Comprehensive, liquid and investable ecosystem
- European heritage, global reach
- Highly sophisticated customization capabilities
- Open architecture approach to using data
- Close partnerships with clients
- Part of ISS STOXX and Deutsche Börse Group
With a full suite of indices, STOXX can help you benchmark against the European stock market.
Learn how STOXX’s European indices offer liquid and effective market access.

-

 Economy1 day ago
Economic Growth Forecasts for G7 and BRICS Countries in 2024
The IMF has released its economic growth forecasts for 2024. How do the G7 and BRICS countries compare?
-

 Markets1 week ago
U.S. Debt Interest Payments Reach $1 Trillion
U.S. debt interest payments have surged past the $1 trillion dollar mark, amid high interest rates and an ever-expanding debt burden.
-

 United States1 week ago
Ranked: The Largest U.S. Corporations by Number of Employees
We visualized the top U.S. companies by employees, revealing the massive scale of retailers like Walmart, Target, and Home Depot.
-

 Markets2 weeks ago
The Top 10 States by Real GDP Growth in 2023
This graphic shows the states with the highest real GDP growth rate in 2023, largely propelled by the oil and gas boom.
-

 Markets2 weeks ago
Ranked: The World’s Top Flight Routes, by Revenue
In this graphic, we show the highest earning flight routes globally as air travel continued to rebound in 2023.
-

 Markets2 weeks ago
Ranked: The Most Valuable Housing Markets in America
The U.S. residential real estate market is worth a staggering $47.5 trillion. Here are the most valuable housing markets in the country.


-

 Mining1 week ago
Gold vs. S&P 500: Which Has Grown More Over Five Years?
-
Markets2 weeks ago
Ranked: The Most Valuable Housing Markets in America
-

 Money2 weeks ago
Which States Have the Highest Minimum Wage in America?
-

 AI2 weeks ago
Ranked: Semiconductor Companies by Industry Revenue Share
-
Markets2 weeks ago
Ranked: The World’s Top Flight Routes, by Revenue
-

 Demographics2 weeks ago
Population Projections: The World’s 6 Largest Countries in 2075
-
Markets2 weeks ago
The Top 10 States by Real GDP Growth in 2023
-

 Demographics2 weeks ago
The Smallest Gender Wage Gaps in OECD Countries