Markets
Visualized: FTX’s Leaked Balance Sheet


Visualizing FTX’s Balance Sheet Before Bankruptcy
In a difficult year for the crypto space that has been full of hacks, failing funds, and decentralized stablecoins going to zero, nothing has compared to FTX and Sam Bankman-Fried’s (SBF) rapid implosion.
After an astronomical rise in the crypto space over the past three years, crypto exchange FTX and its founder and CEO SBF have come crashing back down to earth, largely unraveled by their misuse of customer funds and illicit relationship with trading firm Alameda Research.
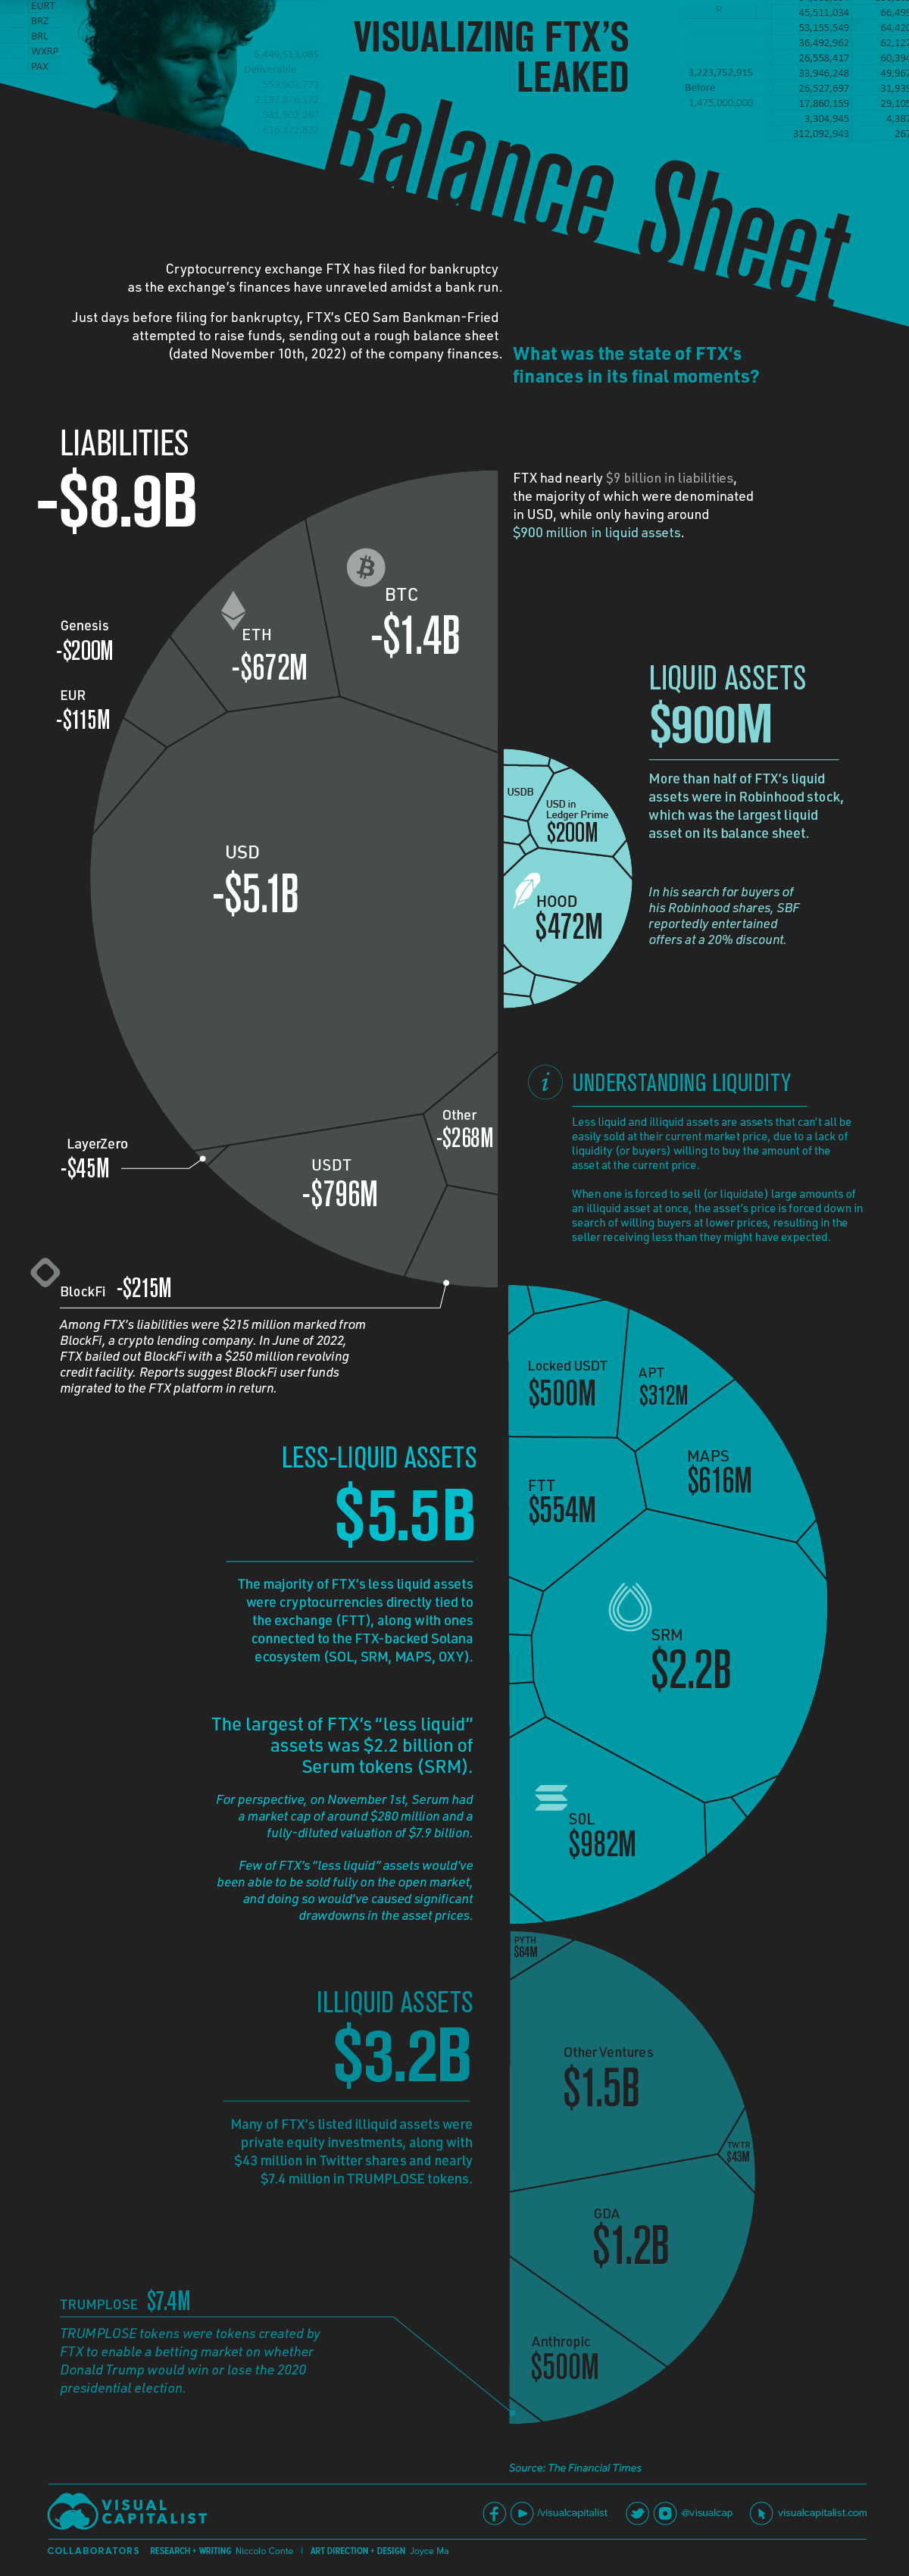
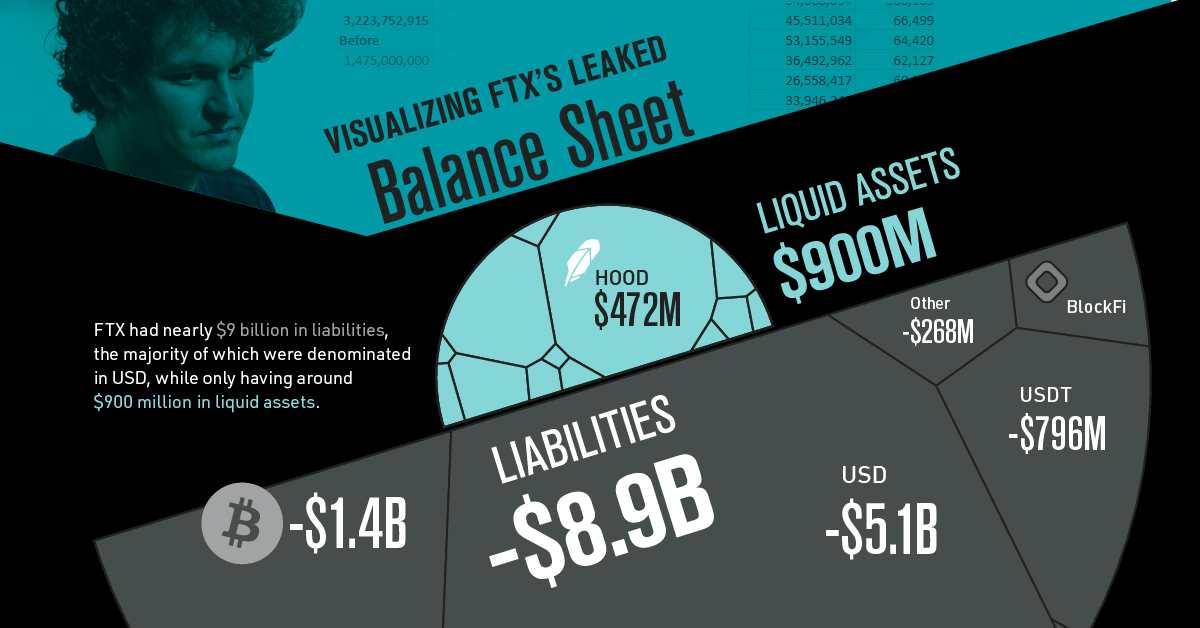
This graphic visualizes FTX’s leaked balance sheet dated to November 10th, and published by the Financial Times on November 12th. The spreadsheet shows nearly $9 billion in liabilities and not nearly enough illiquid cryptocurrency assets to cover the hole.
How did FTX wind up in this position?
How FTX’s Bankruptcy Unfolded
FTX’s eventual bankruptcy was sparked by a report on November 2nd by CoinDesk citing Alameda Research’s balance sheet. The article reported Alameda’s assets to be $14.6 billion, including $3.66 billion worth of unlocked FTT and $2.16 billion of FTT collateral.
With more than one-third of Alameda’s assets tied up in FTX’s exchange token FTT (including loans backed by the token), eyebrows were raised among the crypto community.
Four days later on November 6th, Alameda Research’s CEO, Caroline Ellison, and Sam Bankman-Fried addressed the CoinDesk story as unfounded rumors. However, on the same day, Binance CEO Changpeng Zhao (CZ) announced that Binance had decided to liquidate all remaining FTT on their books, kicking off a -7.6% decline in the FTT token on the day.
Back and Forth with Binance’s CZ
While Ellison publicly offered to buy CZ’s FTT directly “over the counter” to avoid further price declines and SBF claimed in a now-deleted tweet that “FTX is fine. Assets are fine.”, FTX users were withdrawing their funds from the exchange.
Less than 24 hours later on November 7th, both SBF and CZ tweeted that Binance had signed a non-binding letter of intent for the acquisition of FTX, pending due diligence.
The next day, the acquisition fell apart as Binance cited corporate due diligence, leaving SBF to face a multi-directional liquidity crunch of users withdrawing funds and rapidly declining token prices that made up large amounts of FTX and Alameda’s assets and collateral for loans.
FTX’s Liabilities and Largely Illiquid Assets
In the final days before declaring bankruptcy, FTX CEO Sam Bankman-Fried attempted a final fundraising in order restore stability while billions in user funds were being withdrawn from his exchange.
The balance sheet he sent around to prospective investors was leaked by the Financial Times, and reveals the exchange had nearly $9 billion in liabilities while only having just over $1 billion in liquid assets. Alongside the liquid assets were $5.4 billion in assets labeled as “less liquid” and $3.2 billion labeled as “illiquid”.
When examining the assets listed, FTX’s accounting appears to be poorly done at best, and fraudulently deceptive at worst.
Of those “less liquid” assets, many of the largest sums were in assets like FTX’s own exchange token and cryptocurrencies of the Solana ecosystem, which were heavily supported by FTX and Sam Bankman-Fried. On top of this, for many of these coins the liquidity simply wouldn’t have been there if FTX had attempted to redeem these cryptocurrencies for U.S. dollars or stablecoin equivalents.
While the liquid and less liquid assets on the balance sheet amounted to $6.3 billion (still not enough to equal the $8.9 billion in liabilities), many of these “less liquid” assets may as well have been completely illiquid.
Relationship with Alameda Research
When looking at FTX’s financials in isolation, it’s impossible to understand how one of crypto’s largest exchanges ended up with such a lopsided and illiquid balance sheet. Many of the still unfolding details lie in the exchange’s relationship with SBF’s previous venture that he founded, trading firm Alameda Research.
Founded by SBF in 2017, Alameda Research primarily operated as a delta-neutral (a term that describes trading strategies like market making and arbitrage that attempt to avoid taking directional risk) trading firm. In the summer of 2021, SBF stepped down from Alameda Research to focus on FTX, however his influence and connection with the firm was still deeply ingrained.
A report from the Wall Street Journal cites how Alameda was able to amass crypto tokens ahead of their announced public FTX listings, which were often catalysts in price surges. Alongside this, a Reuters story has revealed how SBF secretly moved $10 billion in funds to Alameda, using a bookkeeping “back door” to avoid internal scrutiny at FTX.
While SBF responded to the Reuters story by saying they “had confusing internal labeling and misread it,” there are few doubts that this murky relationship between Alameda Research and FTX was a fatal one for the former billionaire’s empire.


Markets
The European Stock Market: Attractive Valuations Offer Opportunities
On average, the European stock market has valuations that are nearly 50% lower than U.S. valuations. But how can you access the market?


European Stock Market: Attractive Valuations Offer Opportunities
Europe is known for some established brands, from L’Oréal to Louis Vuitton. However, the European stock market offers additional opportunities that may be lesser known.
The above infographic, sponsored by STOXX, outlines why investors may want to consider European stocks.
Attractive Valuations
Compared to most North American and Asian markets, European stocks offer lower or comparable valuations.
| Index | Price-to-Earnings Ratio | Price-to-Book Ratio |
|---|---|---|
| EURO STOXX 50 | 14.9 | 2.2 |
| STOXX Europe 600 | 14.4 | 2 |
| U.S. | 25.9 | 4.7 |
| Canada | 16.1 | 1.8 |
| Japan | 15.4 | 1.6 |
| Asia Pacific ex. China | 17.1 | 1.8 |
Data as of February 29, 2024. See graphic for full index names. Ratios based on trailing 12 month financials. The price to earnings ratio excludes companies with negative earnings.
On average, European valuations are nearly 50% lower than U.S. valuations, potentially offering an affordable entry point for investors.
Research also shows that lower price ratios have historically led to higher long-term returns.
Market Movements Not Closely Connected
Over the last decade, the European stock market had low-to-moderate correlation with North American and Asian equities.
The below chart shows correlations from February 2014 to February 2024. A value closer to zero indicates low correlation, while a value of one would indicate that two regions are moving in perfect unison.
| EURO STOXX 50 | STOXX EUROPE 600 | U.S. | Canada | Japan | Asia Pacific ex. China |
|
|---|---|---|---|---|---|---|
| EURO STOXX 50 | 1.00 | 0.97 | 0.55 | 0.67 | 0.24 | 0.43 |
| STOXX EUROPE 600 | 1.00 | 0.56 | 0.71 | 0.28 | 0.48 | |
| U.S. | 1.00 | 0.73 | 0.12 | 0.25 | ||
| Canada | 1.00 | 0.22 | 0.40 | |||
| Japan | 1.00 | 0.88 | ||||
| Asia Pacific ex. China | 1.00 |
Data is based on daily USD returns.
European equities had relatively independent market movements from North American and Asian markets. One contributing factor could be the differing sector weights in each market. For instance, technology makes up a quarter of the U.S. market, but health care and industrials dominate the broader European market.
Ultimately, European equities can enhance portfolio diversification and have the potential to mitigate risk for investors.
Tracking the Market
For investors interested in European equities, STOXX offers a variety of flagship indices:
| Index | Description | Market Cap |
|---|---|---|
| STOXX Europe 600 | Pan-regional, broad market | €10.5T |
| STOXX Developed Europe | Pan-regional, broad-market | €9.9T |
| STOXX Europe 600 ESG-X | Pan-regional, broad market, sustainability focus | €9.7T |
| STOXX Europe 50 | Pan-regional, blue-chip | €5.1T |
| EURO STOXX 50 | Eurozone, blue-chip | €3.5T |
Data is as of February 29, 2024. Market cap is free float, which represents the shares that are readily available for public trading on stock exchanges.
The EURO STOXX 50 tracks the Eurozone’s biggest and most traded companies. It also underlies one of the world’s largest ranges of ETFs and mutual funds. As of November 2023, there were €27.3 billion in ETFs and €23.5B in mutual fund assets under management tracking the index.
“For the past 25 years, the EURO STOXX 50 has served as an accurate, reliable and tradable representation of the Eurozone equity market.”
— Axel Lomholt, General Manager at STOXX
Partnering with STOXX to Track the European Stock Market
Are you interested in European equities? STOXX can be a valuable partner:
- Comprehensive, liquid and investable ecosystem
- European heritage, global reach
- Highly sophisticated customization capabilities
- Open architecture approach to using data
- Close partnerships with clients
- Part of ISS STOXX and Deutsche Börse Group
With a full suite of indices, STOXX can help you benchmark against the European stock market.
Learn how STOXX’s European indices offer liquid and effective market access.

-

 Economy2 days ago
Economic Growth Forecasts for G7 and BRICS Countries in 2024
The IMF has released its economic growth forecasts for 2024. How do the G7 and BRICS countries compare?
-

 Markets1 week ago
U.S. Debt Interest Payments Reach $1 Trillion
U.S. debt interest payments have surged past the $1 trillion dollar mark, amid high interest rates and an ever-expanding debt burden.
-

 United States2 weeks ago
Ranked: The Largest U.S. Corporations by Number of Employees
We visualized the top U.S. companies by employees, revealing the massive scale of retailers like Walmart, Target, and Home Depot.
-

 Markets2 weeks ago
The Top 10 States by Real GDP Growth in 2023
This graphic shows the states with the highest real GDP growth rate in 2023, largely propelled by the oil and gas boom.
-

 Markets2 weeks ago
Ranked: The World’s Top Flight Routes, by Revenue
In this graphic, we show the highest earning flight routes globally as air travel continued to rebound in 2023.
-

 Markets2 weeks ago
Ranked: The Most Valuable Housing Markets in America
The U.S. residential real estate market is worth a staggering $47.5 trillion. Here are the most valuable housing markets in the country.


-

 Mining1 week ago
Gold vs. S&P 500: Which Has Grown More Over Five Years?
-
Markets2 weeks ago
Ranked: The Most Valuable Housing Markets in America
-

 Money2 weeks ago
Which States Have the Highest Minimum Wage in America?
-

 AI2 weeks ago
Ranked: Semiconductor Companies by Industry Revenue Share
-
Markets2 weeks ago
Ranked: The World’s Top Flight Routes, by Revenue
-

 Demographics2 weeks ago
Population Projections: The World’s 6 Largest Countries in 2075
-
Markets2 weeks ago
The Top 10 States by Real GDP Growth in 2023
-

 Demographics2 weeks ago
The Smallest Gender Wage Gaps in OECD Countries