Markets
How Factor Investing Works, Using Everyday Examples
Factor Investing: How You May Experience it
Why do investments perform the way they do? This is a question many investment experts have been attempting to answer for years. Luckily, factor investing can provide investors with a data-driven understanding.
In this infographic from MSCI, we use scenarios from everyday life to explain how factor investing works.
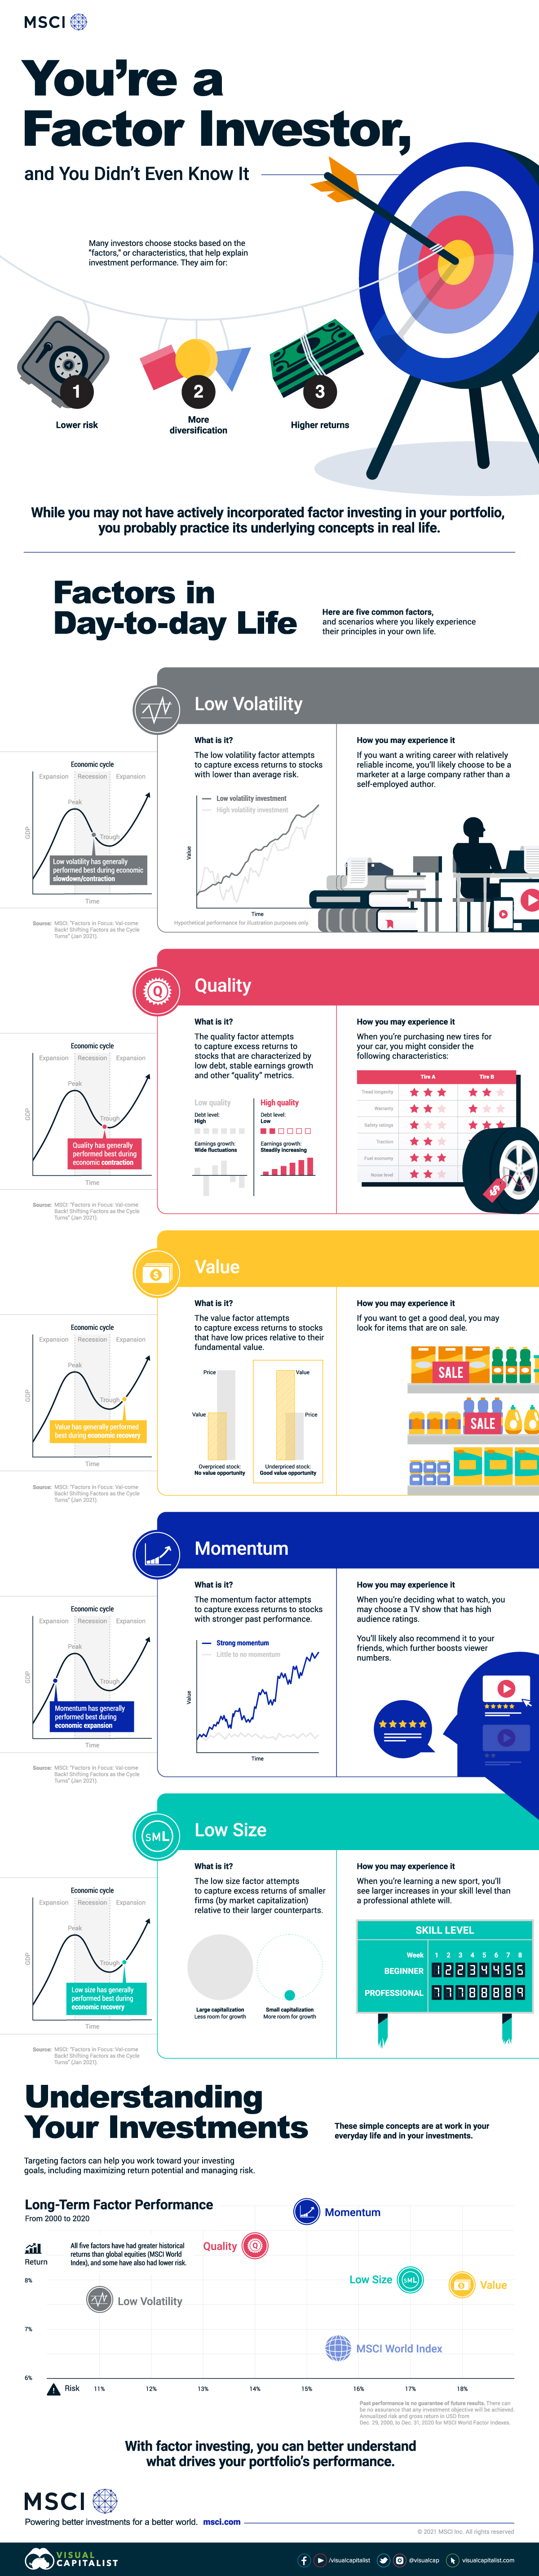
What is Factor Investing?
Simply put, investors choose stocks based on the “factors”, or characteristics, that help explain investment performance. They are typically aiming for:
- Higher returns
- Lower risk
- More diversification
While you may not have actively incorporated factor investing in your current portfolio, almost everyone will be familiar with the underlying concepts in real life. Here are five common factors and scenarios where you likely experience their principles.
1. Low Volatility Factor
The low volatility factor attempts to capture excess returns to stocks with lower than average risk. This factor has generally performed best during economic slowdowns or contractions.
How you may experience it: If you want a writing career with relatively reliable income, you’ll likely choose to be a marketer at a large company rather than a self-employed author.
2. Quality Factor
The quality factor attempts to capture excess returns in shares of companies that are characterized by low debt, stable earnings growth, and other “quality” metrics. This factor has generally performed best during economic contractions.
How you may experience it: When you’re purchasing new tires for your car, you might consider characteristics like tread longevity, traction, and fuel economy.
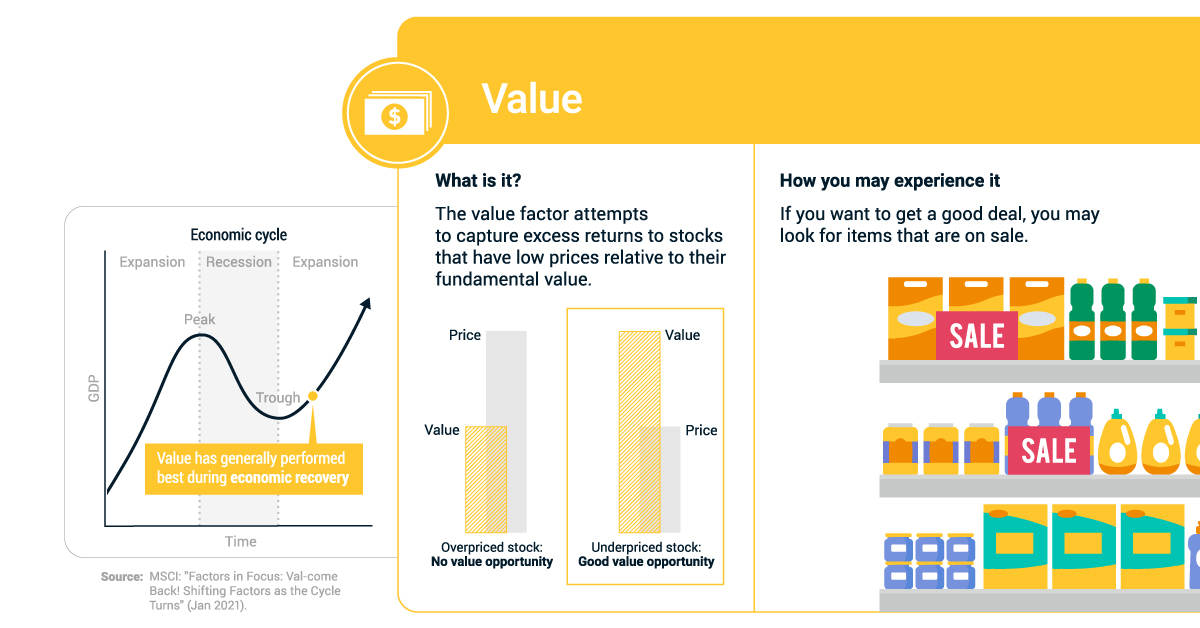
3. Value Factor
The value factor attempts to capture excess returns to stocks that have low prices relative to their fundamental value. This factor has generally performed best during economic recoveries.
How you may experience it: If you want a good deal, you may look for items that are on sale.
4. Momentum Factor
The momentum factor attempts to capture excess returns to stocks with stronger past performance. It has generally performed best during economic expansions.
How you may experience it: When you’re deciding what to watch, you may choose a TV show that has high audience ratings. You’ll likely also recommend it to your friends, which further boosts viewer numbers.
5. Low Size Factor
The low size factor attempts to capture excess returns of smaller firms (by market capitalization) relative to their larger counterparts. It has generally performed best during economic recoveries.
How you may experience it: When you’re learning a new sport, you’ll see larger increases in your skill level than a professional athlete will.
Understanding Your Investments With Factor Investing
These simple concepts are at work in your everyday life and in your investments. Targeting these factors can help you meet your investing goals, including maximizing return potential and managing risk.
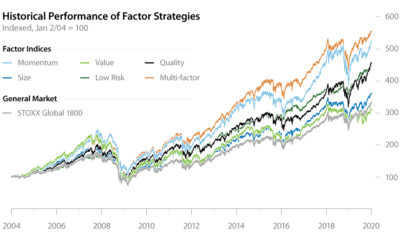
From 2000 to 2020, here’s how the risk and return of the above factors compared to the benchmark MSCI World Index.
| Return | Risk | |
|---|---|---|
| Momentum | 9.4% | 14.8% |
| Quality | 8.7% | 13.9% |
| Low Size | 8.0% | 17.0% |
| Value | 7.9% | 17.9% |
| Low Volatility | 7.6% | 11.1% |
| MSCI World Index | 6.6% | 15.6% |
Annualized risk and gross returns in USD from December 29 2000 to December 31 2020 for MSCI World Factor Indexes.
All five of the factors have had greater historical returns than the benchmark index, and some have also had lower risk.
With factor investing, you can better understand what drives your portfolio’s performance.

Markets
The European Stock Market: Attractive Valuations Offer Opportunities
On average, the European stock market has valuations that are nearly 50% lower than U.S. valuations. But how can you access the market?


European Stock Market: Attractive Valuations Offer Opportunities
Europe is known for some established brands, from L’Oréal to Louis Vuitton. However, the European stock market offers additional opportunities that may be lesser known.
The above infographic, sponsored by STOXX, outlines why investors may want to consider European stocks.
Attractive Valuations
Compared to most North American and Asian markets, European stocks offer lower or comparable valuations.
| Index | Price-to-Earnings Ratio | Price-to-Book Ratio |
|---|---|---|
| EURO STOXX 50 | 14.9 | 2.2 |
| STOXX Europe 600 | 14.4 | 2 |
| U.S. | 25.9 | 4.7 |
| Canada | 16.1 | 1.8 |
| Japan | 15.4 | 1.6 |
| Asia Pacific ex. China | 17.1 | 1.8 |
Data as of February 29, 2024. See graphic for full index names. Ratios based on trailing 12 month financials. The price to earnings ratio excludes companies with negative earnings.
On average, European valuations are nearly 50% lower than U.S. valuations, potentially offering an affordable entry point for investors.
Research also shows that lower price ratios have historically led to higher long-term returns.
Market Movements Not Closely Connected
Over the last decade, the European stock market had low-to-moderate correlation with North American and Asian equities.
The below chart shows correlations from February 2014 to February 2024. A value closer to zero indicates low correlation, while a value of one would indicate that two regions are moving in perfect unison.
| EURO STOXX 50 | STOXX EUROPE 600 | U.S. | Canada | Japan | Asia Pacific ex. China |
|
|---|---|---|---|---|---|---|
| EURO STOXX 50 | 1.00 | 0.97 | 0.55 | 0.67 | 0.24 | 0.43 |
| STOXX EUROPE 600 | 1.00 | 0.56 | 0.71 | 0.28 | 0.48 | |
| U.S. | 1.00 | 0.73 | 0.12 | 0.25 | ||
| Canada | 1.00 | 0.22 | 0.40 | |||
| Japan | 1.00 | 0.88 | ||||
| Asia Pacific ex. China | 1.00 |
Data is based on daily USD returns.
European equities had relatively independent market movements from North American and Asian markets. One contributing factor could be the differing sector weights in each market. For instance, technology makes up a quarter of the U.S. market, but health care and industrials dominate the broader European market.
Ultimately, European equities can enhance portfolio diversification and have the potential to mitigate risk for investors.
Tracking the Market
For investors interested in European equities, STOXX offers a variety of flagship indices:
| Index | Description | Market Cap |
|---|---|---|
| STOXX Europe 600 | Pan-regional, broad market | €10.5T |
| STOXX Developed Europe | Pan-regional, broad-market | €9.9T |
| STOXX Europe 600 ESG-X | Pan-regional, broad market, sustainability focus | €9.7T |
| STOXX Europe 50 | Pan-regional, blue-chip | €5.1T |
| EURO STOXX 50 | Eurozone, blue-chip | €3.5T |
Data is as of February 29, 2024. Market cap is free float, which represents the shares that are readily available for public trading on stock exchanges.
The EURO STOXX 50 tracks the Eurozone’s biggest and most traded companies. It also underlies one of the world’s largest ranges of ETFs and mutual funds. As of November 2023, there were €27.3 billion in ETFs and €23.5B in mutual fund assets under management tracking the index.
“For the past 25 years, the EURO STOXX 50 has served as an accurate, reliable and tradable representation of the Eurozone equity market.”
— Axel Lomholt, General Manager at STOXX
Partnering with STOXX to Track the European Stock Market
Are you interested in European equities? STOXX can be a valuable partner:
- Comprehensive, liquid and investable ecosystem
- European heritage, global reach
- Highly sophisticated customization capabilities
- Open architecture approach to using data
- Close partnerships with clients
- Part of ISS STOXX and Deutsche Börse Group
With a full suite of indices, STOXX can help you benchmark against the European stock market.
Learn how STOXX’s European indices offer liquid and effective market access.

-

 Economy2 days ago
Economic Growth Forecasts for G7 and BRICS Countries in 2024
The IMF has released its economic growth forecasts for 2024. How do the G7 and BRICS countries compare?
-

 Markets1 week ago
U.S. Debt Interest Payments Reach $1 Trillion
U.S. debt interest payments have surged past the $1 trillion dollar mark, amid high interest rates and an ever-expanding debt burden.
-

 United States2 weeks ago
Ranked: The Largest U.S. Corporations by Number of Employees
We visualized the top U.S. companies by employees, revealing the massive scale of retailers like Walmart, Target, and Home Depot.
-

 Markets2 weeks ago
The Top 10 States by Real GDP Growth in 2023
This graphic shows the states with the highest real GDP growth rate in 2023, largely propelled by the oil and gas boom.
-

 Markets2 weeks ago
Ranked: The World’s Top Flight Routes, by Revenue
In this graphic, we show the highest earning flight routes globally as air travel continued to rebound in 2023.
-

 Markets2 weeks ago
Ranked: The Most Valuable Housing Markets in America
The U.S. residential real estate market is worth a staggering $47.5 trillion. Here are the most valuable housing markets in the country.


-

 Energy1 week ago
The World’s Biggest Nuclear Energy Producers
-

 Money2 weeks ago
Which States Have the Highest Minimum Wage in America?
-

 Technology2 weeks ago
Ranked: Semiconductor Companies by Industry Revenue Share
-
Markets2 weeks ago
Ranked: The World’s Top Flight Routes, by Revenue
-

 Countries2 weeks ago
Population Projections: The World’s 6 Largest Countries in 2075
-
Markets2 weeks ago
The Top 10 States by Real GDP Growth in 2023
-

 Demographics2 weeks ago
The Smallest Gender Wage Gaps in OECD Countries
-

 United States2 weeks ago
Where U.S. Inflation Hit the Hardest in March 2024