RiskGrade: A More Intuitive Way to Calculate Investment Risk
The following content is sponsored by MSCI.
A More Intuitive Way to Calculate Investment Risk
What crucial factors come into play when choosing investments?
At a high level, there’s two sides to the equation: return and risk. While potential profit is important, the volatility or risk of those profits also plays a critical role. In this graphic from MSCI we introduce the RiskGrade™ metric, a more intuitive way of calculating investment risk.
What is RiskGrade™?
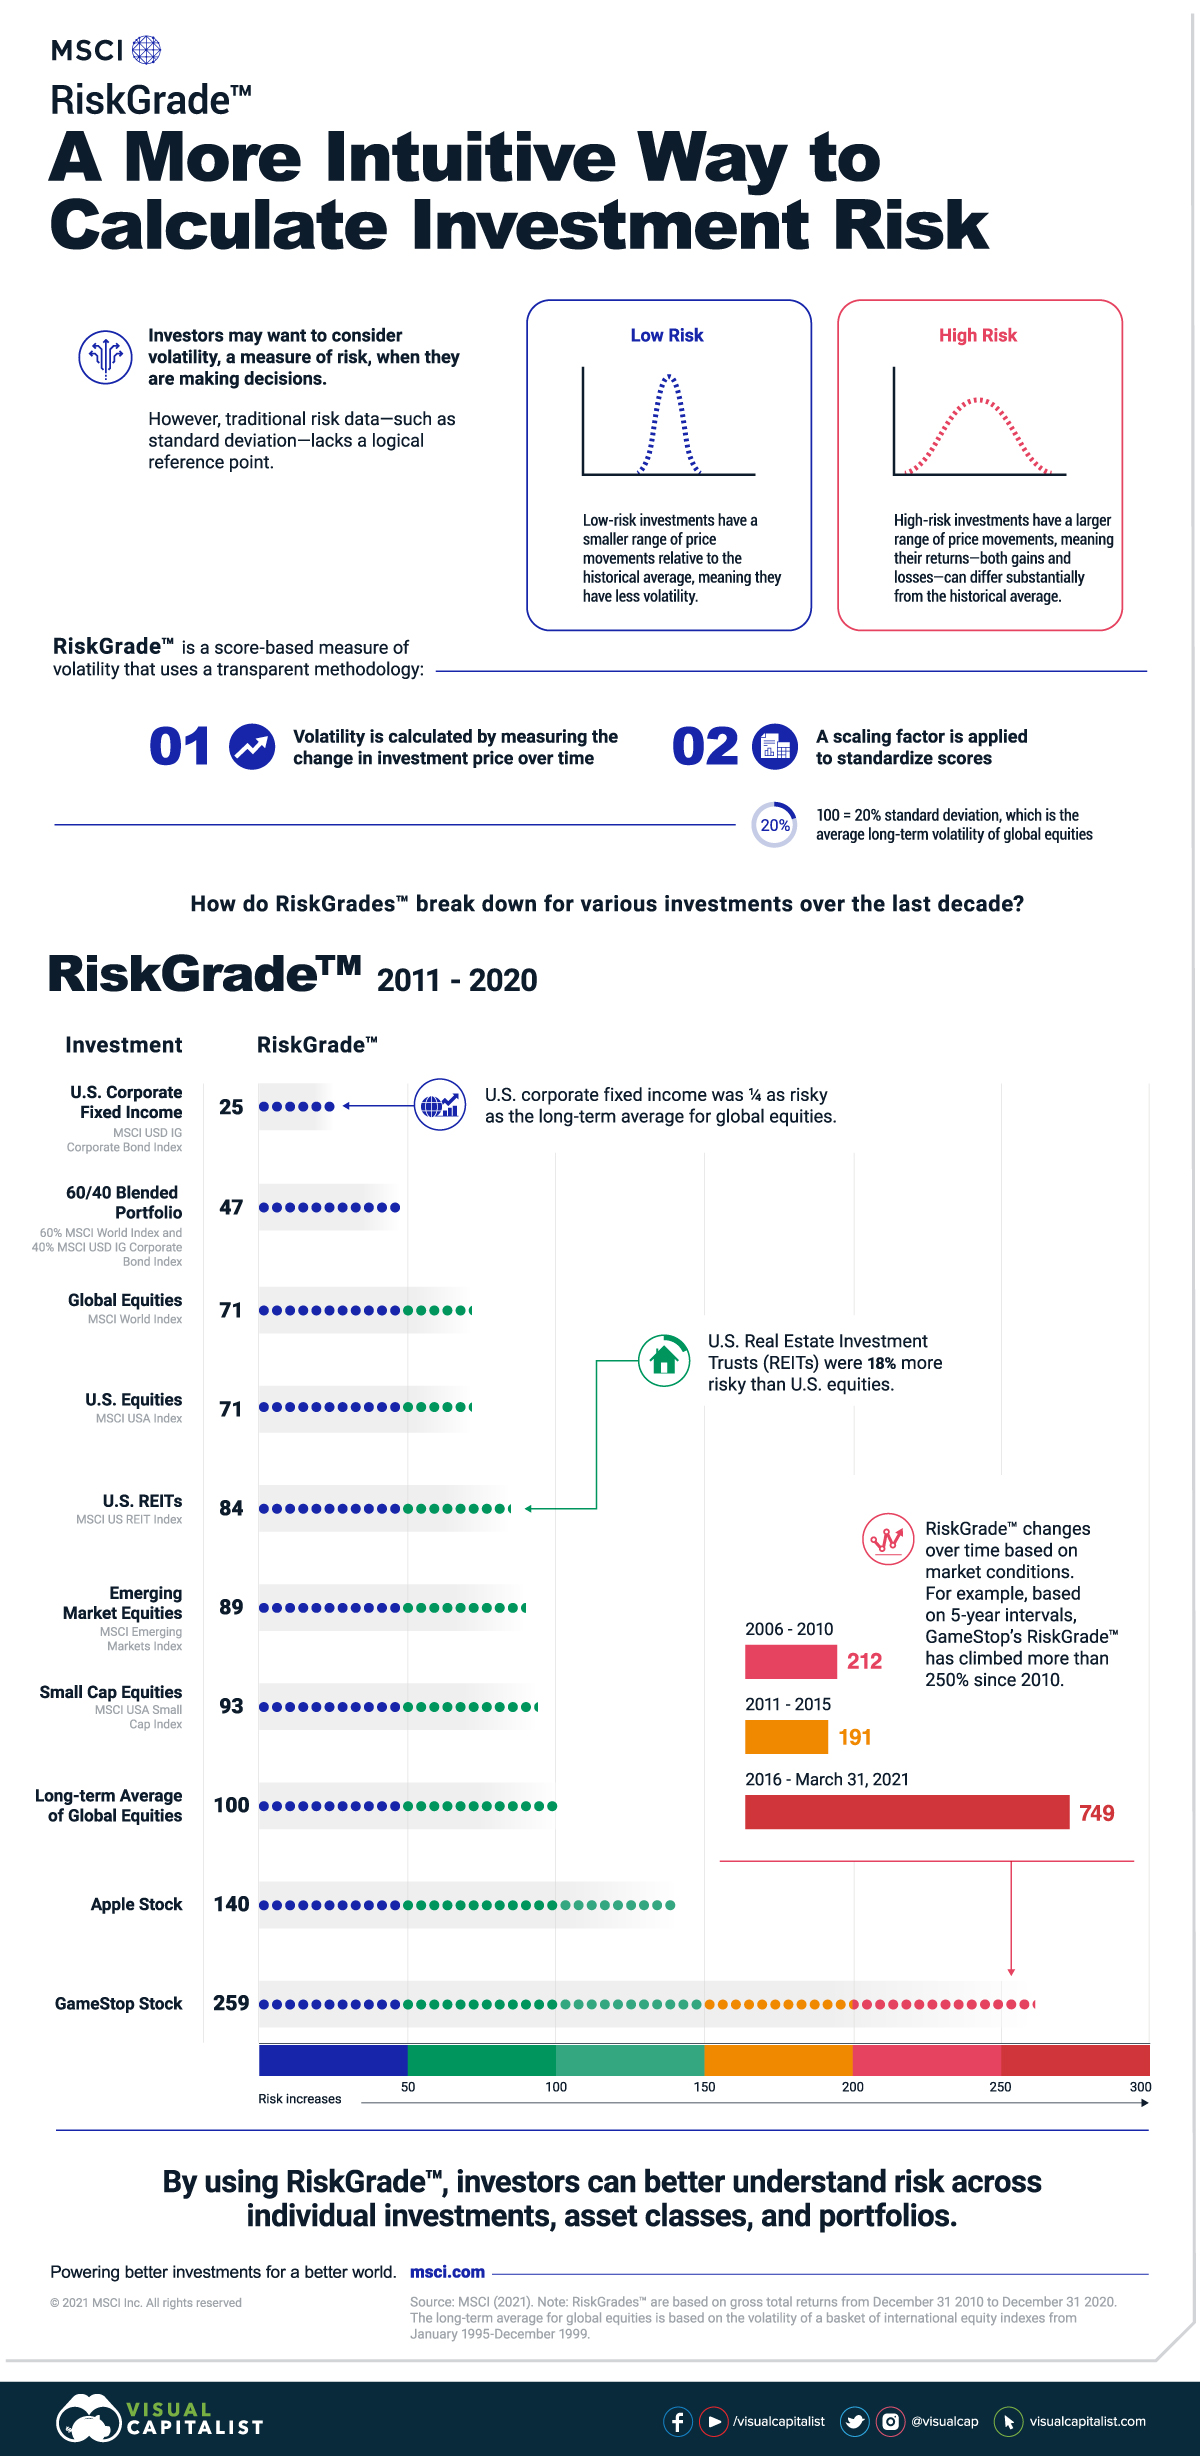
One way of measuring investment risk is through volatility. Low risk investments have a smaller range of price movements relative to their historical average, meaning they have less volatility. On the flip side, high risk investments have a larger range of price movements. This means their returns—both gains and losses—can differ substantially from the historical average.
Traditionally, this volatility is measured through standard deviation. However, standard deviation can be difficult for investors to interpret as it has no intuitive reference point. Enter RiskGrade: a score-based measure of volatility that uses a transparent methodology.
- Volatility is calculated by measuring the change in investment price over time.
- A scaling factor is applied to standardize scores.
In the second step, 100 is equivalent to a 20% standard deviation, which is the average long-term volatility of global equities. Cash would have a RiskGrade of 0, whereas a technology IPO may have a RiskGrade that exceeds 1,000. It should be noted that RiskGrade only captures risk from a market price perspective, and does not consider inflation risk.
Investment Risk Over the Last Decade
To get a better idea of how this works, let’s take a look at the RiskGrade™ of select investments over the period from 2011-2020.
| Investment | RiskGrade |
|---|---|
| U.S. Corporate Fixed Income | 25 |
| 60/40 Blended Portfolio | 47 |
| Global Equities | 71 |
| U.S. Equities | 71 |
| U.S. REITs | 84 |
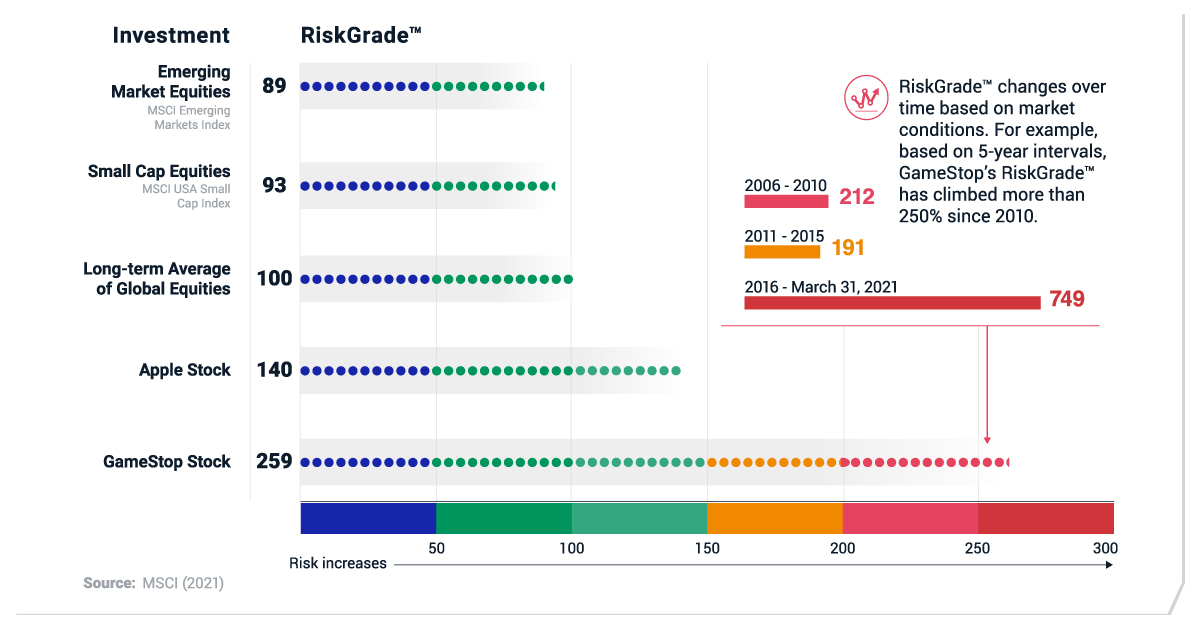
| Emerging Market Equities | 89 |
| Small Cap Equities | 93 |
| Long-term Average of Global Equities | 100 |
| Apple Stock | 140 |
| GameStop Stock | 259 |
Note: RiskGrades are based on gross total returns from December 31 2010 to December 31 2020. See the graphic for the specific indexes used.
U.S. corporate fixed income was the least risky of the group. A 60% global equity / 40% U.S. fixed income portfolio was a third less risky than a 100% global equity portfolio.
Meanwhile, U.S. Real Estate Investment Trusts (REITs) were less risky than emerging market equities and small cap equities.
Of the above examples, GameStop stock had the highest investment risk, with a RiskGrade more than 2.5 times higher than the long-term average for global equities.
Of course, RiskGrades are not static and change over time depending on market conditions. GameStop, which saw heightened volatility as individual investors created a short squeeze, is a strong example of the fluidity of RiskGrades. Based on 5-year intervals, the stock had a RiskGrade of 212 from 2006-2010, and a RiskGrade of 749 from 2016-March 31, 2021—a jump of over 250%.
Monitoring Investment Risk
Investors may want to consider both risk and return when selecting their investments. In comparison to traditional risk metrics, RiskGrade provides a more intuitive way for investors to gauge their risk across individual investments, asset classes, and portfolios.
With clear apples-to-apples comparisons, more investors may be able to easily understand investment risk and adjust their portfolios to suit their personal risk tolerance and goals.
-

 Sponsored3 years ago
More Than Precious: Silver’s Role in the New Energy Era (Part 3 of 3)
Long known as a precious metal, silver in solar and EV technologies will redefine its role and importance to a greener economy.
-
 Sponsored7 years ago
The History and Evolution of the Video Games Market
Everything from Pong to the rise of mobile gaming and AR/VR. Learn about the $100 billion video games market in this giant infographic.
-
 Sponsored8 years ago
The Extraordinary Raw Materials in an iPhone 6s
Over 700 million iPhones have now been sold, but the iPhone would not exist if it were not for the raw materials that make the technology...
-
 Sponsored8 years ago
The Industrial Internet, and How It’s Revolutionizing Mining
The convergence of the global industrial sector with big data and the internet of things, or the Industrial Internet, will revolutionize how mining works.
