Markets
Mapped: The Top U.S. Imports by State
Article/Editing:
Click to view a larger version of the graphic.
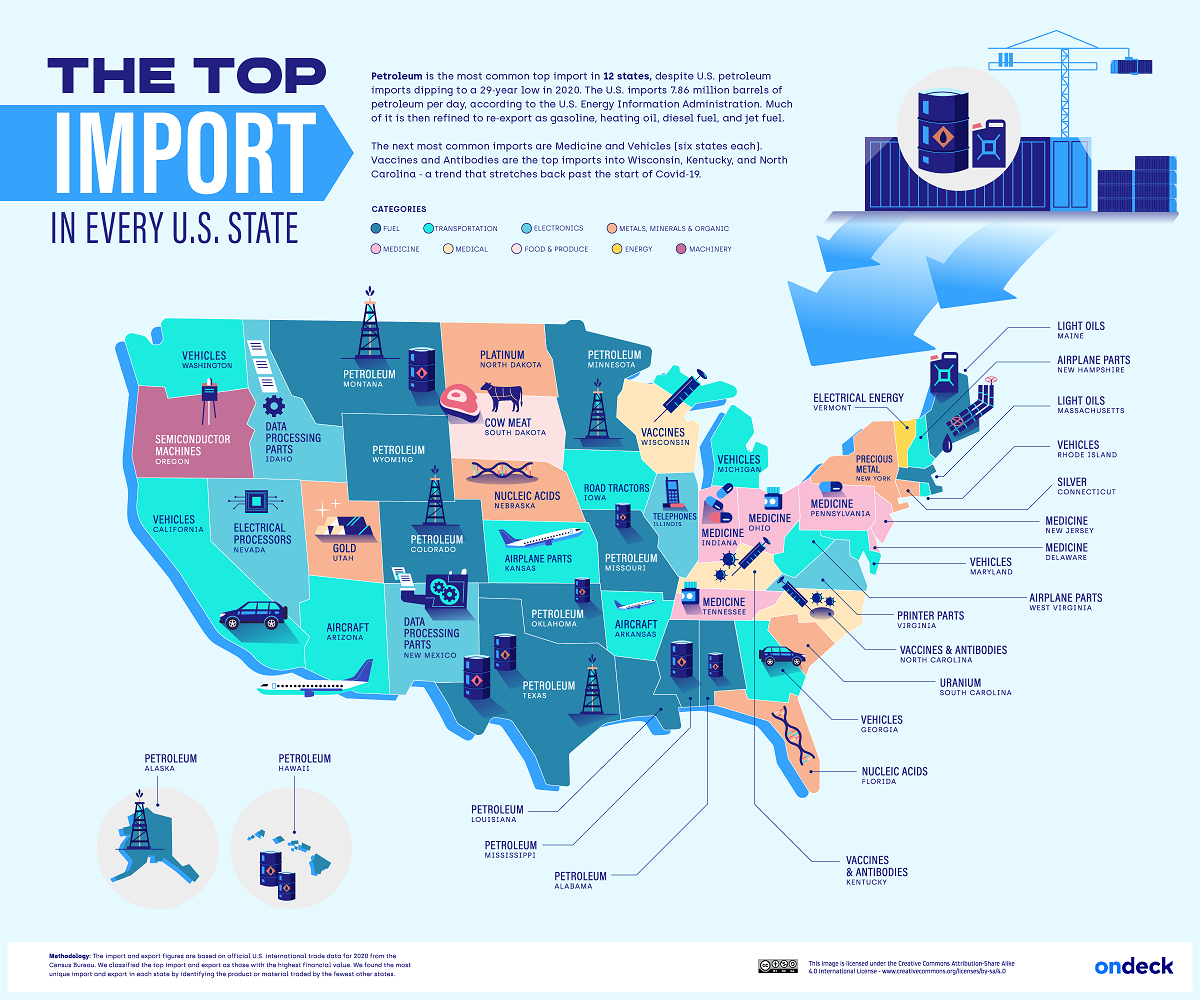
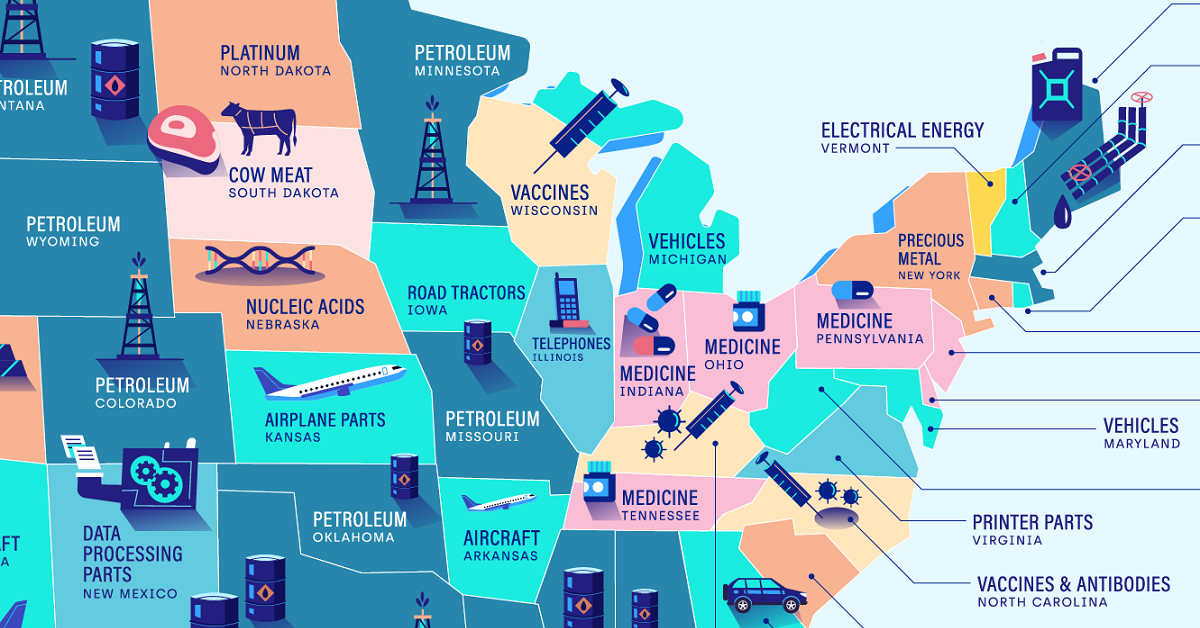
Mapped: The Top U.S. Imports by State
In 2021, the U.S. brought in approximately $2.83 trillion worth of goods from its various international trading partners.
But what types of goods are most commonly imported throughout different parts of America? This graphic by OnDeck shows the top import in every U.S. state, using January 2022 data from the U.S. Census Bureau.
The Most Popular Categories of U.S. Imports
Petroleum is the most popular import in 12 states, making it the most common import across America. In 2021, about 72% of imported petroleum was crude oil, which was then domestically refined into products like gasoline, diesel, or jet fuel.
| State | Top Import |
|---|---|
| Alabama | Petroleum |
| Alaska | Petroleum |
| Arizona | Aircraft |
| Arkansas | Aircraft |
| California | Vehicles |
| Colorado | Petroleum |
| Connecticut | Silver |
| Delaware | Medicine |
| Florida | Nucleic Acids |
| Georgia | Vehicles |
| Hawaii | Petroleum |
| Idaho | Data Processing Parts |
| Illinois | Telephones |
| Indiana | Medicine |
| Iowa | Road Tractors |
| Kansas | Aircraft |
| Kentucky | Vaccines and Antibodies |
| Louisiana | Petroleum |
| Maine | Light Oils |
| Maryland | Vehicles |
| Massachusetts | Light Oils |
| Michigan | Vehicles |
| Minnesota | Petroleum |
| Mississippi | Petroleum |
| Missouri | Petroleum |
| Montana | Petroleum |
| Nebraska | Nucleic Acids |
| Nevada | Electrical Processors |
| New Hampshire | Aircraft |
| New Jersey | Medicine |
| New Mexico | Data Processing Parts |
| New York | Precious Metal |
| North Carolina | Vaccines and Antibodies |
| North Dakota | Platinum |
| Ohio | Medicine |
| Oklahoma | Petroleum |
| Oregon | Semiconductor Machines |
| Pennsylvania | Medicine |
| Rhode Island | Vehicles |
| South Carolina | Uranium |
| South Dakota | Cow Meat |
| Tennessee | Medicine |
| Texas | Petroleum |
| Utah | Gold |
| Vermont | Electrical Energy |
| Virginia | Printer Parts |
| Washington | Vehicles |
| West Virginia | Aircraft |
| Wisconsin | Vaccines |
| Wyoming | Petroleum |
A majority of that imported petroleum came from Canada, while roughly 11% was imported from OPEC countries, and 8% came from Russia. Of course, the latter figure will likely dip in 2022 because of the ban on Russian imports implemented by the Biden administration in response to the Russia-Ukraine conflict.
After petroleum, vehicles and medicine were tied for the second most-imported goods, with both categories being the most popular import in six states each.
Somewhat related to medicine are nucleic acids, which were the top imports in Florida and Nebraska. Nucleic acids are natural polymers that are used in biological processes like protein synthesis or messenger RNA (mRNA) translation. It’s worth noting that several COVID-19 vaccines, including those produced by Moderna and Pfizer-BioNTech, are mRNA vaccines.
The Most Unique U.S. Imports
In addition to outlining the most popular imports in each U.S. state, OnDeck highlights each state’s most unique import, visualized in the graphic below.
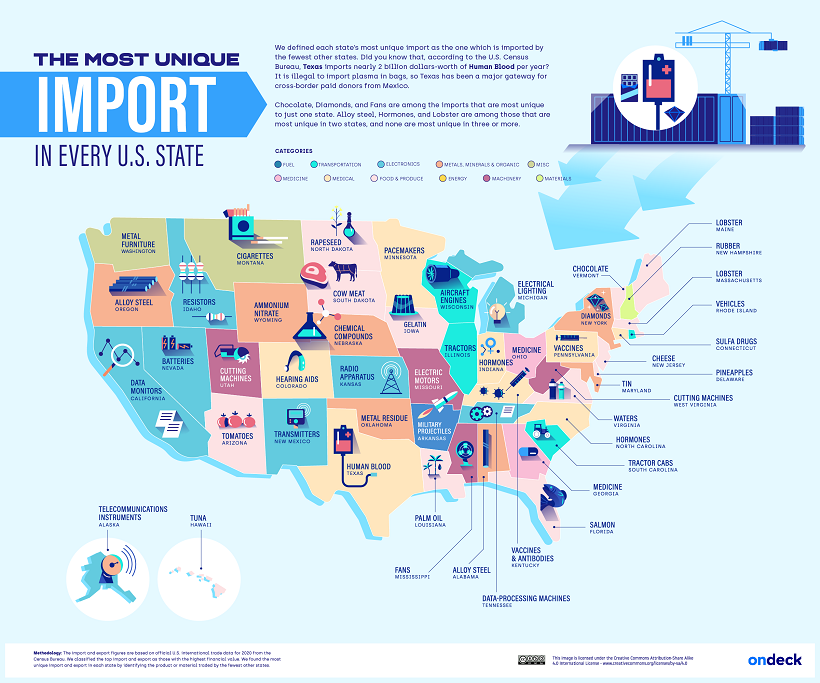
OnDeck defines each state’s “most unique” import as the category of goods that was imported by the fewest other states.
Salmon was Florida’s most unique import. This makes sense considering the Sunshine State is home to some of the country’s biggest seafood wholesalers, including North Star Seafood (owned by Sysco) and Tampa Bay Fisheries.
Another example is Delaware’s high imports of pineapples, totaling around $60.2 million in pineapples per year. This time, the culprit is Dole plc (formerly the Dole Food Company), the largest producer of fruit and vegetables in the world. Until 2021, the company’s headquarters were based in Delaware, and it still receives pineapple imports to the Port of Wilmington in the state’s largest city.

This article was published as a part of Visual Capitalist's Creator Program, which features data-driven visuals from some of our favorite Creators around the world.


Markets
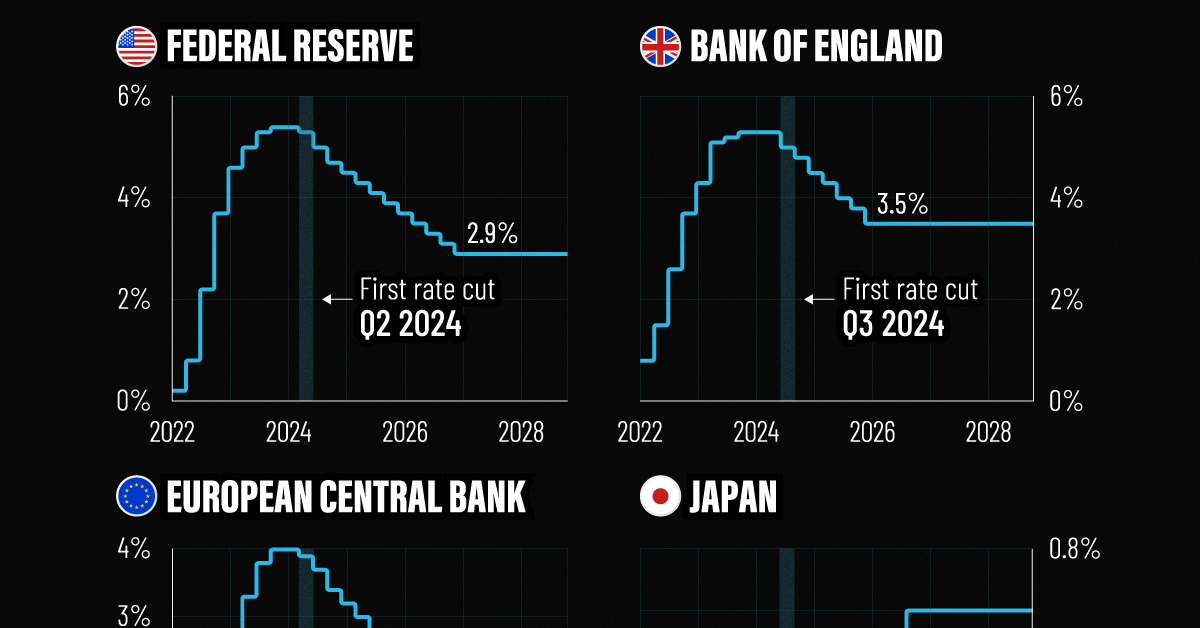
Visualized: Interest Rate Forecasts for Advanced Economies
In this graphic, we show the IMF’s interest rate forecast for the U.S., Europe, the UK, and Japan for the next five years ahead.
Interest Rate Projections for Advanced Economies
While U.S. inflation cooled in the second half of last year, price pressures returned in 2024, leading investors to rethink how soon central bankers will cut rates.
Despite the recent increase, the interest rate forecast for many economies looks optimistic, thanks to subdued energy price shocks and abating supply chain disruptions. Still, short-term risks remain, including persistently high services inflation clouding the outlook.
This graphic shows the interest rate forecast for advanced economies, based on the International Monetary Fund’s (IMF) 2024 World Economic Outlook.
Get the Key Insights of the IMF’s World Economic Outlook
Want a visual breakdown of the insights from the IMF’s 2024 World Economic Outlook report?
This visual is part of a special dispatch of the key takeaways exclusively for VC+ members.
Get the full dispatch of charts by signing up to VC+.
A Closer Look at the IMF Interest Rate Forecast
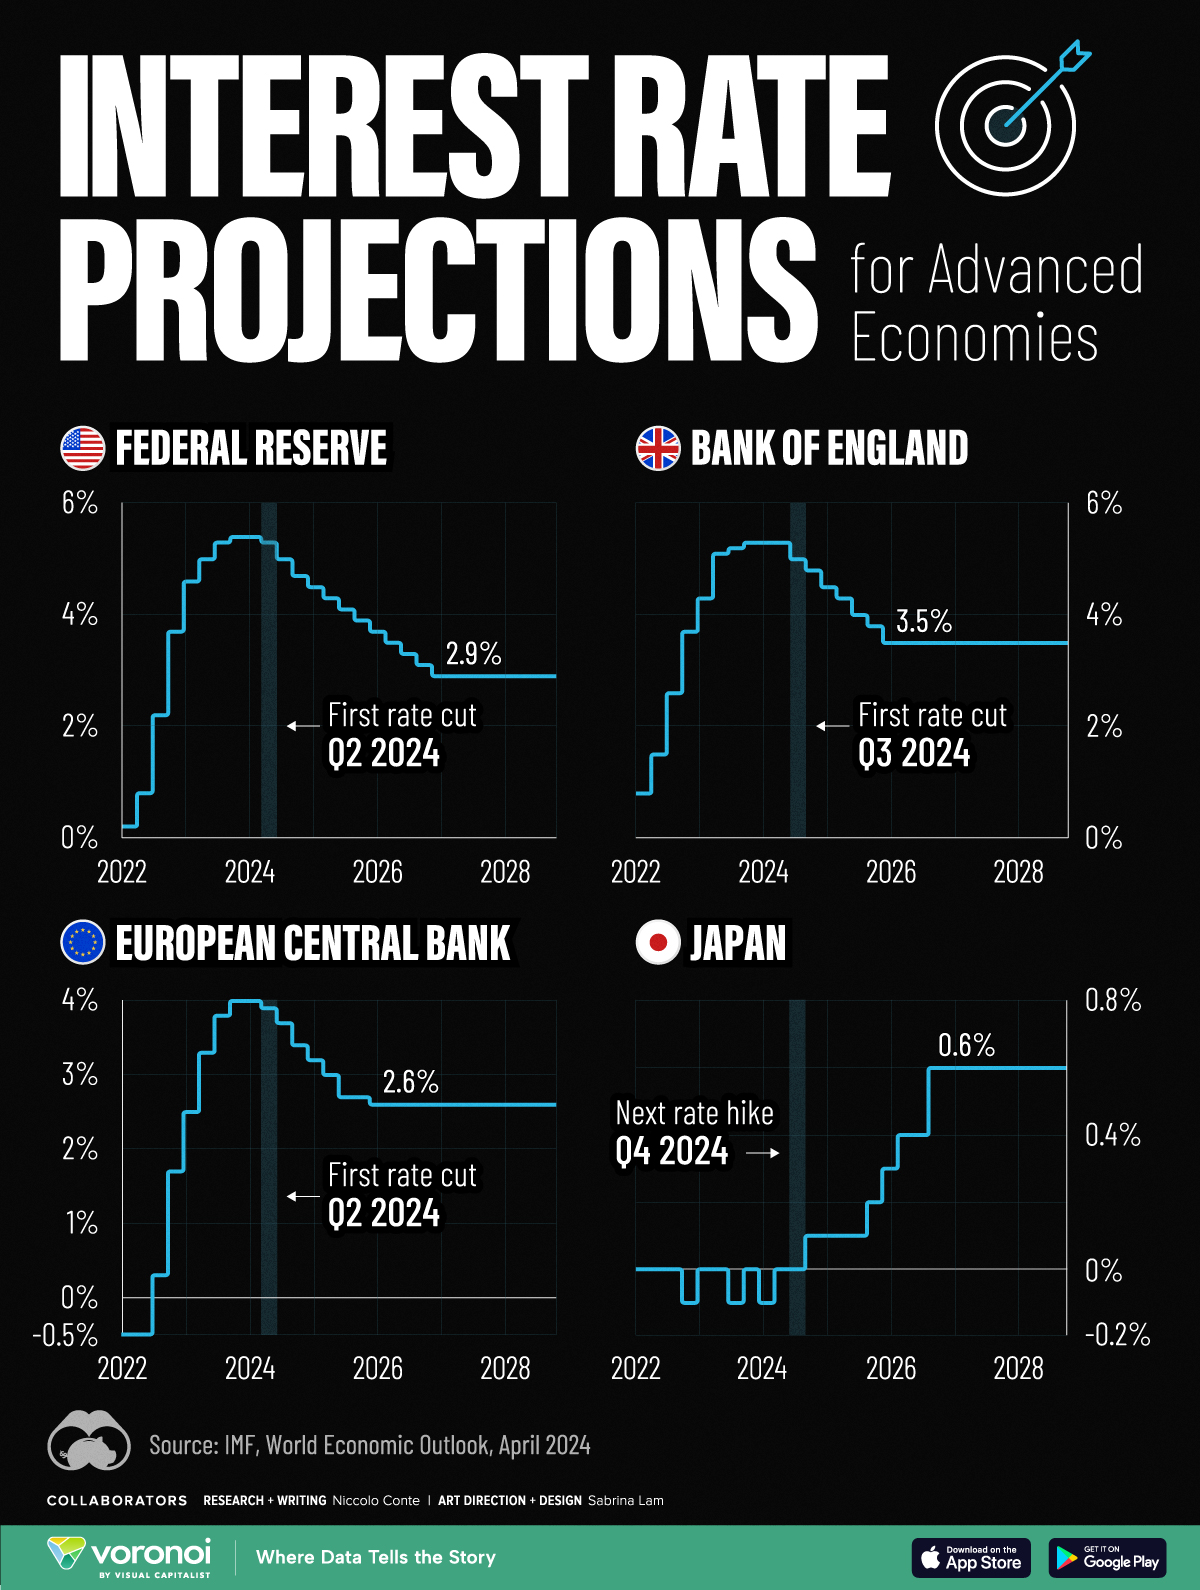
Below, we show the projected path of interest rates based on the IMF’s latest data:
| Federal Reserve | Bank of England | ECB | Bank of Japan | |
|---|---|---|---|---|
| Q1 2024 | 5.4% | 4.0% | -0.1% | 5.3% |
| Q2 2024 | 5.3% | 3.9% | 0.0% | 5.3% |
| Q3 2024 | 5.0% | 3.7% | 0.0% | 5.0% |
| Q4 2024 | 4.7% | 3.4% | 0.1% | 4.8% |
| Q1 2025 | 4.5% | 3.2% | 0.1% | 4.5% |
| Q2 2025 | 4.3% | 3.0% | 0.1% | 4.3% |
| Q3 2025 | 4.1% | 2.7% | 0.1% | 4.0% |
| Q4 2025 | 3.9% | 2.7% | 0.2% | 3.8% |
| Q1 2026 | 3.7% | 2.6% | 0.3% | 3.5% |
| Q2 2026 | 3.5% | 2.6% | 0.4% | 3.5% |
| Q3 2026 | 3.3% | 2.6% | 0.4% | 3.5% |
| Q4 2026 | 3.1% | 2.6% | 0.6% | 3.5% |
| Q1 2027 | 2.9% | 2.6% | 0.6% | 3.5% |
| Q2 2027 | 2.9% | 2.6% | 0.6% | 3.5% |
| Q3 2027 | 2.9% | 2.6% | 0.6% | 3.5% |
| Q4 2027 | 2.9% | 2.6% | 0.6% | 3.5% |
| Q1 2028 | 2.9% | 2.6% | 0.6% | 3.5% |
| Q2 2028 | 2.9% | 2.6% | 0.6% | 3.5% |
| Q3 2028 | 2.9% | 2.6% | 0.6% | 3.5% |
| Q4 2028 | 2.9% | 2.6% | 0.6% | 3.5% |
As we can see, the U.S. is forecast to see its first rate cut in the second quarter of 2024.
Broadly speaking, rates will be cut very gradually, with two additional rate cuts anticipated for this year. By 2027, interest rates are projected to fall to 2.9% after a series of moderate rate cuts as inflation dissipates.
Like the U.S., the European Central Bank is forecast to cut rates in the second quarter of 2024, with rates set to fall to 2.6% by 2026. While inflation has cooled at a faster rate across Europe compared to the U.S., GDP growth is also projected to be more muted. This year, the IMF projects that GDP across the euro area will increase just 0.8% versus 2.7% for the U.S. economy.
In the UK, monetary easing is projected to move more gradually, with the first cut projected for the third quarter of this year. Growth across the UK economy is projected to be tepid for 2024, weighed down by the impact of higher rates, lower productivity, and sluggish investment growth.
Rates Rising Slowly in Japan
After years of enduring negative interest rates, Japan raised its short-term policy rate to 0.0-0.1% in March 2024.
This was due in part to a promising inflation outlook over the coming years. The IMF projects that the next rate hike will take place in the fourth quarter of 2024, as it moves away from a multi-decade battle with deflation.
Get the Full Analysis of the IMF’s Outlook on VC+
This visual is part of an exclusive special dispatch for VC+ members which breaks down the key takeaways from the IMF’s 2024 World Economic Outlook.
For the full set of charts and analysis, sign up for VC+.

-

 Wealth6 days ago
Charted: Which City Has the Most Billionaires in 2024?
-

 Mining2 weeks ago
Gold vs. S&P 500: Which Has Grown More Over Five Years?
-

 Uranium2 weeks ago
The World’s Biggest Nuclear Energy Producers
-

 Education2 weeks ago
How Hard Is It to Get Into an Ivy League School?
-

 Debt2 weeks ago
How Debt-to-GDP Ratios Have Changed Since 2000
-

 Sports2 weeks ago
The Highest Earning Athletes in Seven Professional Sports
-

 Science2 weeks ago
Visualizing the Average Lifespans of Mammals
-

 Brands1 week ago
How Tech Logos Have Evolved Over Time