Misc
Mapped: The Price of Starbucks Coffee, by Country
Article/Editing:
Click to view this graphic in a higher-resolution.
Mapped: The Price of Starbucks by Country
In 1971, three former students from the University of San Francisco set up the first Starbucks at Seattle’s Pike Place Market, selling fresh roasted coffee beans, teas, and spices from around the world. This was a relatively humble beginning for what is now the largest coffeehouse chain in the world.
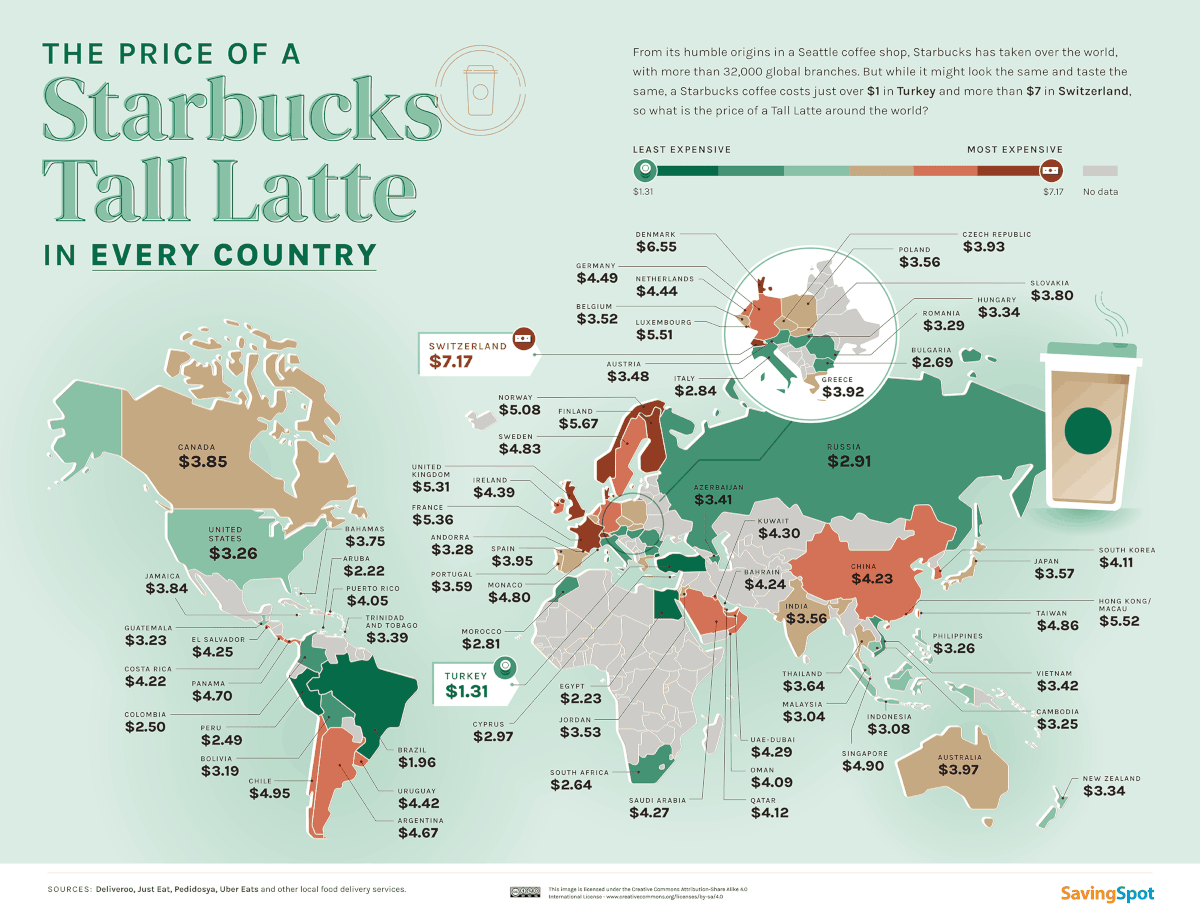
Today, Starbucks boasts 32,000 stores across 80 countries, second only to McDonald’s in the fast-food chain business. And like McDonald’s, the price of a coffee at Starbucks varies wildly depending on the country you’re in.
This map made by SavingSpot has the answer to which country has the most and least expensive Starbucks coffee, for those connoisseurs who want to get the most bang for their (Star)buck—or for those who want to examine relative cost and purchasing power.
Which Country Has the Most Expensive Starbucks Coffee?
The underlying data for this map uses a combination of sources, including delivery apps, Google Reviews, menu images, and desk research, all cross-checked to come up with the price of a Tall Latte per country (converted to USD).
Per their findings, the most expensive Tall Latte (12 oz) in the world can be found in Switzerland for $7.17. On the other hand, the same drink can be bought for a little over a dollar in Türkiye.
Here’s the full rankings of the “Tall Latte Index”:
| Country | Tall Latte Price |
|---|---|
| Türkiye | $1.31 |
| Brazil | $1.96 |
| Aruba | $2.22 |
| Egypt | $2.23 |
| Peru | $2.49 |
| Colombia | $2.50 |
| South Africa | $2.64 |
| Bulgaria | $2.69 |
| Morocco | $2.81 |
| Italy | $2.84 |
| Russia | $2.91 |
| Cyprus | $2.97 |
| Malaysia | $3.04 |
| Indonesia | $3.08 |
| Bolivia | $3.19 |
| Guatemala | $3.23 |
| Cambodia | $3.25 |
| Philippines | $3.26 |
| United States | $3.26 |
| Andorra | $3.28 |
| Romania | $3.29 |
| Hungary | $3.34 |
| New Zealand | $3.34 |
| Trinidad and Tobago | $3.39 |
| Azerbaijan | $3.41 |
| Vietnam | $3.42 |
| Austria | $3.48 |
| Belgium | $3.52 |
| Jordan | $3.53 |
| India | $3.56 |
| Poland | $3.56 |
| Japan | $3.57 |
| Portugal | $3.59 |
| Thailand | $3.64 |
| Bahamas | $3.75 |
| Slovakia | $3.80 |
| Jamaica | $3.84 |
| Canada | $3.85 |
| Greece | $3.92 |
| Czech Republic | $3.93 |
| Spain | $3.95 |
| Australia | $3.97 |
| Puerto Rico | $4.05 |
| Oman | $4.09 |
| South Korea | $4.11 |
| Qatar | $4.12 |
| Costa Rica | $4.22 |
| China | $4.23 |
| Bahrain | $4.24 |
| El Salvador | $4.25 |
| Saudi Arabia | $4.27 (Iced Caffè Latte) |
| UAE-Dubai | $4.29 |
| Kuwait | $4.30 |
| Ireland | $4.39 |
| Uruguay | $4.42 |
| Netherlands | $4.44 |
| Germany | $4.49 |
| Argentina | $4.67 |
| Panama | $4.70 |
| Monaco | $4.80 |
| Sweden | $4.83 |
| Taiwan | $4.86 |
| Singapore | $4.90 |
| Chile | $4.95 |
| Norway | $5.08 |
| United Kingdom | $5.31 |
| France | $5.36 |
| Luxembourg | $5.51 |
| Hong Kong/Macau | $5.52 |
| Finland | $5.67 |
| Denmark | $6.55 |
| Switzerland | $7.17 |
The U.S. has the 21st-least expensive coffee in the world at $3.26 for a Tall Latte, making it an unusual combination of a high-income country with a low price. Usually, it’s more common to see countries with a “developing” or “low-to-middle income” status have cheaper Starbucks prices than higher-income countries.
The Price of a Tall Latte Relative to Income
However, simply converting local prices to USD doesn’t give the most accurate picture of how expensive Starbucks is in a country. Taking purchasing power into consideration, here’s how the price of a Tall Latte measures as a percentage of a country’s median daily income.
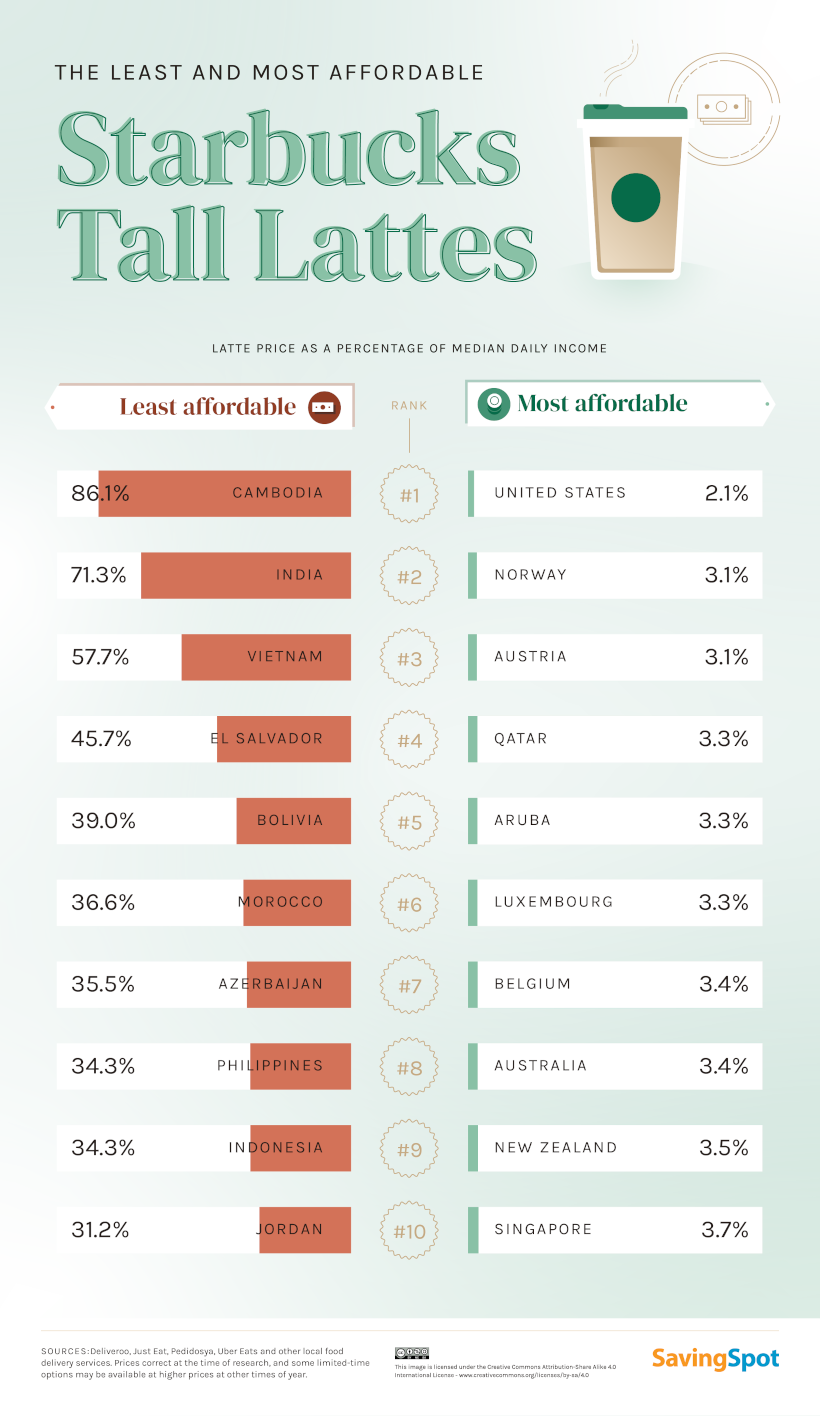
In Cambodia and India, it would take more than 70% of the median daily wage to buy a Starbucks coffee. Other countries with relatively cheaper Tall Lattes in U.S. dollar terms include Indonesia, Morocco, and Bolivia—but these are still not the most affordable for local customers.
For a more broad-based view of Starbucks affordability, SavingSpot has also charted the price of a Tall Latte against each country’s per capita GDP. Countries placing higher than the trendline get relatively bad value at Starbucks, while those below the line can get more lattes with their average local paycheck.
Switzerland, Denmark and Luxembourg all have expensive Tall Lattes, even relative to their high-earning populations.
But countries like Chile, Panama, and Argentina have the worst of both worlds. Not only do they have more expensive lattes than higher GDP per capita countries like Canada, the U.S., and Australia, they do so at a fraction of the income.
What’s the Most Expensive Starbucks Item?
Based on SavingSpot’s findings, the Iced Caramel Macchiato in Switzerland is the most expensive Starbucks menu item in the world, coming in at a whopping $9.31 for a coffee with vanilla-flavored syrup and a caramel drizzle.
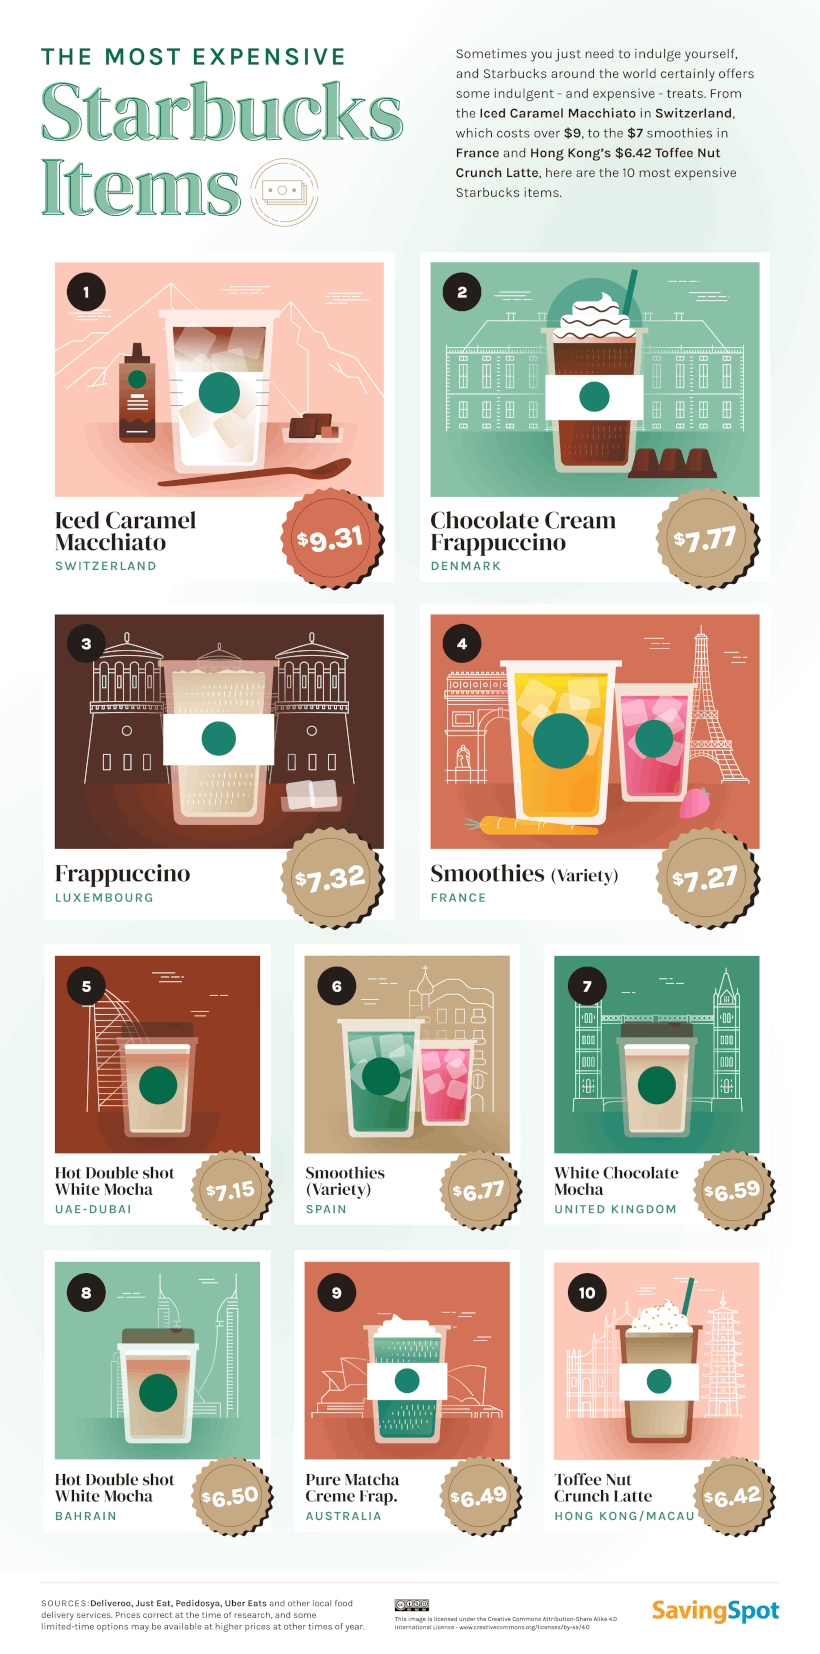
Denmark, Luxembourg, and France also have items well above the $7 USD price tag.
Whether those prices justify the quality of Starbucks coffee is a question best left up to the coffee aficionados, but for Starbucks, it’s a strategy that’s certainly helping the company’s earnings.

This article was published as a part of Visual Capitalist's Creator Program, which features data-driven visuals from some of our favorite Creators around the world.


Public Opinion
Charted: How Americans Feel About Federal Government Agencies
Fourteen of 16 federal government agencies garnered more favorable responses than unfavorable ones. But what were the outliers?
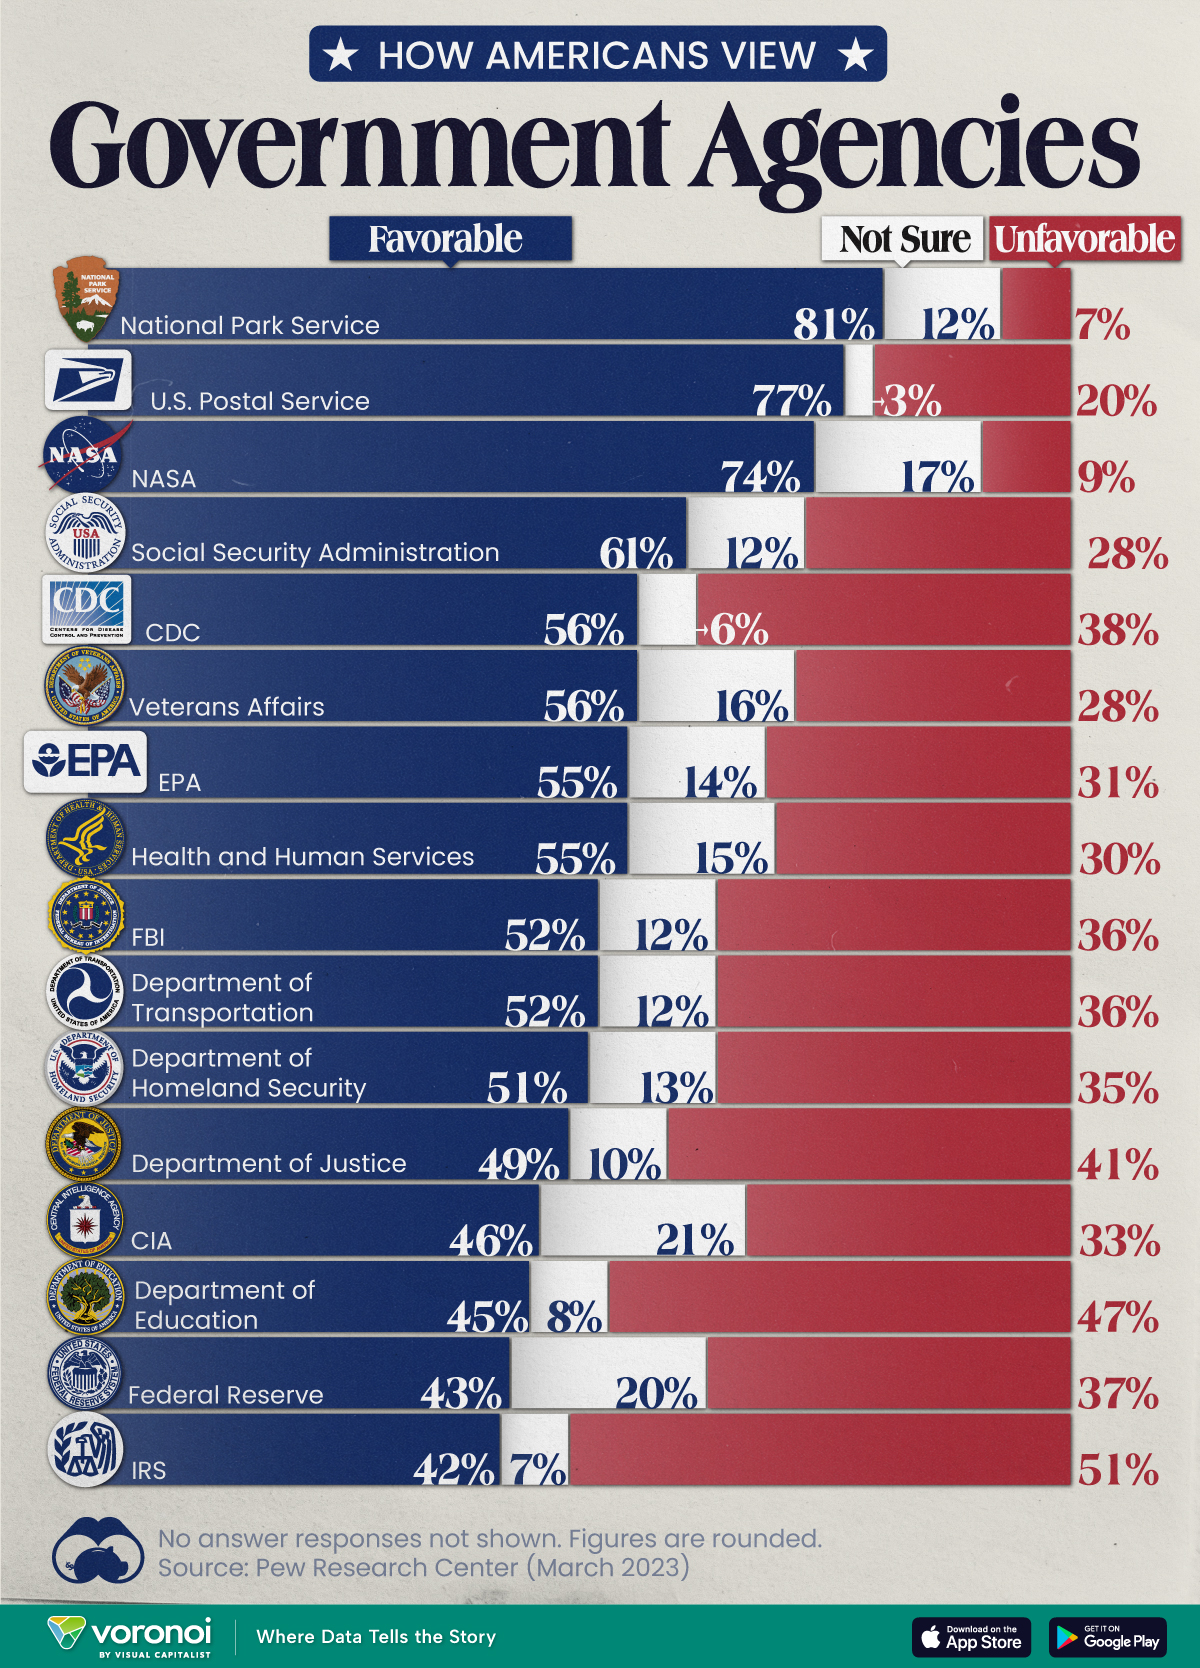
Chart: How Americans Rate 16 Federal Government Agencies
This was originally posted on our Voronoi app. Download the app for free on iOS or Android and discover incredible data-driven charts from a variety of trusted sources.
Come election time, America won’t hesitate to show its approval or disapproval of the country’s elected political representatives. That said, feelings about the federal bureaucracy and its associated agencies are a little harder to gauge.
We chart the results from an opinion poll conducted by Pew Research Center between March 13-19, 2023. In it, 10,701 adults—a representative of the U.S. adult population—were asked whether they felt favorably or unfavorably towards 16 different federal government agencies.
Americans Love the Park Service, Are Divided Over the IRS
Broadly speaking, 14 of the 16 federal government agencies garnered more favorable responses than unfavorable ones.
Of them, the Parks Service, Postal Service, and NASA all had the approval of more than 70% of the respondents.
| Agency | Favorable | Unfavorable | Not sure |
|---|---|---|---|
| 🏞️ National Park Service | 81% | 7% | 12% |
| 📮 U.S. Postal Service | 77% | 20% | 3% |
| 🚀 NASA | 74% | 9% | 17% |
| 💼 Social Security Administration | 61% | 28% | 12% |
| 🔬 CDC | 56% | 38% | 6% |
| 🎖️ Veterans Affairs | 56% | 28% | 16% |
| 🌿 EPA | 55% | 31% | 14% |
| 💉 Health & Human Services | 55% | 30% | 15% |
| 🕵️ FBI | 52% | 36% | 12% |
| 🚗 Department of Transportation | 52% | 36% | 12% |
| 🛡️ Department of Homeland Security | 51% | 35% | 13% |
| ⚖️ Department of Justice | 49% | 41% | 10% |
| 🕵️♂️ CIA | 46% | 33% | 21% |
| 📚 Department of Education | 45% | 47% | 8% |
| 💰 Federal Reserve | 43% | 37% | 20% |
| 💼 IRS | 42% | 51% | 7% |
Note: Figures are rounded. No answer responses are not shown.
Only the Department of Education and the IRS earned more unfavorable responses, and between them, only the IRS had a majority (51%) of unfavorable responses.
There are some caveats to remember with this data. Firstly, tax collection is a less-friendly activity than say, maintaining picturesque parks. Secondly, the survey was conducted a month before taxes were typically due, a peak time for experiencing filing woes.
Nevertheless, the IRS has come under fire in recent years. As per a New York Times article in 2019, eight years of budget cuts have stymied the agency’s ability to scrutinize tax filings from wealthier and more sophisticated filers.
At the same time poorer Americans are facing increasing audits on wage subsidies available to low income workers. According to a Transactional Records Access Clearinghouse report, this subset of filers was audited five-and-a-half more times the average American.

-

 Markets5 days ago
Mapped: The Most Valuable Company in Each Southeast Asian Country
-

 Markets2 weeks ago
The Top Private Equity Firms by Country
-

 Jobs2 weeks ago
The Best U.S. Companies to Work for According to LinkedIn
-

 Economy2 weeks ago
Ranked: The Top 20 Countries in Debt to China
-

 Politics2 weeks ago
Charted: Trust in Government Institutions by G7 Countries
-

 Energy1 week ago
Mapped: The Age of Energy Projects in Interconnection Queues, by State
-

 Mining1 week ago
Visualizing Global Gold Production in 2023
-

 Markets1 week ago
Visualized: Interest Rate Forecasts for Advanced Economies