

Globally, central banks bought a record 1,136 tonnes of gold in 2022. How has central bank gold demand changed over the last three decades?
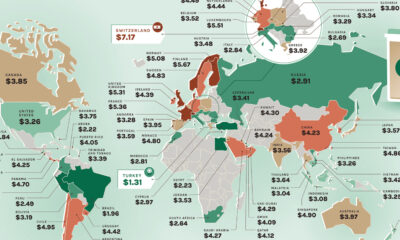

Where would you find the most and least expensive Starbucks coffee? These maps show the price of a Tall Latte in every country.
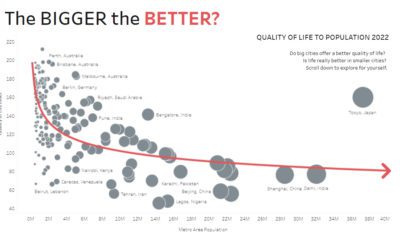

Are big cities all they’re cracked up to be? These interactive charts about population size question whether bigger always equals better.
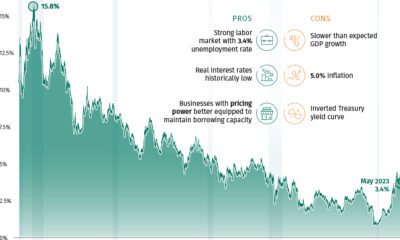

The Federal Reserve has raised U.S. interest rates five times in 2022, but how do today’s levels compare to historical interest rates?


This graphic compares the cost of living and purchasing power of 578 cities worldwide, using New York City as a benchmark for comparison.
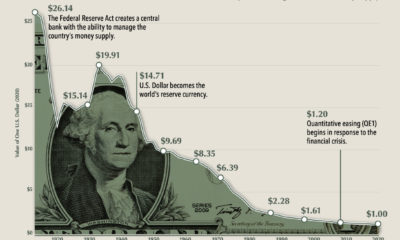

$1 in 1913 had the same purchasing power as $26 in 2020. This chart shows how the purchasing power of the dollar has changed over time.
Every dollar spent is not equal. In some cities like NYC or SF, it will buy you far less - and in other places, a dollar...
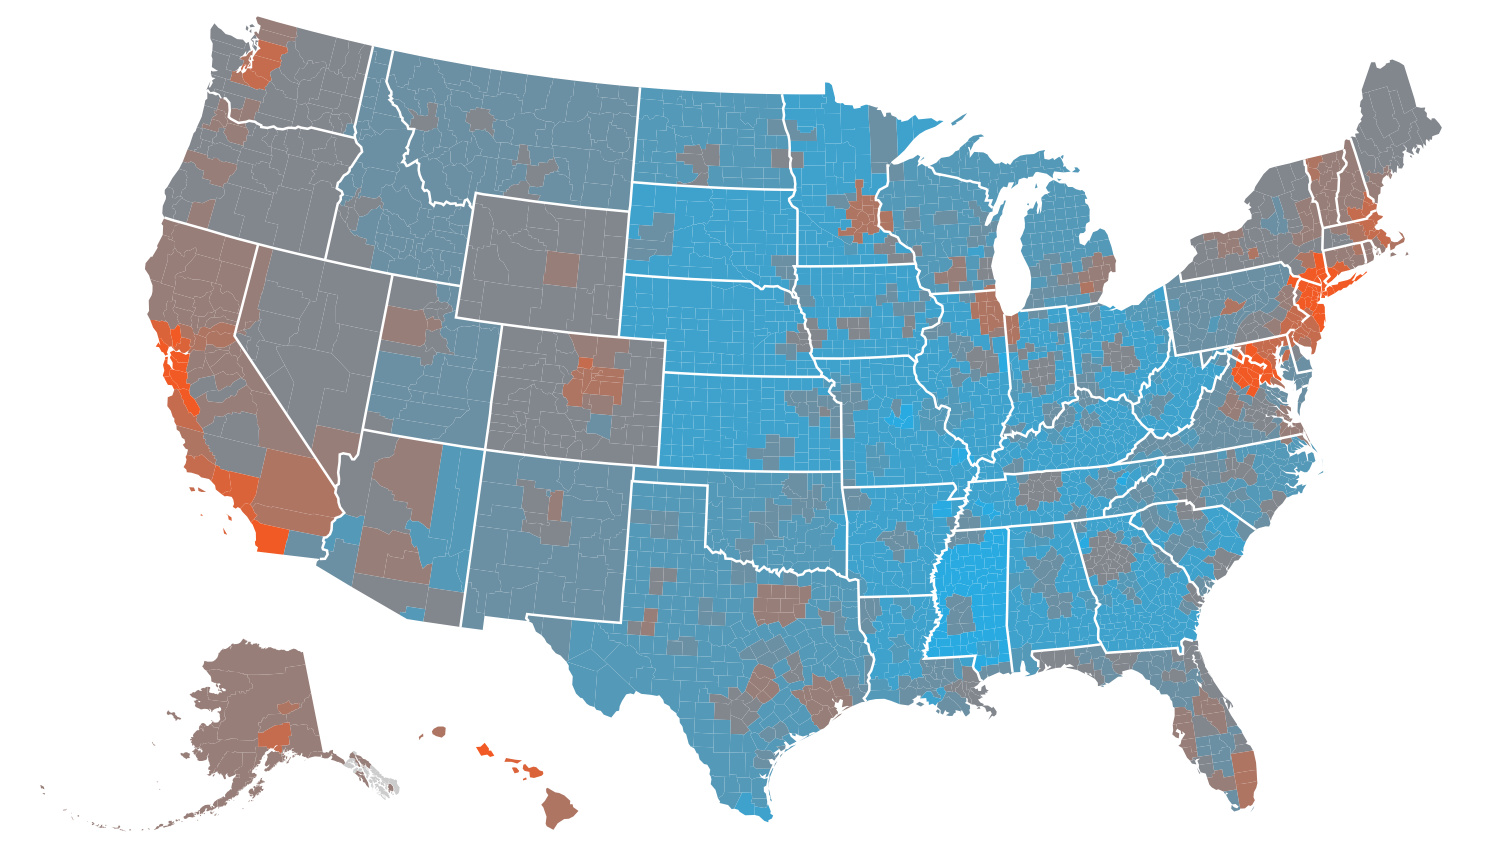
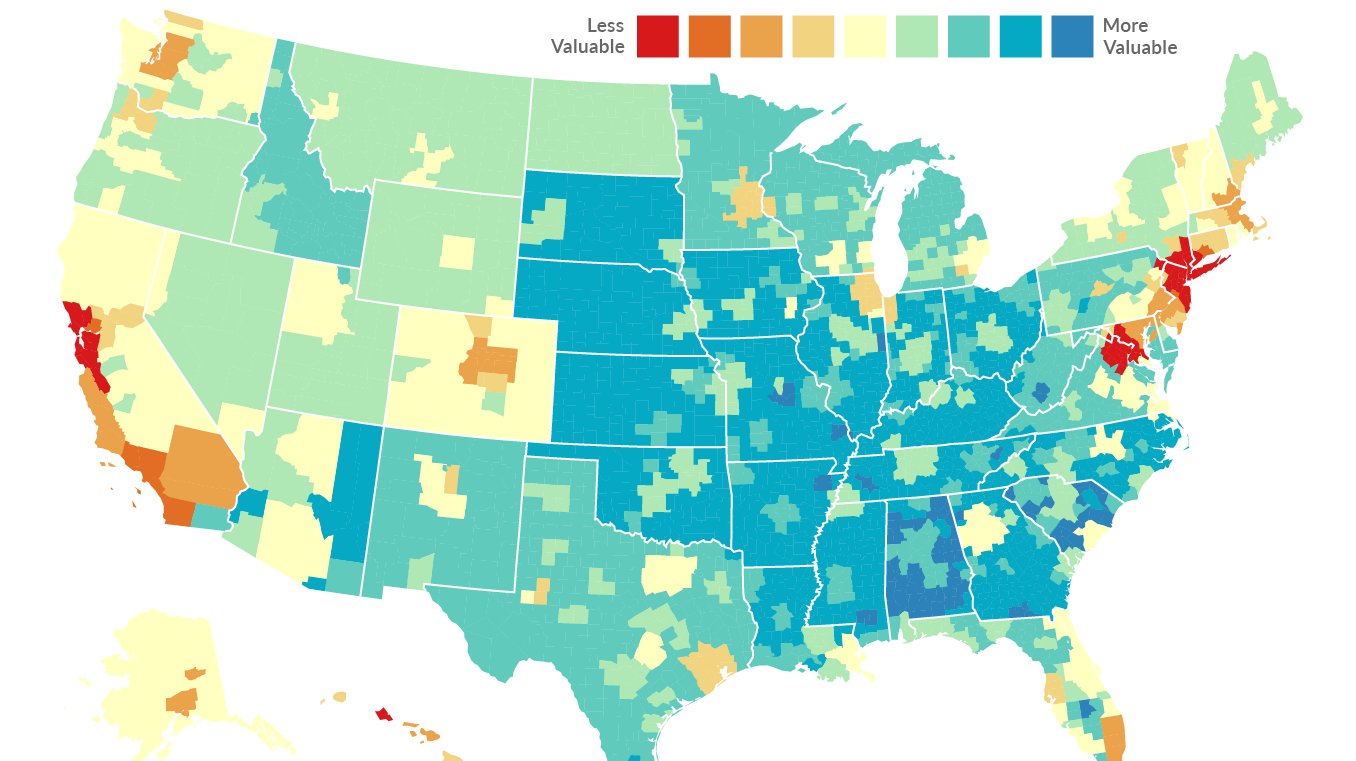
The cost of living by state and county varies significantly. Here's how far $100 will go in every part of America.


 Creator Program