Visualizing 40 Years of U.S. Interest Rates


Visualizing 40 Years of U.S. Interest Rates
In 2022, the Federal Reserve hiked interest rates by 400 basis points in one of the fastest rate increases in decades. In May, it raised rates to a range of 5.0-5.25%, a 16-year high.
Yet in spite of these increases, rates still fall below historical averages.
In Part 1 of our Understanding Market Trends series from Citizens, we show interest rate trends over modern history, and the implications of increasingly hawkish monetary policy in today’s environment.
U.S. Interest Rates: Reversing the Trend
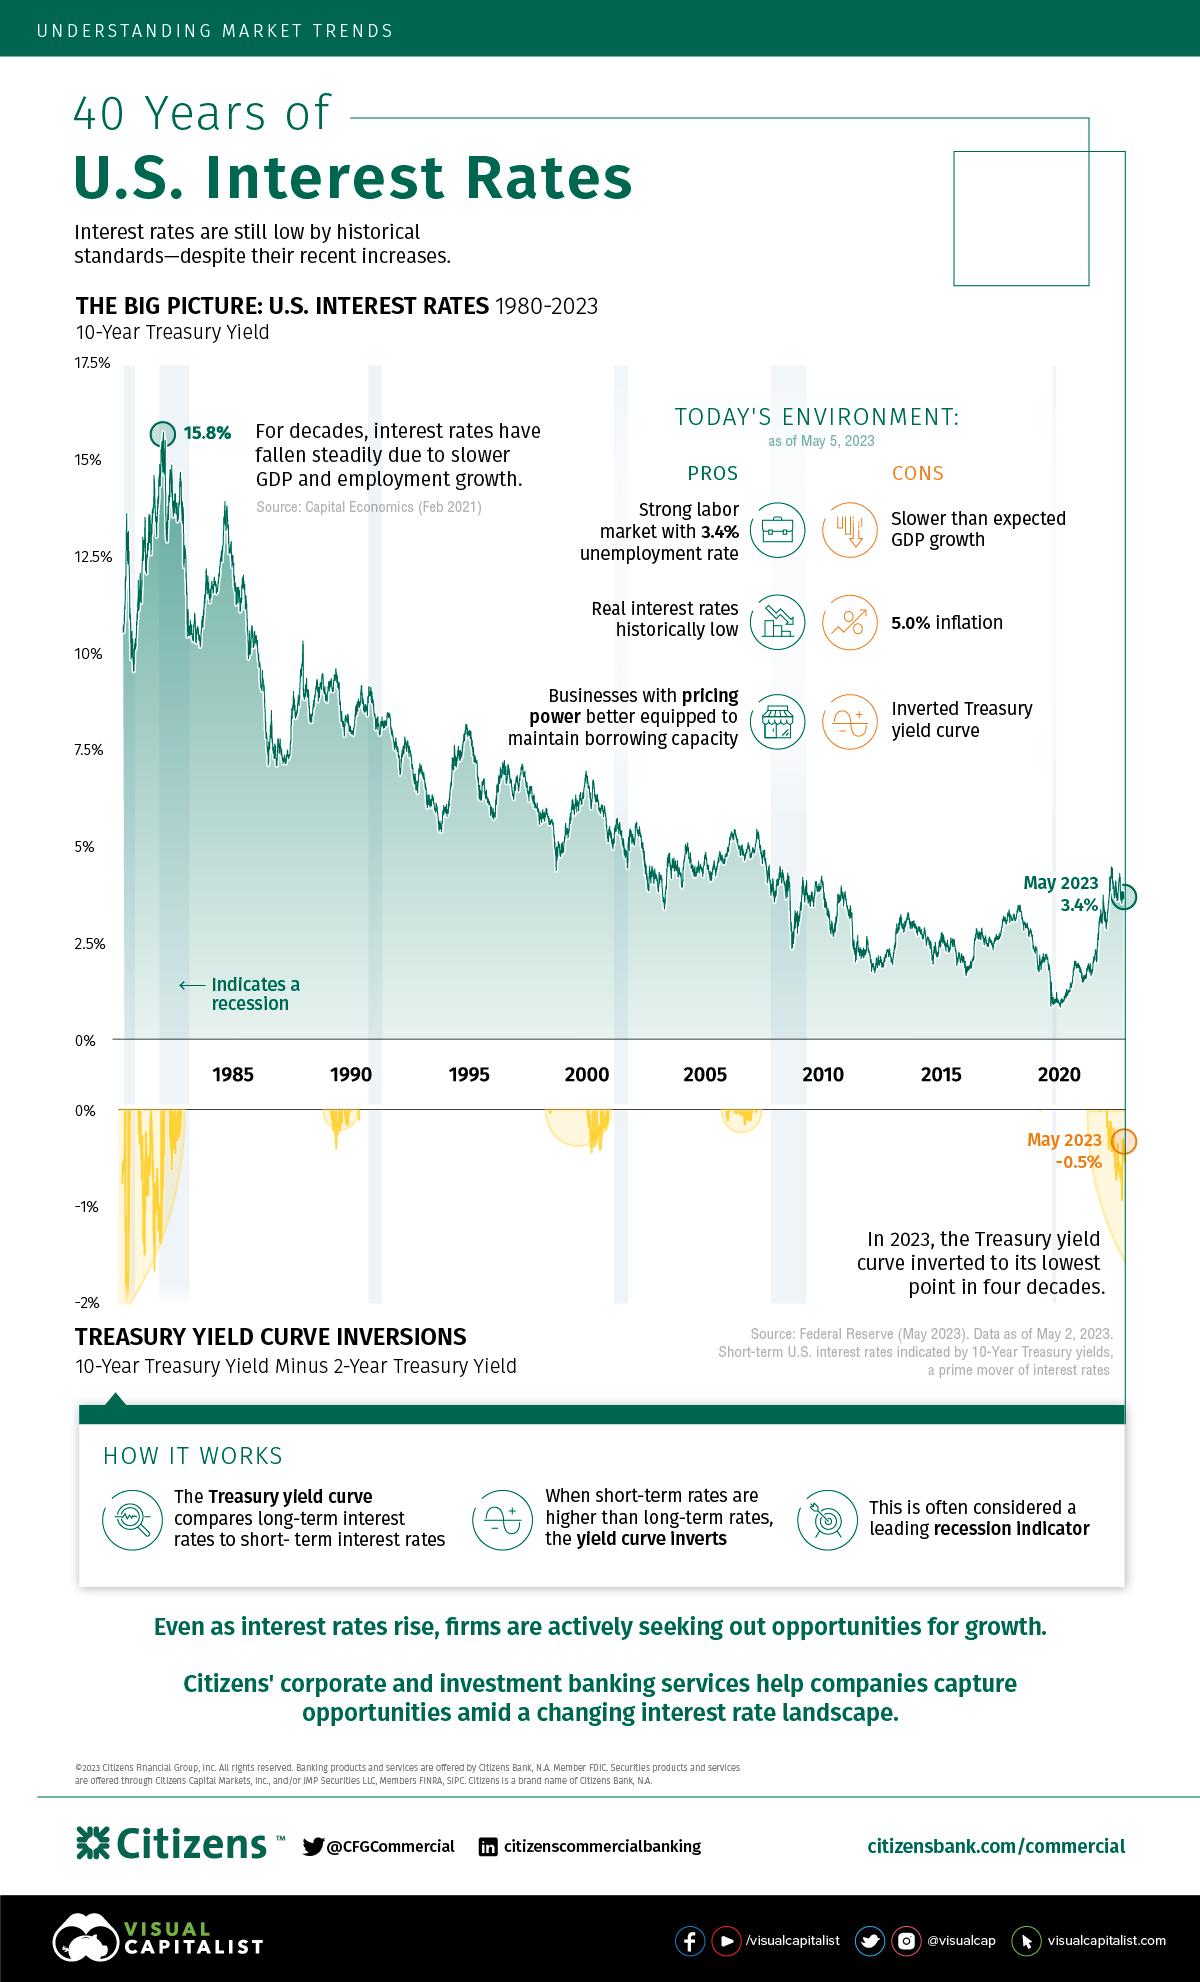
For decades, U.S. interest rates have fallen due to structural factors including slower GDP and employment growth.
But with COVID-19, trillions in fiscal stimulus, and Russia’s invasion of Ukraine, demand dynamics have dramatically shifted. U.S. inflation hit 40-year highs, met with a strong labor market. As a result, the Federal Reserve has made aggressive moves to raise rates to prevent the economy from overheating.
Below, we show average annual 10-year Treasury yields, a proxy for U.S. interest rates, and their annual percentage change since 1980. Data is as of May 2, 2023.
| Year | Average U.S. Interest Rate | Annual Percentage Change |
|---|---|---|
| 2023* | 3.6% | -11.3% |
| 2022 | 3.0% | 155.3% |
| 2021 | 1.5% | 63% |
| 2020 | 0.9% | -52% |
| 2019 | 2.1% | -29% |
| 2018 | 2.9% | 12% |
| 2017 | 2.3% | -2% |
| 2016 | 1.8% | 8% |
| 2015 | 2.1% | 5% |
| 2014 | 2.5% | -29% |
| 2013 | 2.4% | 71% |
| 2012 | 1.8% | -6% |
| 2011 | 2.8% | -43% |
| 2010 | 3.2% | -14% |
| 2009 | 3.3% | 71% |
| 2008 | 3.7% | -44% |
| 2007 | 4.6% | -14% |
| 2006 | 4.8% | 7% |
| 2005 | 4.3% | 4% |
| 2004 | 4.3% | -1% |
| 2003 | 4.0% | 11% |
| 2002 | 4.6% | -24% |
| 2001 | 5.0% | -1% |
| 2000 | 6.0% | -21% |
| 1999 | 5.7% | 39% |
| 1998 | 5.3% | -19% |
| 1997 | 6.4% | -11% |
| 1996 | 6.4% | 15% |
| 1995 | 6.6% | -29% |
| 1994 | 7.1% | 34% |
| 1993 | 5.9% | -13% |
| 1992 | 7.0% | 0% |
| 1991 | 7.9% | -17% |
| 1990 | 8.6% | 2% |
| 1989 | 8.5% | -13% |
| 1988 | 8.9% | 4% |
| 1987 | 8.4% | 22% |
| 1986 | 7.7% | -20% |
| 1985 | 10.6% | -22% |
| 1984 | 12.5% | -2% |
| 1983 | 11.1% | 14% |
| 1982 | 13.0% | -26% |
| 1981 | 13.9% | 12% |
| 1980 | 11.4% | 20% |
Over the last four decades, the highest average annual interest rate was 13.9% in 1981, while the lowest was 0.9% in 2020.
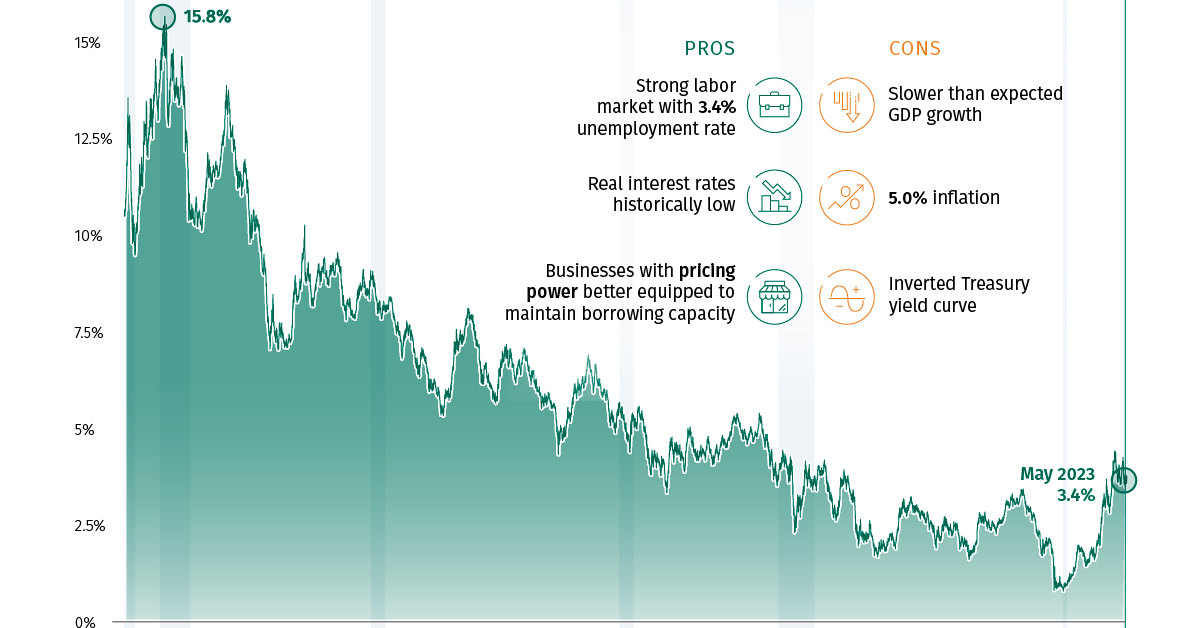
Benefits and Drawbacks
As interest rates rise from historic lows, what are the advantages and disadvantages of the current environment?
| Pros | Cons |
|---|---|
| Strong labor market with 3.4% unemployment rate | Slower than expected GDP growth |
| Real interest rates historically low | 5.0% inflation |
| Businesses with pricing power better equipped to maintain borrowing capacity | Inverted Treasury yield curve |
On one hand, real interest rates remain near historic lows. After falling negative in 2021, 10-year real interest rates hover around 1.4%. Meanwhile, unemployment rates are below historical averages. As of March, there were about two job openings for every unemployed person.
In today’s environment, businesses with pricing power will likely be more resilient to maintain borrowing capacity and healthier margins.
On the other hand, as interest rates rise, it becomes more expensive for firms to access corporate debt as lending conditions become more constricted.
Spillover Effects of Rising U.S. Interest Rates
As U.S. interest rates have increased, market participants have become increasingly pessimistic of the near-term economic outlook.
Consequently, the yield on short-term U.S. bonds has risen since near-term risks appear greater than risks in the long term. The 10-year minus 2-year Treasury yield curve, which subtracts short-term bond yields from longer-term yields, illustrates this trend.
In March, the Treasury yield inverted to -1.07 basis points, one of the lowest points in decades.
When this yield curve inverts, meaning short-term yields are higher than long-term yields, it often signals market uncertainty. Historically, this has signaled a recession, but often with a several-month lag.
What Are the Implications for Businesses?
Years of ultra-low interest rates have supported profit growth and more accommodative lending conditions. As interest rates rise, debt costs will increase, putting a strain on firms’ bottom lines, especially for companies with floating-rate debt.
Additionally, as companies look to refinance debt, borrowing costs will become higher.
The good news is that companies borrowing at fixed rates will be better positioned. Middle market private equity firms—those that acquire companies valued between $50 and $500 million—have seen revenues increase 11% compared to the first quarter of last year, while profit margins have expanded. The impact of the March 2023 banking crisis was not covered in the data.
In turn, companies with strong pricing power, improving cost management, and the ability to pass on rising costs to customers will be better able to navigate today’s uncertain environment. Given the number of variables at play, firms that adapt quickly could have greater resilience.
In Part 2 of the Understanding Market Trends series, we look at how disinflation may affect company financing.

-

 Markets2 days ago
U.S. Debt Interest Payments Reach $1 Trillion
U.S. debt interest payments have surged past the $1 trillion dollar mark, amid high interest rates and an ever-expanding debt burden.
-

 Markets3 days ago
Ranked: The Largest U.S. Corporations by Number of Employees
We visualized the top U.S. companies by employees, revealing the massive scale of retailers like Walmart, Target, and Home Depot.
-

 Markets1 week ago
The Top 10 States by Real GDP Growth in 2023
This graphic shows the states with the highest real GDP growth rate in 2023, largely propelled by the oil and gas boom.
-

 Travel1 week ago
Ranked: The World’s Top Flight Routes, by Revenue
In this graphic, we show the highest earning flight routes globally as air travel continued to rebound in 2023.
-

 Real Estate1 week ago
Ranked: The Most Valuable Housing Markets in America
The U.S. residential real estate market is worth a staggering $47.5 trillion. Here are the most valuable housing markets in the country.
-

 Markets1 week ago
Charted: Big Four Market Share by S&P 500 Audits
Which of the Big Four accounting firms take home the most audit fees from their S&P 500 clients?