Countries
Charted: Hours Worked vs. Salaries in OECD Countries
Article/Editing:
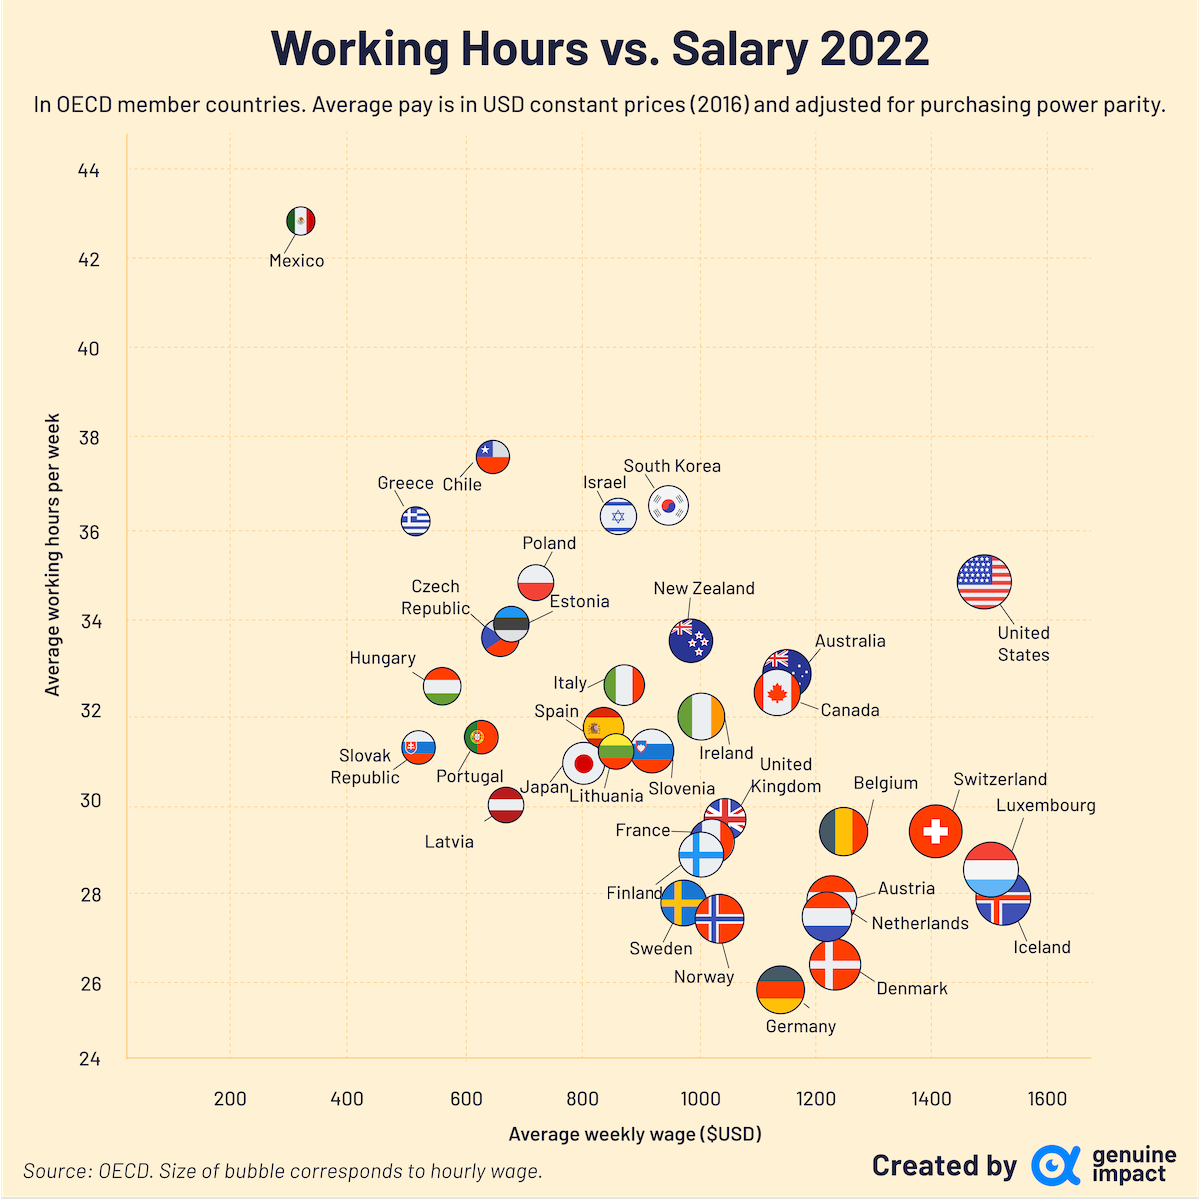
Comparing Weekly Work Hours and Salaries in OECD Countries
The Organization for Economic Co-operation and Development (OECD) is generally regarded as a collection of highly developed, high income countries. However with 38 member states from across the globe, economic prosperity can still vary widely between these nations.
To illustrate this, Truman Du from Genuine Impact charts the average weekly work hours and salaries across the OECD in 2022.
Ranked: OECD Countries By Working Hours & Average Pay
Here’s a list of 35 OECD countries ranked by their weekly wage in 2022.
Iceland has the highest weekly wage at $1,528 in the OECD block much higher than all four of its Nordic neighbors. This results in Icelandic workers, on average, earning nearly $55/hour.
| Rank | Country | Avg. Weekly Wage (USD) | Avg. Weekly Work (Hours) | Avg. Hourly Rate (USD) |
|---|---|---|---|---|
| 1 | 🇮🇸 Iceland | $1,528.33 | 27.87 | $54.84 |
| 2 | 🇱🇺 Luxembourg | $1,505.96 | 28.33 | $53.15 |
| 3 | 🇺🇸 United States | $1,489.68 | 34.83 | $42.78 |
| 4 | 🇨🇭 Switzerland | $1,403.71 | 29.40 | $47.75 |
| 5 | 🇧🇪 Belgium | $1,247.07 | 29.35 | $42.50 |
| 6 | 🇩🇰 Denmark | $1,233.20 | 26.38 | $46.75 |
| 7 | 🇦🇹 Austria | $1,226.95 | 27.76 | $44.19 |
| 8 | 🇳🇱 Netherlands | $1,215.87 | 27.44 | $44.31 |
| 9 | 🇦🇺 Australia | $1,142.46 | 32.83 | $34.80 |
| 10 | 🇨🇦 Canada | $1,135.58 | 32.42 | $35.02 |
| 11 | 🇩🇪 Germany | $1,133.47 | 25.79 | $43.96 |
| 12 | 🇬🇧 United Kingdom | $1,038.17 | 29.46 | $35.24 |
| 13 | 🇳🇴 Norway | $1,033.77 | 27.40 | $37.73 |
| 14 | 🇫🇷 France | $1,014.68 | 29.07 | $34.91 |
| 15 | 🇮🇪 Ireland | $1,004.67 | 31.87 | $31.52 |
| 16 | 🇫🇮 Finland | $996.84 | 28.81 | $34.60 |
| 17 | 🇳🇿 New Zealand | $975.43 | 33.62 | $29.02 |
| 18 | 🇸🇪 Sweden | $969.36 | 27.70 | $34.99 |
| 19 | 🇰🇷 South Korea | $940.81 | 36.56 | $25.73 |
| 20 | 🇸🇮 Slovenia | $907.76 | 31.13 | $29.16 |
| 21 | 🇮🇹 Italy | $863.33 | 32.59 | $26.49 |
| 22 | 🇮🇱 Israel | $849.15 | 36.38 | $23.34 |
| 23 | 🇱🇹 Lithuania | $843.74 | 31.23 | $27.01 |
| 24 | 🇪🇸 Spain | $824.22 | 31.61 | $26.08 |
| 25 | 🇯🇵 Japan | $798.25 | 30.90 | $25.83 |
| 26 | 🇵🇱 Poland | $709.55 | 34.90 | $20.33 |
| 27 | 🇪🇪 Estonia | $667.40 | 34.05 | $19.60 |
| 28 | 🇱🇻 Latvia | $656.46 | 29.87 | $21.98 |
| 29 | 🇨🇿 Czech Republic | $643.76 | 33.73 | $19.08 |
| 30 | 🇨🇱 Chile | $635.42 | 37.75 | $16.83 |
| 31 | 🇵🇹 Portugal | $613.88 | 31.44 | $19.52 |
| 32 | 🇭🇺 Hungary | $547.59 | 32.68 | $16.75 |
| 33 | 🇸🇰 Slovak Republic | $505.05 | 31.19 | $16.19 |
| 34 | 🇬🇷 Greece | $499.60 | 36.27 | $13.77 |
| 35 | 🇲🇽 Mexico | $320.87 | 42.81 | $7.49 |
Note: 2022 data for OECD members Colombia, Costa Rica, and Türkiye is missing from the source and has not been included.
Luxembourg, ranked second place, is the only other country with an average weekly wage that comes in above $1,500.
The U.S. ($1,490), Switzerland ($1,404), and Belgium ($1,247) round out the top five countries with the highest weekly pay in the OECD.
On the other hand, Mexican workers make around $321 a week, the lowest in this dataset.
Hourly Wages & Cost of Living
Despite the wage data using PPP-adjusted metrics, it still doesn’t fully account for discrepancies in local prices, which are influenced by complex factors like tariffs and fuel costs for imported goods, the impact of monopolies and cartels, the price of non-traded goods (energy, housing costs) and government taxes.
And while the difference in salaries seem massive, paying workers enough to meet their costs of living also plays a factor. Countries with higher weekly wages also correlate with a much higher cost of living and vice versa.
Switzerland, Denmark, and Iceland for example are in the top 10 countries with the highest cost of living compared to Mexico, which is far more affordable.
So, while it seems that an average Icelandic worker makes almost 7x what an average Mexican worker makes, the reality of how much of that wage is spent in supporting an average lifestyle in both countries is less direct.

This article was published as a part of Visual Capitalist's Creator Program, which features data-driven visuals from some of our favorite Creators around the world.


Demographics
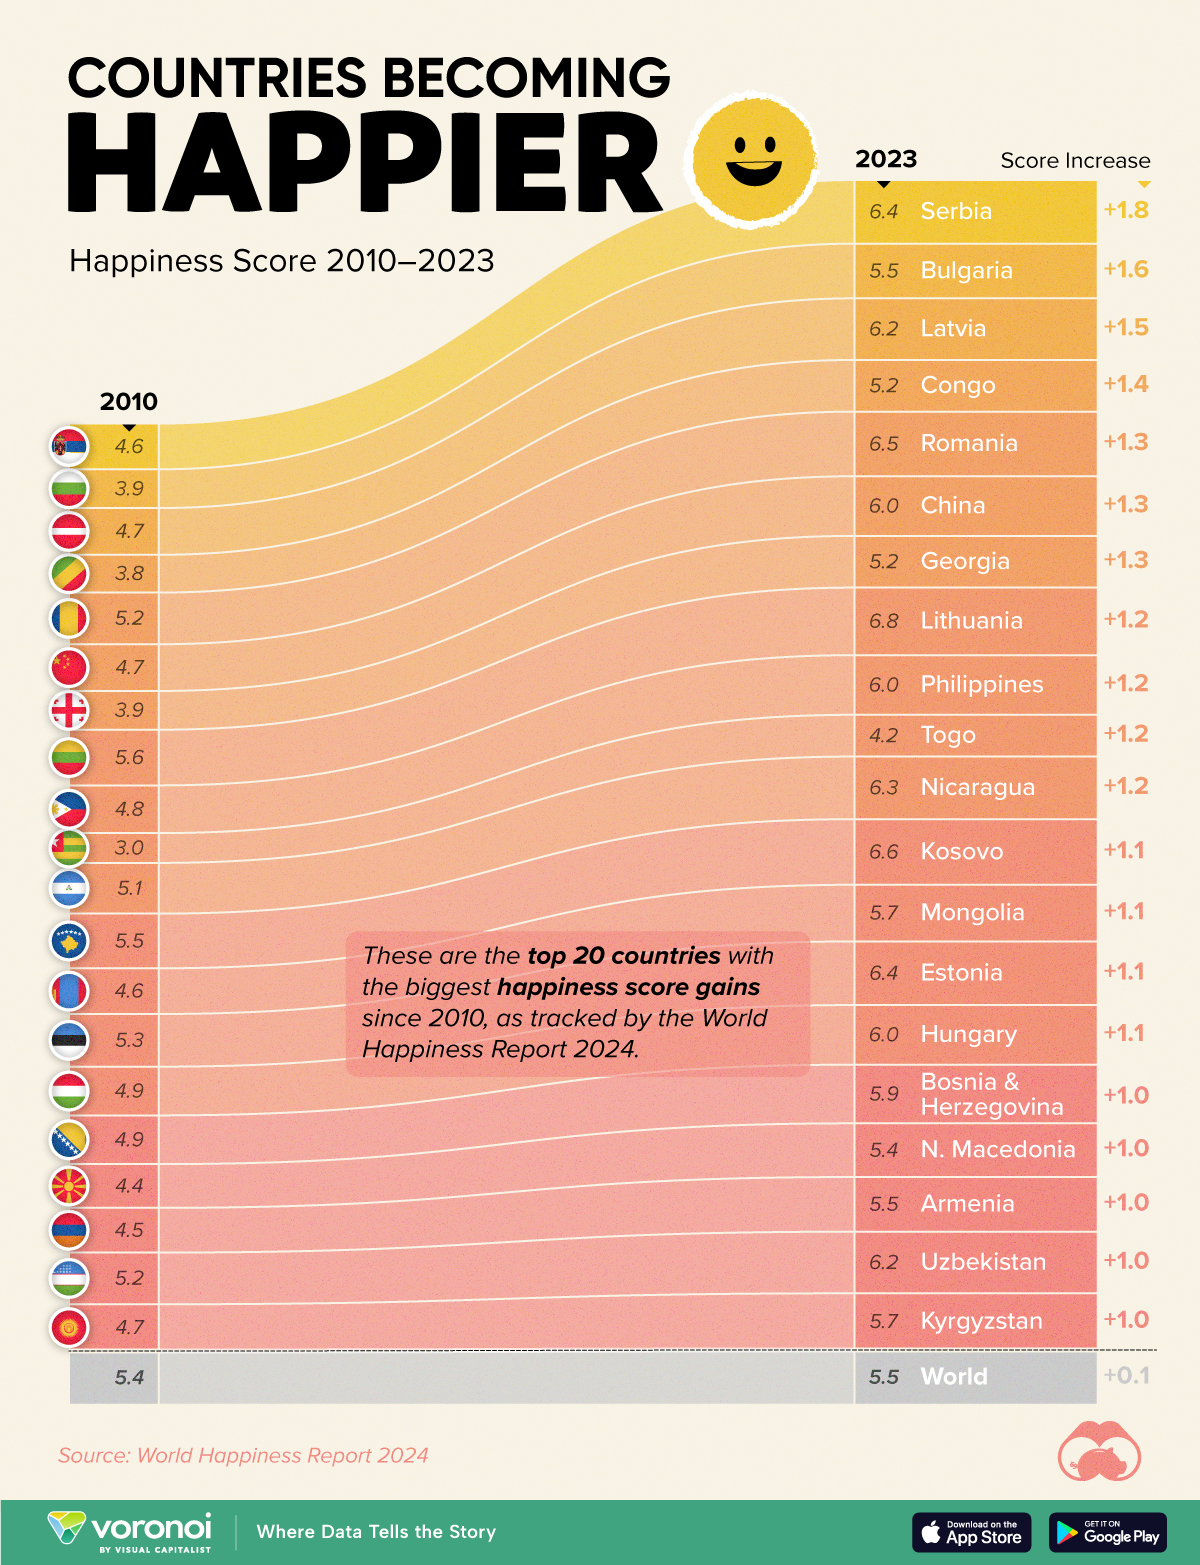
Countries With the Largest Happiness Gains Since 2010
Tracking Gallup survey data for more than a decade reveals insights into the regions seeing happiness gains.
Countries With the Largest Happiness Gains Since 2010
This was originally posted on our Voronoi app. Download the app for free on iOS or Android and discover incredible data-driven charts from a variety of trusted sources.
In 2011, Bhutan sponsored a UN resolution that invited governments to prioritize happiness and well-being as a way to measure social and economic development.
And thus, the World Happiness Report was born.
In 2012, the first report released, examining Gallup poll data from 2006–2010 that asked respondents in nearly every country to evaluate their life on a 0–10 scale. From this they extrapolated a single “happiness score” out of 10 to compare how happy countries are.
More than a decade later, the 2024 World Happiness Report continues the mission to quantify, measure, and compare well-being. Its latest findings also include how countries have become happier in the intervening years.
We visualize these findings in the above chart, which shows the 20 countries that have seen their happiness scores grow the most since 2010.
Which Countries Have Become Happier Since 2010?
Serbia leads a list of 12 Eastern European nations whose average happiness score has improved more than 20% in the last decade.
In the same time period, the Serbian economy has doubled to $80 billion, and its per capita GDP has nearly doubled to $9,538 in current dollar terms.
| Rank | Country | Happiness Score Gains (2010–2024) | 2024 Happiness Score (out of 10) |
|---|---|---|---|
| 1 | 🇷🇸 Serbia | +1.8 | 6.4 |
| 2 | 🇧🇬 Bulgaria | +1.6 | 5.5 |
| 3 | 🇱🇻 Latvia | +1.5 | 6.2 |
| 4 | 🇨🇬 Congo | +1.4 | 5.2 |
| 5 | 🇷🇴 Romania | +1.3 | 6.5 |
| 6 | 🇨🇳 China | +1.3 | 6.0 |
| 7 | 🇬🇪 Georgia | +1.3 | 5.2 |
| 8 | 🇱🇹 Lithuania | +1.2 | 6.8 |
| 9 | 🇵🇭 Philippines | +1.2 | 6.0 |
| 10 | 🇹🇬 Togo | +1.2 | 4.2 |
| 11 | 🇳🇮 Nicaragua | +1.2 | 6.3 |
| 12 | 🇽🇰 Kosovo | +1.1 | 6.6 |
| 13 | 🇲🇳 Mongolia | +1.1 | 5.7 |
| 14 | 🇪🇪 Estonia | +1.1 | 6.4 |
| 15 | 🇭🇺 Hungary | +1.1 | 6.0 |
| 16 | 🇧🇦 Bosnia & Herzegovina | +1.0 | 5.9 |
| 17 | 🇲🇰 North Macedonia | +1.0 | 5.4 |
| 18 | 🇦🇲 Armenia | +1.0 | 5.5 |
| 19 | 🇺🇿 Uzbekistan | +1.0 | 6.2 |
| 20 | 🇰🇬 Kyrgyzstan | +1.0 | 5.7 |
| N/A | 🌍 World | +0.1 | 5.5 |
Since the first report, Western Europe has on average been happier than Eastern Europe. But as seen with these happiness gains, Eastern Europe is now seeing their happiness levels converge closer to their Western counterparts. In fact, when looking at those under the age of 30, the most recent happiness scores are nearly the same across the continent.
All in all, 20 countries have increased their happiness score by a full point or more since 2010, on the 0–10 scale.

-

 Education1 week ago
How Hard Is It to Get Into an Ivy League School?
-

 Technology2 weeks ago
Ranked: Semiconductor Companies by Industry Revenue Share
-

 Markets2 weeks ago
Ranked: The World’s Top Flight Routes, by Revenue
-

 Demographics2 weeks ago
Population Projections: The World’s 6 Largest Countries in 2075
-

 Markets2 weeks ago
The Top 10 States by Real GDP Growth in 2023
-

 Demographics2 weeks ago
The Smallest Gender Wage Gaps in OECD Countries
-

 Economy2 weeks ago
Where U.S. Inflation Hit the Hardest in March 2024
-

 Green2 weeks ago
Top Countries By Forest Growth Since 2001